Investigate NetQ Issues
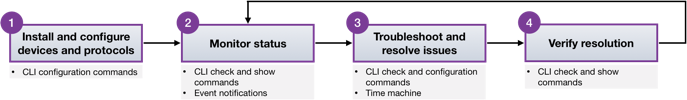
Monitoring of systems inevitably leads to the need to troubleshoot and resolve the issues found. In fact network management follows a common pattern as shown in this diagram.
This topic describes some of the tools and commands you can use to troubleshoot issues with the network and NetQ itself. Some example scenarios are included here:
- Viewing configuration and log files,
- Verifying NetQ Agent health,
- Investigating recent events, and
- Investigating events from the past
- Running a trace.
Try looking at the specific protocol or service, or particular devices as well. If none of these produce a resolution, you can capture a log to use in discussion with the Cumulus Networks support team.
Browse Configuration and Log Files
To aid in troubleshooting issues with NetQ, there are the following configuration and log files that can provide insight into the root cause of the issue:
| File | Description |
|---|---|
/etc/netq/netq.yml | The NetQ configuration file. This file appears only if you installed either the netq-apps package or the NetQ Agent on the system. |
/var/log/netqd.log | The NetQ daemon log file for the NetQ CLI. This log file appears only if you installed the netq-apps package on the system. |
/var/log/netq-agent.log | The NetQ Agent log file. This log file appears only if you installed the NetQ Agent on the system. |
Check NetQ Agent Health
Checking the health of the NetQ Agents is a good way to start troubleshooting NetQ on your network. If any agents are rotten, meaning three heartbeats in a row were not sent, then you can investigate the rotten node. Different views are offered with the NetQ UI and NetQ CLI.
Open the Validation Request card.
Select Default Validation AGENTS from the Validation dropdown.
Click Run Now.
The On-demand Validation Result card for NetQ Agents is placed on your workbench.
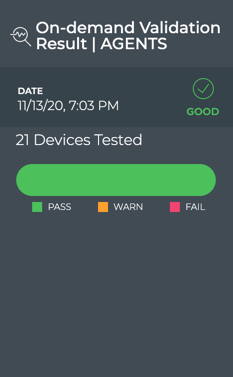
In the example below, no NetQ Agents are rotten. If there were nodes with indications of failures, warnings, rotten state, you could use the netq show agents command to view more detail about the individual NetQ Agents:
cumulus@switch:$ netq check agents
agent check result summary:

Total nodes         : 21
Checked nodes       : 21
Failed nodes        : 0
Rotten nodes        : 0
Warning nodes       : 0

Agent Health Test   : passed

cumulus@switch:~$ netq show agents
Matching agents records:
Hostname          Status           NTP Sync Version                              Sys Uptime                Agent Uptime              Reinitialize Time          Last Changed
----------------- ---------------- -------- ------------------------------------ ------------------------- ------------------------- -------------------------- -------------------------
border01          Fresh            yes      3.2.0-cl4u30~1601403318.104fb9ed     Fri Oct  2 20:32:59 2020  Fri Oct  2 22:24:49 2020  Fri Oct  2 22:24:49 2020   Fri Nov 13 22:46:05 2020
border02          Fresh            yes      3.2.0-cl4u30~1601403318.104fb9ed     Fri Oct  2 20:32:57 2020  Fri Oct  2 22:24:48 2020  Fri Oct  2 22:24:48 2020   Fri Nov 13 22:46:14 2020
fw1               Fresh            no       3.2.0-cl4u30~1601403318.104fb9ed     Fri Oct  2 20:36:33 2020  Mon Nov  2 19:49:21 2020  Mon Nov  2 19:49:21 2020   Fri Nov 13 22:46:17 2020
fw2               Fresh            no       3.2.0-cl4u30~1601403318.104fb9ed     Fri Oct  2 20:36:32 2020  Mon Nov  2 19:49:20 2020  Mon Nov  2 19:49:20 2020   Fri Nov 13 22:46:20 2020
leaf01            Fresh            yes      3.2.0-cl4u30~1601403318.104fb9ed     Fri Oct  2 20:32:56 2020  Fri Oct  2 22:24:45 2020  Fri Oct  2 22:24:45 2020   Fri Nov 13 22:46:01 2020
leaf02            Fresh            yes      3.2.0-cl4u30~1601403318.104fb9ed     Fri Oct  2 20:32:54 2020  Fri Oct  2 22:24:44 2020  Fri Oct  2 22:24:44 2020   Fri Nov 13 22:46:02 2020
leaf03            Fresh            yes      3.2.0-cl4u30~1601403318.104fb9ed     Fri Oct  2 20:32:59 2020  Fri Oct  2 22:24:49 2020  Fri Oct  2 22:24:49 2020   Fri Nov 13 22:46:14 2020
leaf04            Fresh            yes      3.2.0-cl4u30~1601403318.104fb9ed     Fri Oct  2 20:32:57 2020  Fri Oct  2 22:24:47 2020  Fri Oct  2 22:24:47 2020   Fri Nov 13 22:46:06 2020
oob-mgmt-server   Fresh            yes      3.2.0-ub18.04u30~1601400975.104fb9e  Fri Oct  2 19:54:09 2020  Fri Oct  2 22:26:32 2020  Fri Oct  2 22:26:32 2020   Fri Nov 13 22:45:59 2020
server01          Fresh            yes      3.2.0-ub18.04u30~1601400975.104fb9e  Fri Oct  2 22:39:27 2020  Mon Nov  2 19:49:31 2020  Mon Nov  2 19:49:31 2020   Fri Nov 13 22:46:08 2020
server02          Fresh            yes      3.2.0-ub18.04u30~1601400975.104fb9e  Fri Oct  2 22:39:26 2020  Mon Nov  2 19:49:32 2020  Mon Nov  2 19:49:32 2020   Fri Nov 13 22:46:12 2020
server03          Fresh            yes      3.2.0-ub18.04u30~1601400975.104fb9e  Fri Oct  2 22:39:27 2020  Mon Nov  2 19:49:32 2020  Mon Nov  2 19:49:32 2020   Fri Nov 13 22:46:11 2020
server04          Fresh            yes      3.2.0-ub18.04u30~1601400975.104fb9e  Fri Oct  2 22:39:27 2020  Mon Nov  2 19:49:32 2020  Mon Nov  2 19:49:32 2020   Fri Nov 13 22:46:10 2020
server05          Fresh            yes      3.2.0-ub18.04u30~1601400975.104fb9e  Fri Oct  2 22:39:26 2020  Mon Nov  2 19:49:33 2020  Mon Nov  2 19:49:33 2020   Fri Nov 13 22:46:14 2020
server06          Fresh            yes      3.2.0-ub18.04u30~1601400975.104fb9e  Fri Oct  2 22:39:26 2020  Mon Nov  2 19:49:34 2020  Mon Nov  2 19:49:34 2020   Fri Nov 13 22:46:14 2020
server07          Fresh            yes      3.2.0-ub18.04u30~1601400975.104fb9e  Fri Oct  2 20:47:24 2020  Mon Nov  2 19:49:35 2020  Mon Nov  2 19:49:35 2020   Fri Nov 13 22:45:54 2020
server08          Fresh            yes      3.2.0-ub18.04u30~1601400975.104fb9e  Fri Oct  2 20:47:24 2020  Mon Nov  2 19:49:35 2020  Mon Nov  2 19:49:35 2020   Fri Nov 13 22:45:57 2020
spine01           Fresh            yes      3.2.0-cl4u30~1601403318.104fb9ed     Fri Oct  2 20:32:29 2020  Fri Oct  2 22:24:20 2020  Fri Oct  2 22:24:20 2020   Fri Nov 13 22:45:55 2020
spine02           Fresh            yes      3.2.0-cl4u30~1601403318.104fb9ed     Fri Oct  2 20:32:48 2020  Fri Oct  2 22:24:37 2020  Fri Oct  2 22:24:37 2020   Fri Nov 13 22:46:21 2020
spine03           Fresh            yes      3.2.0-cl4u30~1601403318.104fb9ed     Fri Oct  2 20:32:51 2020  Fri Oct  2 22:24:41 2020  Fri Oct  2 22:24:41 2020   Fri Nov 13 22:46:14 2020
spine04           Fresh            yes      3.2.0-cl4u30~1601403318.104fb9ed     Fri Oct  2 20:32:49 2020  Fri Oct  2 22:24:40 2020  Fri Oct  2 22:24:40 2020   Fri Nov 13 22:45:53 2020
Refer to Validate Operations for more information.
Diagnose an Event after It Occurs
NetQ provides users with the ability to go back in time to replay the network state, see fabric-wide event change logs and root cause state deviations. The NetQ Telemetry Server maintains data collected by NetQ agents in a time-series database, making fabric-wide events available for analysis. This enables you to replay and analyze networkwide events for better visibility and to correlate patterns. This allows for root-cause analysis and optimization of network configs for the future.
NetQ provides many commands and cards for diagnosing past events.
NetQ records network events and stores them in its database. You can:
- View the events through a third-party notification application (syslog, PagerDuty, Slack, or email)
- View the events using the Events|Alarms and Events|Info cards in the NetQ UI, then use the Trace Request card to track the connection between nodes
- Use
netq show eventscommand to look for any changes made to the runtime configuration that could have triggered the alert, then usenetq traceto track the connection between the nodes
The netq trace command traces the route of an IP or MAC address from one endpoint to another. It works across bridged, routed and VXLAN connections, computing the path using available data instead of sending real traffic — this way, you can run it from anywhere. It performs MTU and VLAN consistency checks for every link along the path.
Refer to Manage Events and Notifications and Verify Network Connectivity for more information.
Use NetQ as a Time Machine
With the NetQ UI or NetQ CLI, you can travel back to a specific point in time or a range of times to help you isolate errors and issues.
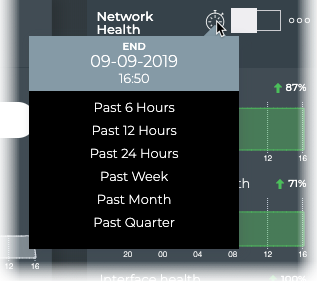
All cards have a default time period for the data shown on the card, typically the last 24 hours. You can change the time period to view the data during a different time range to aid analysis of previous or existing issues.
To change the time period for a card:
Hover over any card.
Click
 in the header.
Select a time period from the dropdown list.
If you think you had an issue with your sensors last night, you can check the sensors on all your nodes around the time you think the issue occurred:
cumulus@switch:~$ netq check sensors around 12h
sensors check result summary:

Total nodes         : 13
Checked nodes       : 13
Failed nodes        : 0
Rotten nodes        : 0
Warning nodes       : 0

Additional summary:
Checked Sensors     : 102
Failed Sensors      : 0

PSU sensors Test           : passed
Fan sensors Test           : passed
Temperature sensors Test   : passed
You can travel back in time five minutes and run a trace from spine02 to exit01, which has the IP address 27.0.0.1:
cumulus@leaf01:~$ netq trace 27.0.0.1 from spine02 around 5m pretty
Detected Routing Loop. Node exit01 (now via Local Node exit01 and Ports swp6 <==> Remote  Node/s spine01 and Ports swp3) visited twice.
Detected Routing Loop. Node spine02 (now via mac:00:02:00:00:00:15) visited twice.
spine02 -- spine02:swp3 -- exit01:swp6.4 -- exit01:swp3 -- exit01
                         -- spine02:swp7  -- spine02
Trace Paths in a VRF
Use the NetQ UI Trace Request card or the netq trace command to run a trace through a specified VRF as well:
cumulus@leaf01:~$ netq trace 10.1.20.252 from spine01 vrf default around 5m pretty
spine01 -- spine01:swp1 -- leaf01:vlan20
          -- spine01:swp2 -- leaf02:vlan20
Refer to Create a Layer 3 On-demand Trace through a Given VRF for more information.
Generate a Support File
The opta-support command generates an archive of useful information for troubleshooting issues with NetQ. It is an extension of the cl-support command in Cumulus Linux. It provides information about the NetQ Platform configuration and runtime statistics as well as output from the docker ps command. The NVIDIA support team might request the output of this command when assisting with any issues that you could not solve with your own troubleshooting. Run the following command:
cumulus@switch:~$ opta-support