Verify Network Connectivity
It is helpful to verify that communications are freely flowing between the various devices in your network. You can verify the connectivity between two devices in both an ad-hoc fashion and by defining connectivity checks to occur on a scheduled basis. NetQ provides three NetQ UI card workflows and several NetQ CLI trace commands to view connectivity:
- Trace Request card
- Run a scheduled trace on demand or create new on-demand or scheduled trace request
- View a preview of all scheduled traces
- On-demand Trace Results card
- View source and destination devices, status, paths found, and number/distribution of MTU and hops
- View job configuration
- Scheduled Trace Results card
- View source and destination devices, status, distribution of paths, bad nodes, MTU and hops
- View job configuration
netq tracecommand- Create and run a trace on demand
- View source and destination devices, status, paths found, MTU, and hops in terminal window
netq add tracecommand- Create an on-demand or scheduled trace
- View results on On-demand and Scheduled Trace Results cards
Specifying Source and Destination Values
When specifying traces, the following options are available for the source and destination values.
| Trace Type | Source | Destination |
|---|---|---|
| Layer 2 | Hostname | MAC address plus VLAN |
| Layer 2 | IPv4/IPv6 address plus VRF (if not default) | MAC address plus VLAN |
| Layer 2 | MAC Address | MAC address plus VLAN |
| Layer 3 | Hostname | IPv4/IPv6 address |
| Layer 3 | IPv4/IPv6 address plus VRF (if not default) | IPv4/IPv6 address |
If you use an IPv6 address, you must enter the complete, non-truncated address.
Additional NetQ CLI Considerations
When creating and running traces using the NetQ CLI, consider the following items.
Time Values
When entering a time value, you must include a numeric value and the unit of measure:
- w: weeks
- d: days
- h: hours
- m: minutes
- s: seconds
- now
Result Display Options
Three output formats are available for the on-demand trace with results in a terminal window.
- JSON: Lists results in a JSON file, good for exporting to other applications or software.
- Pretty: Lines up results by paths in a pseudo-graphical manner to help visualize the multiple paths.
- Detail: Displays results in a tabular format with a row per hop and a set of rows per path, useful for traces with higher hop counts where the pretty output wraps lines, making it harder to interpret the results. This is the default output when not specified.
You can improve the readability of the output using color as well. Run netq config add color to turn color on. Run netq config del color to turn color off.
Known Addresses
The tracing function only knows about already learned addresses. If you find that a path is invalid or incomplete, you might need to ping the identified device so that its address becomes known.
Create On-demand Traces
You can view the current connectivity between two devices in your network by creating an on-demand trace. You can perform these traces at layer 2 or layer 3 using the NetQ UI or the NetQ CLI.
Create a Layer 3 On-demand Trace Request
It is helpful to verify the connectivity between two devices when you suspect an issue is preventing proper communication between them. If you cannot find a layer 3 path, you might also try checking connectivity through a layer 2 path.
Determine the IP addresses of the two devices you want to trace.
Click
 (main menu), then IP Addresses under the Network section.
Click
 and enter a hostname.
Make note of the relevant address.
Filter the list again for the other hostname, and make note of its address.
Open the Trace Request card.
- On new workbench: Click in the Global Search field. Type trace. Click the card name.
- On current workbench: Click
 . Click Trace. Click the card. Click Open Cards.
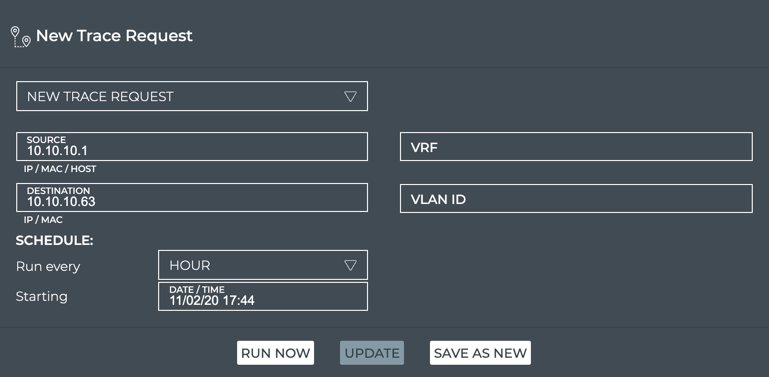
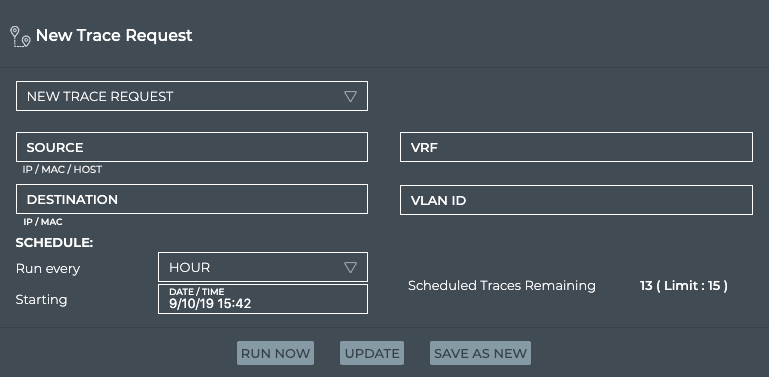
In the Source field, enter the hostname or IP address of the device where you want to start the trace.
In the Destination field, enter the IP address of the device where you want to end the trace.
If you mistype an address, you must double-click it, or backspace over the error, and retype the address. You cannot select the address by dragging over it as this action attempts to move the card to another location.
- Click Run Now. A corresponding Trace Results card is opened on your workbench. Refer to View Layer 3 On-demand Trace Results for details.
Use the netq trace command to view the results in the terminal window. Use the netq add trace command to view the results in the NetQ UI.
To create a layer 3 on-demand trace and see the results in the terminal window, run:
netq trace <ip> from (<src-hostname>|<ip-src>) [json|detail|pretty]
Note the syntax requires the destination device address first and then the source device address or hostname.
This example shows a trace from 10.10.10.1 (source, leaf01) to 10.10.10.63 (destination, border01) on the underlay in pretty output. You could have used leaf01 as the source instead of its IP address. The example first identifies the addresses for the source and destination devices using netq show ip addresses then runs the trace.
cumulus@switch:~$ netq border01 show ip addresses

Matching address records:
Address                   Hostname          Interface                 VRF             Last Changed
------------------------- ----------------- ------------------------- --------------- -------------------------
192.168.200.63/24         border01          eth0                                      Tue Nov  3 15:45:31 2020
10.0.1.254/32             border01          lo                        default         Mon Nov  2 22:28:54 2020
10.10.10.63/32            border01          lo                        default         Mon Nov  2 22:28:54 2020

cumulus@switch:~$ netq trace 10.10.10.63 from  10.10.10.1 pretty
Number of Paths: 12
Number of Paths with Errors: 0
Number of Paths with Warnings: 0
Path MTU: 9216

 leaf01 swp54 -- swp1 spine04 swp6 -- swp54 border02 peerlink.4094 -- peerlink.4094 border01 lo
                                                     peerlink.4094 -- peerlink.4094 border01 lo
 leaf01 swp53 -- swp1 spine03 swp6 -- swp53 border02 peerlink.4094 -- peerlink.4094 border01 lo
                                                     peerlink.4094 -- peerlink.4094 border01 lo
 leaf01 swp52 -- swp1 spine02 swp6 -- swp52 border02 peerlink.4094 -- peerlink.4094 border01 lo
                                                     peerlink.4094 -- peerlink.4094 border01 lo
 leaf01 swp51 -- swp1 spine01 swp6 -- swp51 border02 peerlink.4094 -- peerlink.4094 border01 lo
                                                     peerlink.4094 -- peerlink.4094 border01 lo
 leaf01 swp54 -- swp1 spine04 swp5 -- swp54 border01 lo
 leaf01 swp53 -- swp1 spine03 swp5 -- swp53 border01 lo
 leaf01 swp52 -- swp1 spine02 swp5 -- swp52 border01 lo
 leaf01 swp51 -- swp1 spine01 swp5 -- swp51 border01 lo
Each row of the pretty output shows one of the 12 available paths, with each path described by hops using the following format:
source hostname and source egress port – ingress port of first hop and device hostname and egress port – n*(ingress port of next hop and device hostname and egress port) – ingress port of destination device hostname
In this example, eight of 12 paths use four hops to get to the destination and four use three hops. The overall MTU for all paths is 9216. No errors or warnings are present on any of the paths.
Alternately, you can choose to view the same results in detail (default output) or JSON format. This example shows the default detail output.
cumulus@switch:~$ netq trace 10.10.10.63 from  10.10.10.1
Number of Paths: 12
Number of Paths with Errors: 0
Number of Paths with Warnings: 0
Path MTU: 9216

Id  Hop Hostname    InPort          InTun, RtrIf    OutRtrIf, Tun   OutPort
--- --- ----------- --------------- --------------- --------------- ---------------
1   1   leaf01                                      swp54           swp54
    2   spine04     swp1            swp1            swp6            swp6
    3   border02    swp54           swp54           peerlink.4094   peerlink.4094
    4   border01    peerlink.4094                                   lo
--- --- ----------- --------------- --------------- --------------- ---------------
2   1   leaf01                                      swp54           swp54
    2   spine04     swp1            swp1            swp6            swp6
    3   border02    swp54           swp54           peerlink.4094   peerlink.4094
    4   border01    peerlink.4094                                   lo
--- --- ----------- --------------- --------------- --------------- ---------------
3   1   leaf01                                      swp53           swp53
    2   spine03     swp1            swp1            swp6            swp6
    3   border02    swp53           swp53           peerlink.4094   peerlink.4094
    4   border01    peerlink.4094                                   lo
--- --- ----------- --------------- --------------- --------------- ---------------
4   1   leaf01                                      swp53           swp53
    2   spine03     swp1            swp1            swp6            swp6
    3   border02    swp53           swp53           peerlink.4094   peerlink.4094
    4   border01    peerlink.4094                                   lo
--- --- ----------- --------------- --------------- --------------- ---------------
5   1   leaf01                                      swp52           swp52
    2   spine02     swp1            swp1            swp6            swp6
    3   border02    swp52           swp52           peerlink.4094   peerlink.4094
    4   border01    peerlink.4094                                   lo
--- --- ----------- --------------- --------------- --------------- ---------------
6   1   leaf01                                      swp52           swp52
    2   spine02     swp1            swp1            swp6            swp6
    3   border02    swp52           swp52           peerlink.4094   peerlink.4094
    4   border01    peerlink.4094                                   lo
--- --- ----------- --------------- --------------- --------------- ---------------
7   1   leaf01                                      swp51           swp51
    2   spine01     swp1            swp1            swp6            swp6
    3   border02    swp51           swp51           peerlink.4094   peerlink.4094
    4   border01    peerlink.4094                                   lo
--- --- ----------- --------------- --------------- --------------- ---------------
8   1   leaf01                                      swp51           swp51
    2   spine01     swp1            swp1            swp6            swp6
    3   border02    swp51           swp51           peerlink.4094   peerlink.4094
    4   border01    peerlink.4094                                   lo
--- --- ----------- --------------- --------------- --------------- ---------------
9   1   leaf01                                      swp54           swp54
    2   spine04     swp1            swp1            swp5            swp5
    3   border01    swp54                                           lo
--- --- ----------- --------------- --------------- --------------- ---------------
10  1   leaf01                                      swp53           swp53
    2   spine03     swp1            swp1            swp5            swp5
    3   border01    swp53                                           lo
--- --- ----------- --------------- --------------- --------------- ---------------
11  1   leaf01                                      swp52           swp52
    2   spine02     swp1            swp1            swp5            swp5
    3   border01    swp52                                           lo
--- --- ----------- --------------- --------------- --------------- ---------------
12  1   leaf01                                      swp51           swp51
    2   spine01     swp1            swp1            swp5            swp5
    3   border01    swp51                                           lo
--- --- ----------- --------------- --------------- --------------- ---------------
To create a layer 3 on-demand trace and see the results in the On-demand Trace Results card, run:
netq add trace <ip> from (<src-hostname> | <ip-src>) [alert-on-failure]
This example shows a trace from 10.10.10.1 (source, leaf01) to 10.10.10.63 (destination, border01).
cumulus@switch:~$ netq add trace 10.10.10.63 from 10.10.10.1
Running job None src 10.10.10.1 dst 10.10.10.63
The trace provides confirmation of the on-demand job. Refer to View Layer 3 On-demand Trace Results for details.
Create a Layer 3 On-demand Trace Through a Given VRF
You can guide a layer 3 trace through a particular VRF interface using the NetQ UI or the NetQ CLI.
To create the trace request:
Determine the IP addresses of the two devices you want to trace.
Click
(main menu), then IP Addresses under the Network section.Click
and enter a hostname.Make note of the relevant address and VRF.
Filter the list again for the other hostname, and make note of its address.
Open the Trace Request card.
- On new workbench: Click the Global Search entry field. Type trace. Click the card name.
- On current workbench: Click . Click Trace. Click the card. Click Open Cards.
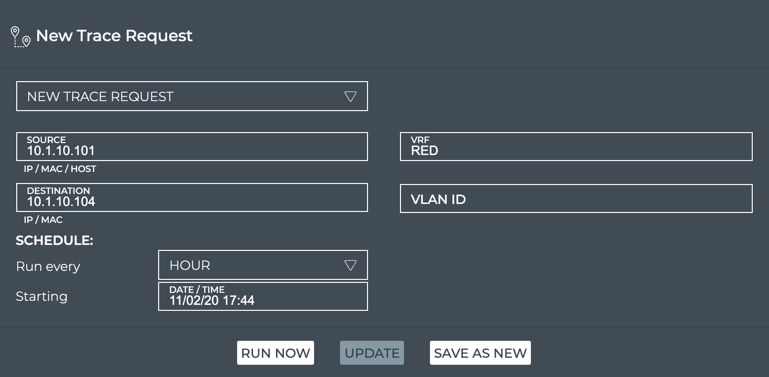
In the Source field, enter the hostname or IP address of the device where you want to start the trace.
In the Destination field, enter the IP address of the device where you want to end the trace.
In the VRF field, enter the identifier for the VRF associated with these devices.
- Click Run Now. A corresponding Trace Results card is opened on your workbench. Refer to View Layer 3 On-demandTrace Results for details.
Use the netq trace command to view the results in the terminal window. Use the netq add trace command to view the results in the NetQ UI.
To create a layer 3 on-demand trace through a given VRF and see the results in the terminal window, run:
netq trace <ip> from (<src-hostname>|<ip-src>) vrf <vrf> [json|detail|pretty]
Note the syntax requires the destination device address first and then the source device address or hostname.
This example shows a trace from 10.1.10.101 (source, server01) to 10.1.10.104 (destination, server04) through VRF RED in detail output. It first identifies the addresses for the source and destination devices and a VRF between them using netq show ip addresses then runs the trace. Note that the VRF name is case sensitive. The trace job might take some time to compile all the available paths, especially if there are many of them.
cumulus@switch:~$ netq server01 show ip addresses
Matching address records:
Address                   Hostname          Interface                 VRF             Last Changed
------------------------- ----------------- ------------------------- --------------- -------------------------
192.168.200.31/24         server01          eth0                      default         Tue Nov  3 19:50:21 2020
10.1.10.101/24            server01          uplink                    default         Tue Nov  3 19:50:21 2020

cumulus@switch:~$ netq server04 show ip addresses
Matching address records:
Address                   Hostname          Interface                 VRF             Last Changed
------------------------- ----------------- ------------------------- --------------- -------------------------
10.1.10.104/24            server04          uplink                    default         Tue Nov  3 19:50:23 2020
192.168.200.34/24         server04          eth0                      default         Tue Nov  3 19:50:23 2020

cumulus@switch:~$ netq trace 10.1.10.104 from 10.1.10.101 vrf RED
Number of Paths: 16
Number of Paths with Errors: 0
Number of Paths with Warnings: 0
Path MTU: 9000

Id  Hop Hostname    InPort          InTun, RtrIf    OutRtrIf, Tun   OutPort
--- --- ----------- --------------- --------------- --------------- ---------------
1   1   server01                                                    mac:44:38:39:00
                                                                    :00:38
    2   leaf02      swp1                            vni: 10         swp54
    3   spine04     swp2            swp2            swp4            swp4
    4   leaf04      swp54           vni: 10                         bond1
    5   server04    uplink
--- --- ----------- --------------- --------------- --------------- ---------------
2   1   server01                                                    mac:44:38:39:00
                                                                    :00:38
    2   leaf02      swp1                            vni: 10         swp54
    3   spine04     swp2            swp2            swp3            swp3
    4   leaf03      swp54           vni: 10                         bond1
    5   server04    uplink
--- --- ----------- --------------- --------------- --------------- ---------------
3   1   server01                                                    mac:44:38:39:00
                                                                    :00:38
    2   leaf02      swp1                            vni: 10         swp53
    3   spine03     swp2            swp2            swp4            swp4
    4   leaf04      swp53           vni: 10                         bond1
    5   server04    uplink
--- --- ----------- --------------- --------------- --------------- ---------------
4   1   server01                                                    mac:44:38:39:00
                                                                    :00:38
    2   leaf02      swp1                            vni: 10         swp53
    3   spine03     swp2            swp2            swp3            swp3
    4   leaf03      swp53           vni: 10                         bond1
    5   server04    uplink
--- --- ----------- --------------- --------------- --------------- ---------------
5   1   server01                                                    mac:44:38:39:00
                                                                    :00:38
    2   leaf02      swp1                            vni: 10         swp52
    3   spine02     swp2            swp2            swp4            swp4
    4   leaf04      swp52           vni: 10                         bond1
    5   server04    uplink
--- --- ----------- --------------- --------------- --------------- ---------------
6   1   server01                                                    mac:44:38:39:00
                                                                    :00:38
    2   leaf02      swp1                            vni: 10         swp52
    3   spine02     swp2            swp2            swp3            swp3
    4   leaf03      swp52           vni: 10                         bond1
    5   server04    uplink
--- --- ----------- --------------- --------------- --------------- ---------------
7   1   server01                                                    mac:44:38:39:00
                                                                    :00:38
    2   leaf02      swp1                            vni: 10         swp51
    3   spine01     swp2            swp2            swp4            swp4
    4   leaf04      swp51           vni: 10                         bond1
    5   server04    uplink
--- --- ----------- --------------- --------------- --------------- ---------------
8   1   server01                                                    mac:44:38:39:00
                                                                    :00:38
    2   leaf02      swp1                            vni: 10         swp51
    3   spine01     swp2            swp2            swp3            swp3
    4   leaf03      swp51           vni: 10                         bond1
    5   server04    uplink
--- --- ----------- --------------- --------------- --------------- ---------------
9   1   server01                                                    mac:44:38:39:00
                                                                    :00:32
    2   leaf01      swp1                            vni: 10         swp54
    3   spine04     swp1            swp1            swp4            swp4
    4   leaf04      swp54           vni: 10                         bond1
    5   server04    uplink
--- --- ----------- --------------- --------------- --------------- ---------------
10  1   server01                                                    mac:44:38:39:00
                                                                    :00:32
    2   leaf01      swp1                            vni: 10         swp54
    3   spine04     swp1            swp1            swp3            swp3
    4   leaf03      swp54           vni: 10                         bond1
    5   server04    uplink
--- --- ----------- --------------- --------------- --------------- ---------------
11  1   server01                                                    mac:44:38:39:00
                                                                    :00:32
    2   leaf01      swp1                            vni: 10         swp53
    3   spine03     swp1            swp1            swp4            swp4
    4   leaf04      swp53           vni: 10                         bond1
    5   server04    uplink
--- --- ----------- --------------- --------------- --------------- ---------------
12  1   server01                                                    mac:44:38:39:00
                                                                    :00:32
    2   leaf01      swp1                            vni: 10         swp53
    3   spine03     swp1            swp1            swp3            swp3
    4   leaf03      swp53           vni: 10                         bond1
    5   server04    uplink
--- --- ----------- --------------- --------------- --------------- ---------------
13  1   server01                                                    mac:44:38:39:00
                                                                    :00:32
    2   leaf01      swp1                            vni: 10         swp52
    3   spine02     swp1            swp1            swp4            swp4
    4   leaf04      swp52           vni: 10                         bond1
    5   server04    uplink
--- --- ----------- --------------- --------------- --------------- ---------------
14  1   server01                                                    mac:44:38:39:00
                                                                    :00:32
    2   leaf01      swp1                            vni: 10         swp52
    3   spine02     swp1            swp1            swp3            swp3
    4   leaf03      swp52           vni: 10                         bond1
    5   server04    uplink
--- --- ----------- --------------- --------------- --------------- ---------------
15  1   server01                                                    mac:44:38:39:00
                                                                    :00:32
    2   leaf01      swp1                            vni: 10         swp51
    3   spine01     swp1            swp1            swp4            swp4
    4   leaf04      swp51           vni: 10                         bond1
    5   server04    uplink
--- --- ----------- --------------- --------------- --------------- ---------------
16  1   server01                                                    mac:44:38:39:00
                                                                    :00:32
    2   leaf01      swp1                            vni: 10         swp51
    3   spine01     swp1            swp1            swp3            swp3
    4   leaf03      swp51           vni: 10                         bond1
    5   server04    uplink
--- --- ----------- --------------- --------------- --------------- ---------------
Or to view the result in pretty format:
cumulus@switch:~$ netq trace 10.1.10.104 from 10.1.10.101 vrf RED pretty
Number of Paths: 16
Number of Paths with Errors: 0
Number of Paths with Warnings: 0
Path MTU: 9000

 server01 mac:44:38:39:00:00:38 -- swp1 leaf02 vni: 10 swp54 -- swp2 spine04 swp4 -- swp54 vni: 10 leaf04 bond1 -- uplink server04
                                                       swp54 -- swp2 spine04 swp3 -- swp54 vni: 10 leaf03 bond1 -- uplink server04
          mac:44:38:39:00:00:38 -- swp1 leaf02 vni: 10 swp53 -- swp2 spine03 swp4 -- swp53 vni: 10 leaf04 bond1 -- uplink server04
                                                       swp53 -- swp2 spine03 swp3 -- swp53 vni: 10 leaf03 bond1 -- uplink server04
          mac:44:38:39:00:00:38 -- swp1 leaf02 vni: 10 swp52 -- swp2 spine02 swp4 -- swp52 vni: 10 leaf04 bond1 -- uplink server04
                                                       swp52 -- swp2 spine02 swp3 -- swp52 vni: 10 leaf03 bond1 -- uplink server04
          mac:44:38:39:00:00:38 -- swp1 leaf02 vni: 10 swp51 -- swp2 spine01 swp4 -- swp51 vni: 10 leaf04 bond1 -- uplink server04
                                                       swp51 -- swp2 spine01 swp3 -- swp51 vni: 10 leaf03 bond1 -- uplink server04
 server01 mac:44:38:39:00:00:32 -- swp1 leaf01 vni: 10 swp54 -- swp1 spine04 swp4 -- swp54 vni: 10 leaf04 bond1 -- uplink server04
                                                       swp54 -- swp1 spine04 swp3 -- swp54 vni: 10 leaf03 bond1 -- uplink server04
          mac:44:38:39:00:00:32 -- swp1 leaf01 vni: 10 swp53 -- swp1 spine03 swp4 -- swp53 vni: 10 leaf04 bond1 -- uplink server04
                                                       swp53 -- swp1 spine03 swp3 -- swp53 vni: 10 leaf03 bond1 -- uplink server04
          mac:44:38:39:00:00:32 -- swp1 leaf01 vni: 10 swp52 -- swp1 spine02 swp4 -- swp52 vni: 10 leaf04 bond1 -- uplink server04
                                                       swp52 -- swp1 spine02 swp3 -- swp52 vni: 10 leaf03 bond1 -- uplink server04
          mac:44:38:39:00:00:32 -- swp1 leaf01 vni: 10 swp51 -- swp1 spine01 swp4 -- swp51 vni: 10 leaf04 bond1 -- uplink server04
                                                       swp51 -- swp1 spine01 swp3 -- swp51 vni: 10 leaf03 bond1 -- uplink server04
To create a layer 3 on-demand trace and see the results in the On-demand Trace Results card, run:
netq add trace <ip> from (<src-hostname> | <ip-src>) vrf <vrf>
This example shows a trace from 10.1.10.101 (source, server01) to 10.1.10.104 (destination, server04) through VRF RED.
cumulus@switch:~$ netq add trace 10.1.10.104 from 10.1.10.101 vrf RED
The trace provides confirmation of the on-demand job. Refer to View Layer 3 On-demand Trace Results for details.
Create a Layer 2 On-demand Trace
It is helpful to verify the connectivity between two devices when you suspect an issue is preventing proper communication between them. If you cannot find a path through a layer 2 path, you might also try checking connectivity through a layer 3 path.
To create a layer 2 trace request:
Determine the IP or MAC address of the source device and the MAC address of the destination device.
Click
(main menu), then IP Neighbors under the Network section.Click
and enter destination hostname.Make note of the MAC address and VLAN ID.
Filter the list again for the source hostname, and make note of its IP address.
Open the Trace Request card.
- On new workbench: Click in the Global Search field. Type trace. Click the card name.
- On current workbench: Click . Click Trace. Click the card. Click Open Cards.
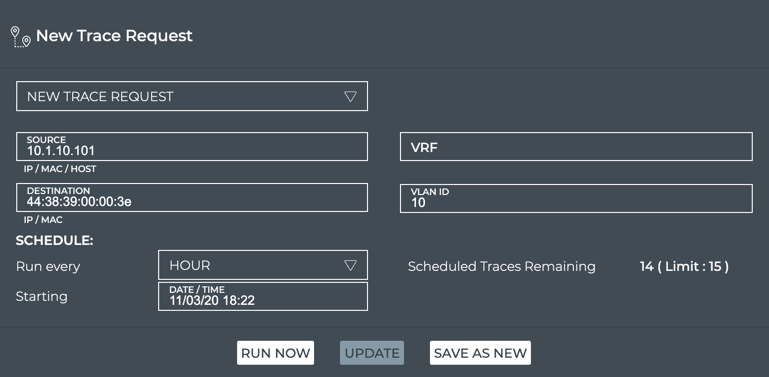
In the Source field, enter the hostname or IP address of the device where you want to start the trace.
In the Destination field, enter the MAC address for where you want to end the trace.
In the VLAN ID field, enter the identifier for the VLAN associated with the destination.
- Click Run Now. A corresponding Trace Results card is opened on your workbench. Refer to View Layer 2 On-demand Trace Results for details.
Use the netq trace command to view on-demand trace results in the terminal window.
To create a layer 2 on-demand trace and see the results in the terminal window, run:
netq trace (<mac> vlan <1-4096>) from <mac-src> [json|detail|pretty]
Note the syntax requires the destination device address first and then the source device address or hostname.
This example shows a trace from 44:38:39:00:00:32 (source, server01) to 44:38:39:00:00:3e (destination, server04) through VLAN 10 in detail output. It first identifies the MAC addresses for the two devices using netq show ip neighbors. Then it determines the VLAN using netq show macs. Then it runs the trace.
cumulus@switch:~$ netq show ip neighbors
Matching neighbor records:
IP Address Hostname Interface MAC Address VRF Remote Last Changed
------------------------- ----------------- ------------------------- ------------------ --------------- ------ -------------------------
...
192.168.200.1 server04 eth0 44:38:39:00:00:6d default no Tue Nov 3 19:50:23 2020
10.1.10.1 server04 uplink 00:00:00:00:00:1a default no Tue Nov 3 19:50:23 2020
10.1.10.101 server04 uplink 44:38:39:00:00:32 default no Tue Nov 3 19:50:23 2020
10.1.10.2 server04 uplink 44:38:39:00:00:5d default no Tue Nov 3 19:50:23 2020
10.1.10.3 server04 uplink 44:38:39:00:00:5e default no Tue Nov 3 19:50:23 2020
192.168.200.250 server04 eth0 44:38:39:00:01:80 default no Tue Nov 3 19:50:23 2020
192.168.200.1 server03 eth0 44:38:39:00:00:6d default no Tue Nov 3 19:50:22 2020
192.168.200.250 server03 eth0 44:38:39:00:01:80 default no Tue Nov 3 19:50:22 2020
192.168.200.1 server02 eth0 44:38:39:00:00:6d default no Tue Nov 3 19:50:22 2020
10.1.20.1 server02 uplink 00:00:00:00:00:1b default no Tue Nov 3 19:50:22 2020
10.1.20.2 server02 uplink 44:38:39:00:00:59 default no Tue Nov 3 19:50:22 2020
10.1.20.3 server02 uplink 44:38:39:00:00:37 default no Tue Nov 3 19:50:22 2020
10.1.20.105 server02 uplink 44:38:39:00:00:40 default no Tue Nov 3 19:50:22 2020
192.168.200.250 server02 eth0 44:38:39:00:01:80 default no Tue Nov 3 19:50:22 2020
192.168.200.1 server01 eth0 44:38:39:00:00:6d default no Tue Nov 3 19:50:21 2020
10.1.10.1 server01 uplink 00:00:00:00:00:1a default no Tue Nov 3 19:50:21 2020
10.1.10.2 server01 uplink 44:38:39:00:00:59 default no Tue Nov 3 19:50:21 2020
10.1.10.3 server01 uplink 44:38:39:00:00:37 default no Tue Nov 3 19:50:21 2020
10.1.10.104 server01 uplink 44:38:39:00:00:3e default no Tue Nov 3 19:50:21 2020
192.168.200.250 server01 eth0 44:38:39:00:01:80 default no Tue Nov 3 19:50:21 2020
...
cumulus@switch:~$ netq show macs
Matching mac records:
Origin MAC Address VLAN Hostname Egress Port Remote Last Changed
------ ------------------ ------ ----------------- ------------------------------ ------ -------------------------
yes 44:38:39:00:00:5e 4002 leaf04 bridge no Fri Oct 30 22:29:16 2020
no 46:38:39:00:00:46 20 leaf04 bond2 no Fri Oct 30 22:29:16 2020
no 44:38:39:00:00:5d 30 leaf04 peerlink no Fri Oct 30 22:29:16 2020
yes 00:00:00:00:00:1a 10 leaf04 bridge no Fri Oct 30 22:29:16 2020
yes 44:38:39:00:00:5e 20 leaf04 bridge no Fri Oct 30 22:29:16 2020
yes 7e:1a:b3:4f:05:b8 20 leaf04 vni20 no Fri Oct 30 22:29:16 2020
...
no 46:38:39:00:00:3e 10 leaf01 vni10 yes Fri Oct 30 22:28:50 2020
...
yes 44:38:39:00:00:4d 4001 border01 bridge no Fri Oct 30 22:28:53 2020
yes 7a:4a:c7:bb:48:27 4001 border01 vniRED no Fri Oct 30 22:28:53 2020
yes ce:93:1d:e3:08:1b 4002 border01 vniBLUE no Fri Oct 30 22:28:53 2020
cumulus@switch:~$ netq trace 44:38:39:00:00:3e vlan 10 from 44:38:39:00:00:32
Number of Paths: 16
Number of Paths with Errors: 0
Number of Paths with Warnings: 0
Path MTU: 9000
Id Hop Hostname InPort InTun, RtrIf OutRtrIf, Tun OutPort
--- --- ----------- --------------- --------------- --------------- ---------------
1 1 server01 mac:44:38:39:00
:00:38
2 leaf02 swp1 vni: 10 swp54
3 spine04 swp2 swp2 swp4 swp4
4 leaf04 swp54 vni: 10 bond1
5 server04 uplink
--- --- ----------- --------------- --------------- --------------- ---------------
2 1 server01 mac:44:38:39:00
:00:38
2 leaf02 swp1 vni: 10 swp54
3 spine04 swp2 swp2 swp3 swp3
4 leaf03 swp54 vni: 10 bond1
5 server04 uplink
--- --- ----------- --------------- --------------- --------------- ---------------
3 1 server01 mac:44:38:39:00
:00:38
2 leaf02 swp1 vni: 10 swp53
3 spine03 swp2 swp2 swp4 swp4
4 leaf04 swp53 vni: 10 bond1
5 server04 uplink
--- --- ----------- --------------- --------------- --------------- ---------------
4 1 server01 mac:44:38:39:00
:00:38
2 leaf02 swp1 vni: 10 swp53
3 spine03 swp2 swp2 swp3 swp3
4 leaf03 swp53 vni: 10 bond1
5 server04 uplink
--- --- ----------- --------------- --------------- --------------- ---------------
5 1 server01 mac:44:38:39:00
:00:38
2 leaf02 swp1 vni: 10 swp52
3 spine02 swp2 swp2 swp4 swp4
4 leaf04 swp52 vni: 10 bond1
5 server04 uplink
--- --- ----------- --------------- --------------- --------------- ---------------
6 1 server01 mac:44:38:39:00
:00:38
2 leaf02 swp1 vni: 10 swp52
3 spine02 swp2 swp2 swp3 swp3
4 leaf03 swp52 vni: 10 bond1
5 server04 uplink
--- --- ----------- --------------- --------------- --------------- ---------------
7 1 server01 mac:44:38:39:00
:00:38
2 leaf02 swp1 vni: 10 swp51
3 spine01 swp2 swp2 swp4 swp4
4 leaf04 swp51 vni: 10 bond1
5 server04 uplink
--- --- ----------- --------------- --------------- --------------- ---------------
8 1 server01 mac:44:38:39:00
:00:38
2 leaf02 swp1 vni: 10 swp51
3 spine01 swp2 swp2 swp3 swp3
4 leaf03 swp51 vni: 10 bond1
5 server04 uplink
--- --- ----------- --------------- --------------- --------------- ---------------
9 1 server01 mac:44:38:39:00
:00:32
2 leaf01 swp1 vni: 10 swp54
3 spine04 swp1 swp1 swp4 swp4
4 leaf04 swp54 vni: 10 bond1
5 server04 uplink
--- --- ----------- --------------- --------------- --------------- ---------------
10 1 server01 mac:44:38:39:00
:00:32
2 leaf01 swp1 vni: 10 swp54
3 spine04 swp1 swp1 swp3 swp3
4 leaf03 swp54 vni: 10 bond1
5 server04 uplink
--- --- ----------- --------------- --------------- --------------- ---------------
11 1 server01 mac:44:38:39:00
:00:32
2 leaf01 swp1 vni: 10 swp53
3 spine03 swp1 swp1 swp4 swp4
4 leaf04 swp53 vni: 10 bond1
5 server04 uplink
--- --- ----------- --------------- --------------- --------------- ---------------
12 1 server01 mac:44:38:39:00
:00:32
2 leaf01 swp1 vni: 10 swp53
3 spine03 swp1 swp1 swp3 swp3
4 leaf03 swp53 vni: 10 bond1
5 server04 uplink
--- --- ----------- --------------- --------------- --------------- ---------------
13 1 server01 mac:44:38:39:00
:00:32
2 leaf01 swp1 vni: 10 swp52
3 spine02 swp1 swp1 swp4 swp4
4 leaf04 swp52 vni: 10 bond1
5 server04 uplink
--- --- ----------- --------------- --------------- --------------- ---------------
14 1 server01 mac:44:38:39:00
:00:32
2 leaf01 swp1 vni: 10 swp52
3 spine02 swp1 swp1 swp3 swp3
4 leaf03 swp52 vni: 10 bond1
5 server04 uplink
--- --- ----------- --------------- --------------- --------------- ---------------
15 1 server01 mac:44:38:39:00
:00:32
2 leaf01 swp1 vni: 10 swp51
3 spine01 swp1 swp1 swp4 swp4
4 leaf04 swp51 vni: 10 bond1
5 server04 uplink
--- --- ----------- --------------- --------------- --------------- ---------------
16 1 server01 mac:44:38:39:00
:00:32
2 leaf01 swp1 vni: 10 swp51
3 spine01 swp1 swp1 swp3 swp3
4 leaf03 swp51 vni: 10 bond1
5 server04 uplink
--- --- ----------- --------------- --------------- --------------- ---------------
To view in pretty output:
cumulus@netq-ts:~$ netq trace 44:38:39:00:00:3e vlan 10 from 44:38:39:00:00:32 pretty
Number of Paths: 16
Number of Paths with Errors: 0
Number of Paths with Warnings: 0
Path MTU: 9000

 server01 mac:44:38:39:00:00:38 -- swp1 leaf02 vni: 10 swp54 -- swp2 spine04 swp4 -- swp54 vni: 10 leaf04 bond1 -- uplink server04
                                                       swp54 -- swp2 spine04 swp3 -- swp54 vni: 10 leaf03 bond1 -- uplink server04
          mac:44:38:39:00:00:38 -- swp1 leaf02 vni: 10 swp53 -- swp2 spine03 swp4 -- swp53 vni: 10 leaf04 bond1 -- uplink server04
                                                       swp53 -- swp2 spine03 swp3 -- swp53 vni: 10 leaf03 bond1 -- uplink server04
          mac:44:38:39:00:00:38 -- swp1 leaf02 vni: 10 swp52 -- swp2 spine02 swp4 -- swp52 vni: 10 leaf04 bond1 -- uplink server04
                                                       swp52 -- swp2 spine02 swp3 -- swp52 vni: 10 leaf03 bond1 -- uplink server04
          mac:44:38:39:00:00:38 -- swp1 leaf02 vni: 10 swp51 -- swp2 spine01 swp4 -- swp51 vni: 10 leaf04 bond1 -- uplink server04
                                                       swp51 -- swp2 spine01 swp3 -- swp51 vni: 10 leaf03 bond1 -- uplink server04
 server01 mac:44:38:39:00:00:32 -- swp1 leaf01 vni: 10 swp54 -- swp1 spine04 swp4 -- swp54 vni: 10 leaf04 bond1 -- uplink server04
                                                       swp54 -- swp1 spine04 swp3 -- swp54 vni: 10 leaf03 bond1 -- uplink server04
          mac:44:38:39:00:00:32 -- swp1 leaf01 vni: 10 swp53 -- swp1 spine03 swp4 -- swp53 vni: 10 leaf04 bond1 -- uplink server04
                                                       swp53 -- swp1 spine03 swp3 -- swp53 vni: 10 leaf03 bond1 -- uplink server04
          mac:44:38:39:00:00:32 -- swp1 leaf01 vni: 10 swp52 -- swp1 spine02 swp4 -- swp52 vni: 10 leaf04 bond1 -- uplink server04
                                                       swp52 -- swp1 spine02 swp3 -- swp52 vni: 10 leaf03 bond1 -- uplink server04
          mac:44:38:39:00:00:32 -- swp1 leaf01 vni: 10 swp51 -- swp1 spine01 swp4 -- swp51 vni: 10 leaf04 bond1 -- uplink server04
                                                       swp51 -- swp1 spine01 swp3 -- swp51 vni: 10 leaf03 bond1 -- uplink server04
Use the netq add trace command to view on-demand trace results in the NetQ UI.
To create a layer 2 on-demand trace and see the results in the On-demand Trace Results card, run:
netq add trace <mac> vlan <1-4096> from <mac-src>
This example shows a trace from 44:38:39:00:00:32 (source, server01) to 44:38:39:00:00:3e (destination, server04) through VLAN 10.
cumulus@switch:~$ netq add trace 44:38:39:00:00:3e vlan 10 from 44:38:39:00:00:32
The trace provides confirmation of the on-demand job. Refer to View Layer 2 On-demand Trace Results for details.
View On-demand Trace Results
After you have started an on-demand trace, the results appear either in the NetQ UI On-demand Trace Result card or by running the netq show trace results command.
View Layer 3 On-demand Trace Results
View the results for a layer 3 trace based on how you created the request.
After you click Run Now, the corresponding results card opens on your workbench. While it is working on the trace, a notice appears on the card indicating it is running.

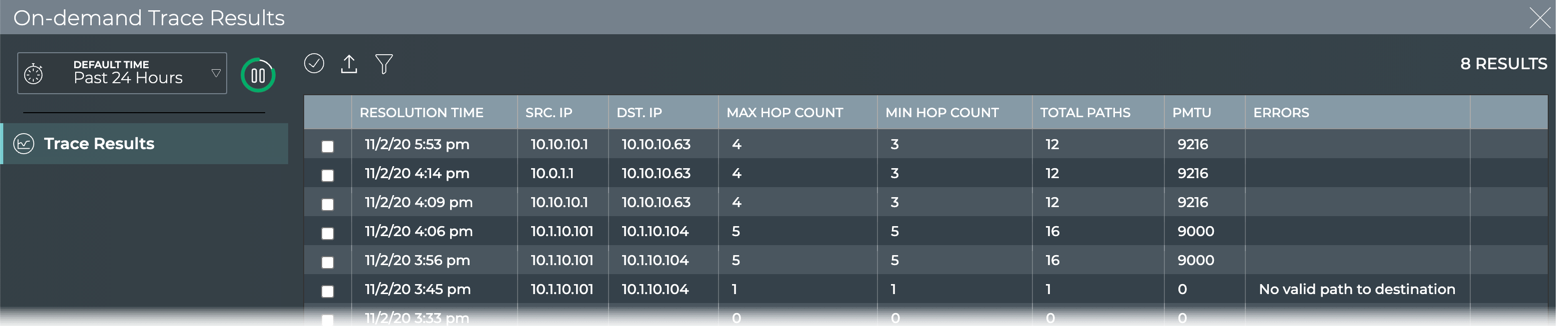
Once results are obtained, it displays them. Using our example from earlier, the following results are shown:
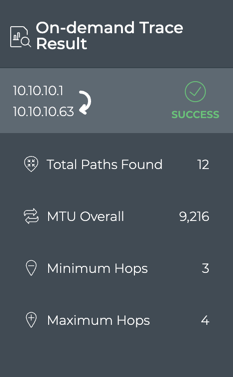
In this example, we see that the trace was successful. 12 paths were found between the devices, some with three hops and some four hops and with an overall MTU of 9216. Because there is a difference between the minimum and maximum number of hops (as seen in this example) or if the trace failed, you could view the large results card for additional information.
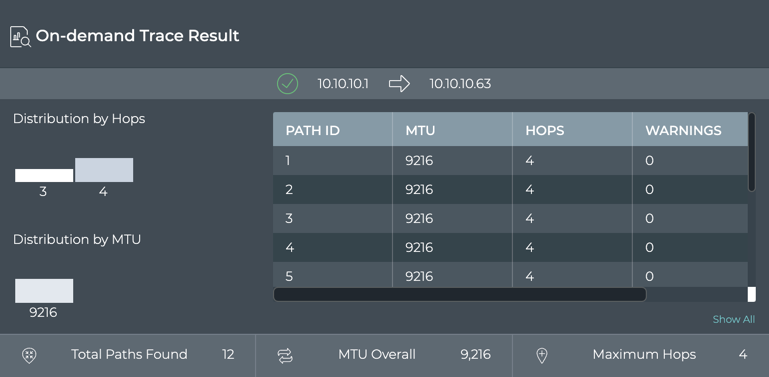
In our example, we can see that paths 9-12 had three hops by scrolling through the path listing in the table. To view the hop details, refer to the next section. If there were errors or warnings, that caused the trace failure, a count would be visible in this table. To view more details for this and other traces, refer to Detailed On-demand Trace Results.
netq trace command are displayed in the terminal window where you ran the command. Refer to Create On-demand Traces.After you have run the netq add trace command, you are able to view the results in the NetQ UI.
Open the NetQ UI and log in.
Open the workbench where the associated On-demand Trace Result card has been placed.
To view more details for this and other traces, refer to Detailed On-demand Trace Results.
View Layer 2 On-demand Trace Results
View the results for a layer 2 trace based on how you created the request.
After clicking Run Now on the Trace Request card, the corresponding On-demand Trace Result card is opened on your workbench. While it is working on the trace, a notice is shown on the card indicating it is running.

Once the job is completed, the results are displayed.
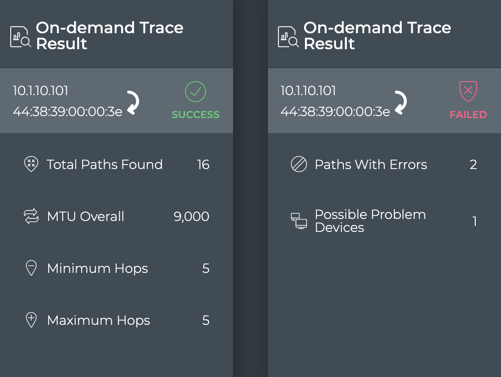
In the example on the left, we see that the trace was successful. 16 paths were found between the devices, each with five hops and with an overall MTU of 9,000. In the example on the right, we see that the trace failed. Two of the available paths were unsuccessful and a single device might be the problem.
If there was a difference between the minimum and maximum number of hops or other failures, viewing the results on the large card might provide additional information.
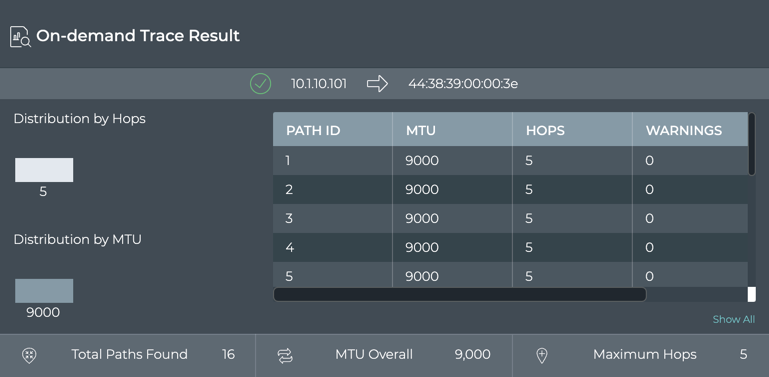
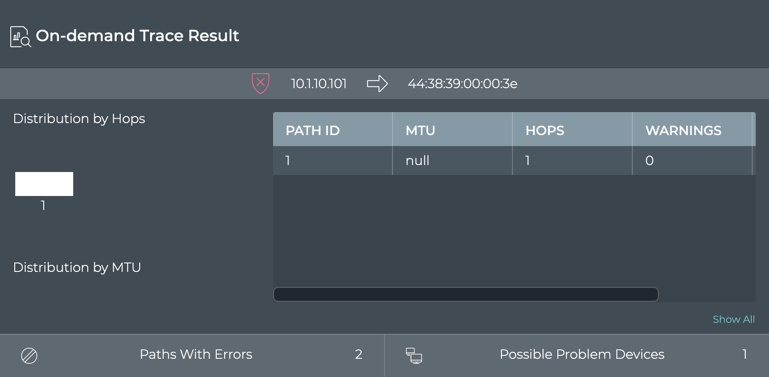
In the example on top, we can verify that every path option had five hops since the distribution chart only shows one hop count and the table indicates each path had a value of five hops. Similarly, you can view the MTU data. In the example on the bottom, is an error (scroll to the right in the table to see the count). To view more details for this and other traces, refer to Detailed On-demand Trace Results.
netq trace command are displayed in the terminal window where you ran the command. Refer to Create On-demand Traces.After you have run the netq add trace command, you are able to view the results in the NetQ UI.
Open the NetQ UI and log in.
Open the workbench where the associated On-demand Trace Result card has been placed.
To view more details for this and other traces, refer to Detailed On-demand Trace Results.
View Detailed On-demand Trace Results
You can dig deeper into the results of a trace in the NetQ UI, viewing the interfaces, ports, tunnels, VLANs, etc. for each available path.
To view the more detail:
Locate the On-demand Trace Results card for the trace of interest.
Change to the full-screen card using the card size picker.
Double-click on the trace of interest to open the detail view.
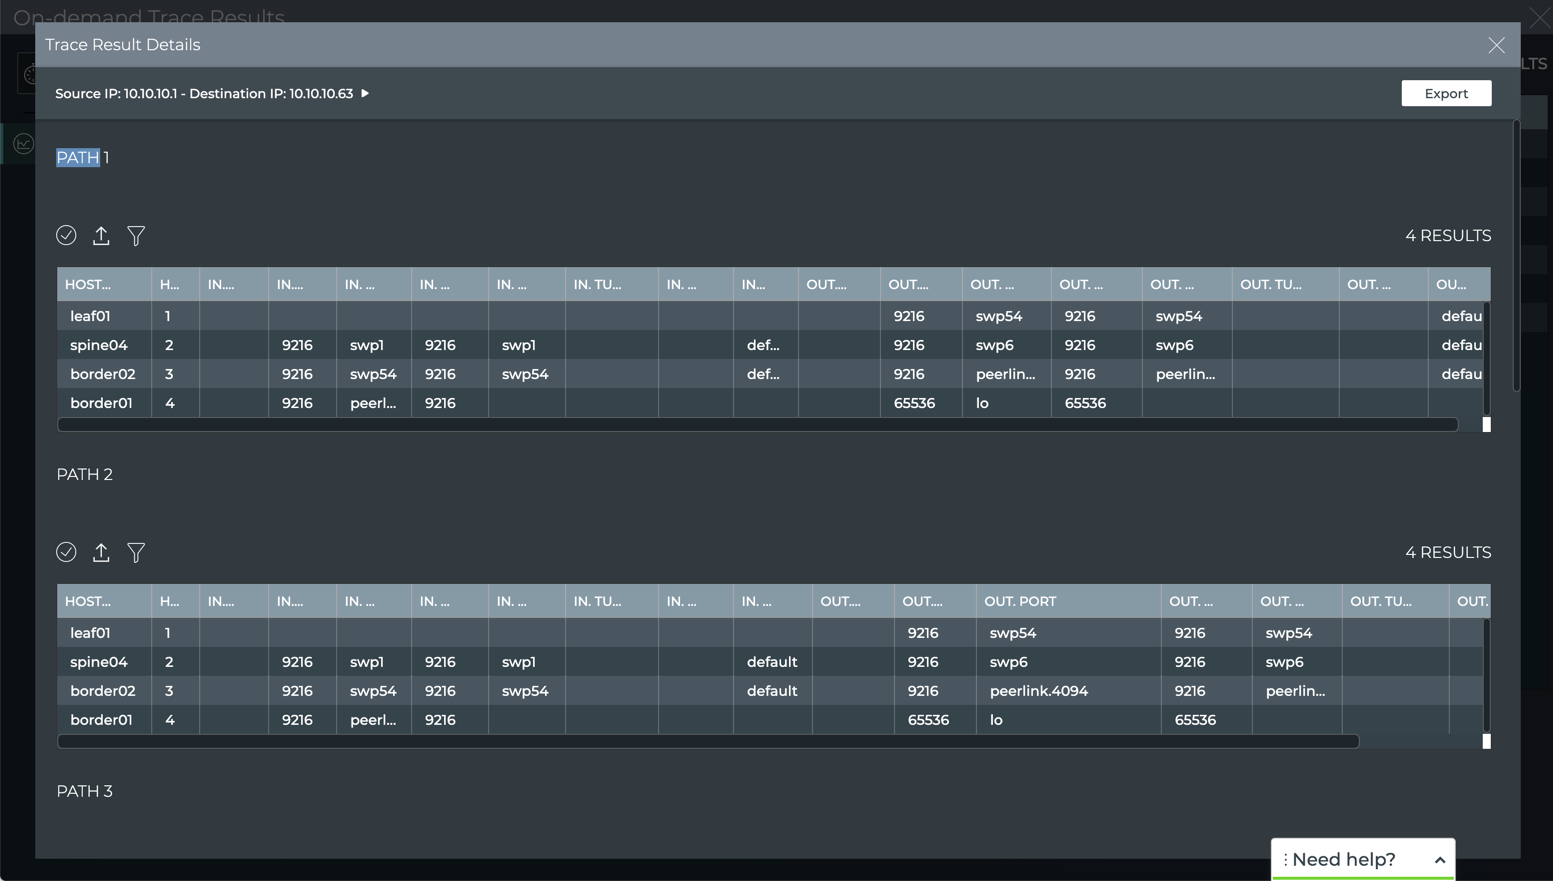
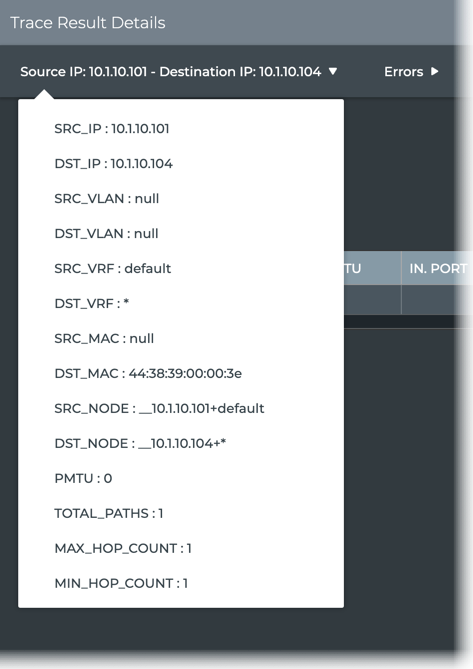
This view provides:
Configuration details for the trace: click the trace above the table
Errors and warnings for all paths: click Errors or Warnings above the table
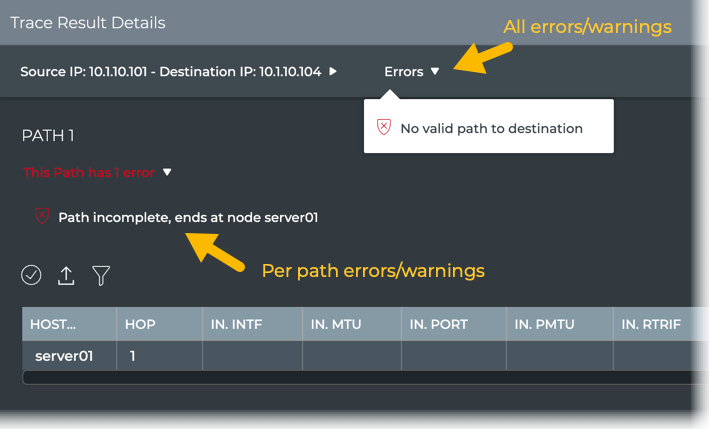
If the trace was run on a Mellanox switch and drops were detected by the What Just Happened feature, they are also included here.
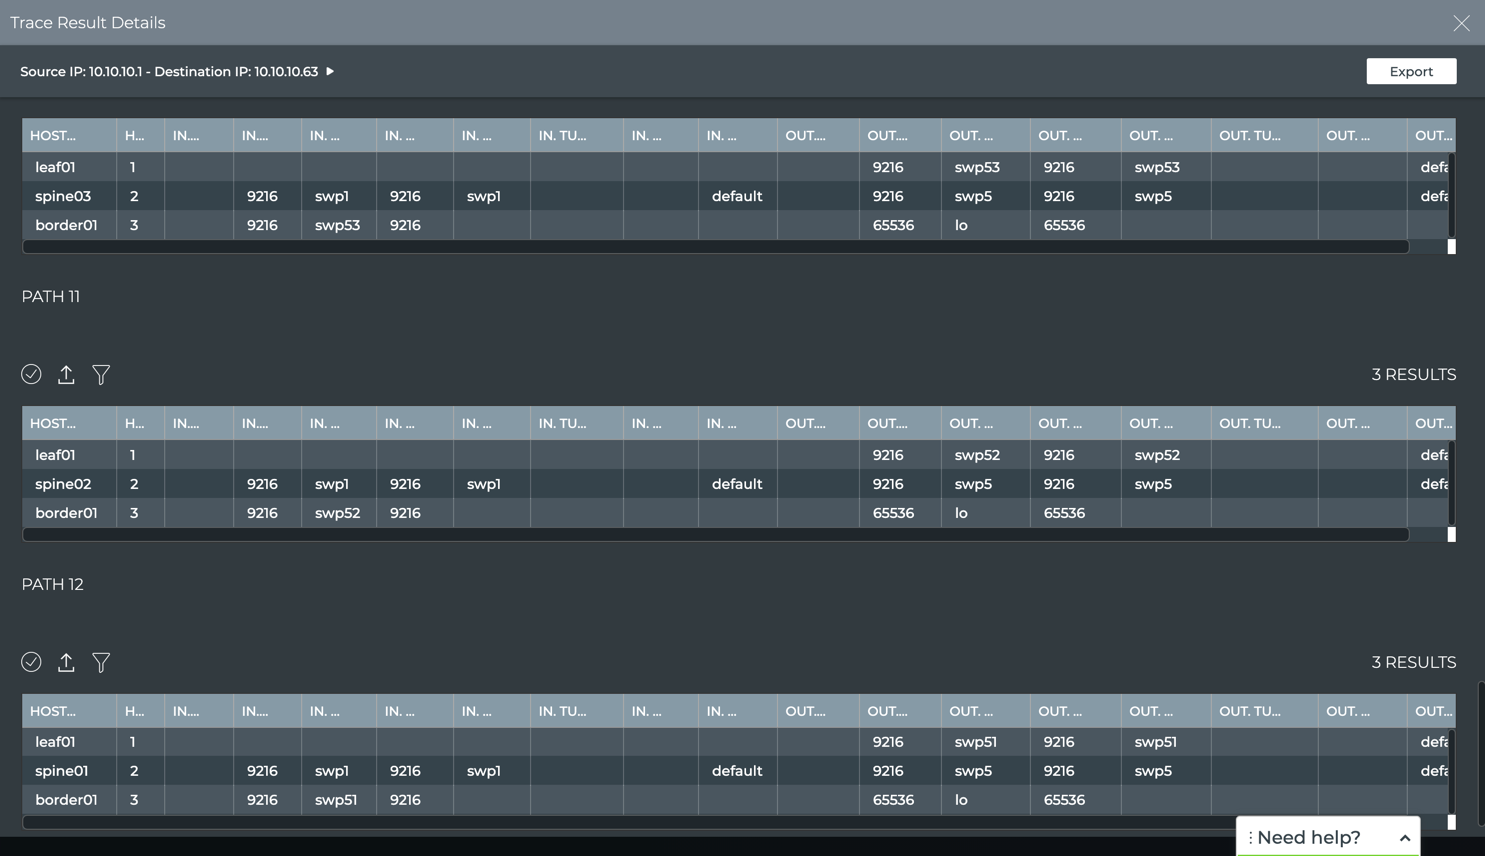
Path details: walk through the path, host by host, viewing the interfaces, ports, tunnels, VLANs, and so forth used to traverse the network from the source to the destination. Scroll down to view all paths.
If you have a large number of paths, click Load More at the bottom of the details page to view additional path data.
Note that in our example, paths 9-12 have only three hops because they do not traverse through the border02 switch, but go directly from spine04 to border01. Routing would likely choose these paths over the four-hop paths.
Create Scheduled Traces
There might be paths through your network that you consider critical or particularly important to your everyday operations. In these cases, it might be useful to create one or more traces to periodically confirm that at least one path is available between the relevant two devices. You can create scheduled traces at layer 2 or layer 3 in your network, from the NetQ UI and the NetQ CLI.
Create a Layer 3 Scheduled Trace
Use the instructions here, based on how you want to create the trace using the NetQ UI or NetQ CLI.
To schedule a trace:
Determine the IP addresses of the two devices to be traced.
Click
(main menu), then IP Addresses under the Network section.Click
and enter a hostname.Make note of the relevant address.
Filter the list again for the other hostname, and make note of its address.
Open the Trace Request card.
- On new workbench: Click in the Global Search box. Type trace. Click on card name.
- On current workbench: Click . Click Trace. Click on card. Click Open Cards.
In the Source field, enter the hostname or IP address of the device where you want to start the trace.
In the Destination field, enter IP address of the device where you want to end the trace.
Select a timeframe under Schedule to specify how often you want to run the trace.
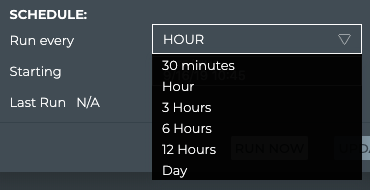
- Accept the default starting time, or click in the Starting field to specify the day you want the trace to run for the first time.

Click Next.
Click the time you want the trace to run for the first time.
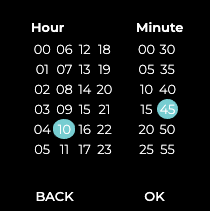
Click OK.
Verify your entries are correct, then click Save As New.
This example shows the creation of a scheduled trace between leaf01 (source, 10.10.10.1) and border01 (destination, 10.10.10.63) at 5:00 am each day with the first run occurring on November 5, 2020.
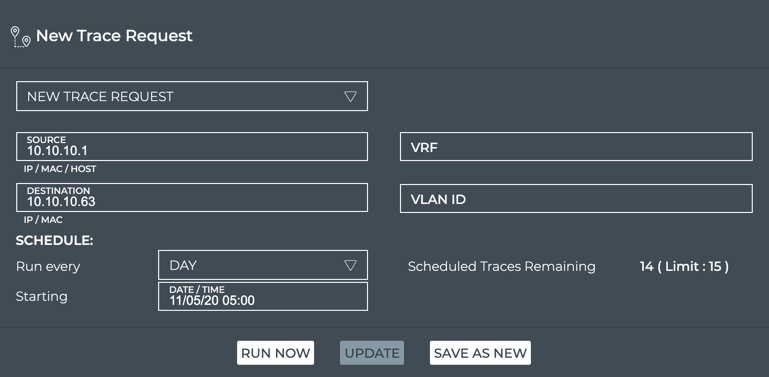
- Provide a name for the trace. Note: This name must be unique for a given user.

Click Save.
You can now run this trace on demand by selecting it from the dropdown list, or wait for it to run on its defined schedule. To view the scheduled trace results after its normal run, refer to View Scheduled Trace Results.
To create a layer 3 scheduled trace and see the results in the Scheduled Trace Results card, run:
netq add trace name <text-new-trace-name> <ip> from (<src-hostname>|<ip-src>) interval <text-time-min>
This example shows the creation of a scheduled trace between leaf01 (source, 10.10.10.1) and border01 (destination, 10.10.10.63) with a name of L01toB01Daily that runs on an daily basis. The interval option value is 1440 minutes, as denoted by the units indicator (m).
cumulus@switch:~$ netq add trace name Lf01toBor01Daily 10.10.10.63 from 10.10.10.1 interval 1440m
Successfully added/updated Lf01toBor01Daily running every 1440m
View the results in the NetQ UI. Refer to View Scheduled Trace Results.
Create a Layer 3 Scheduled Trace through a Given VRF
Use the instructions here, based on how you want to create the trace using the NetQ UI or NetQ CLI.
To schedule a trace from the NetQ UI:
Determine the IP addresses of the two devices you want to trace.
Click
(main menu), then IP Addresses under the Network section.Click
and enter a hostname.Make note of the relevant address.
Filter the list again for the other hostname, and make note of its address.
Open the Trace Request card.
Click
. Click Trace. Click the card. Click Open Cards.In the Source field, enter the hostname or IP address of the device where you want to start the trace.
In the Destination field, enter IP address of the device where you want to end the trace.
Enter a VRF interface if you are using anything other than the default VRF.
Select a timeframe under Schedule to specify how often you want to run the trace.
- Accept the default starting time, or click in the Starting field to specify the day you want the trace to run for the first time.
Click Next.
Click the time you want the trace to run for the first time.
Click OK.
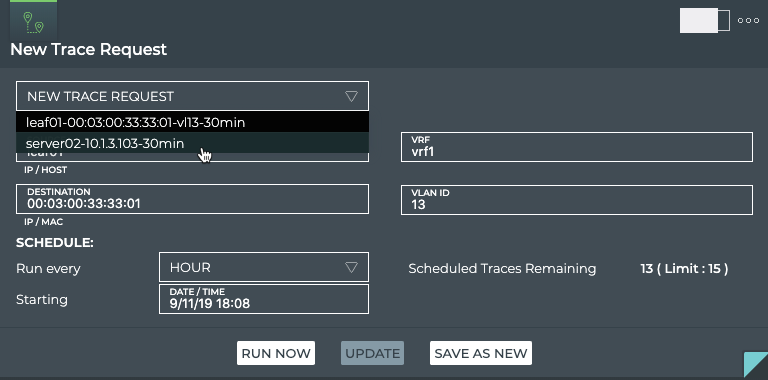
This example shows the creation of a scheduled trace between server01 (source, 10.1.10.101) and server02 (destination, 10.1.10.104) that is run on an hourly basis as of November 5, 2020.
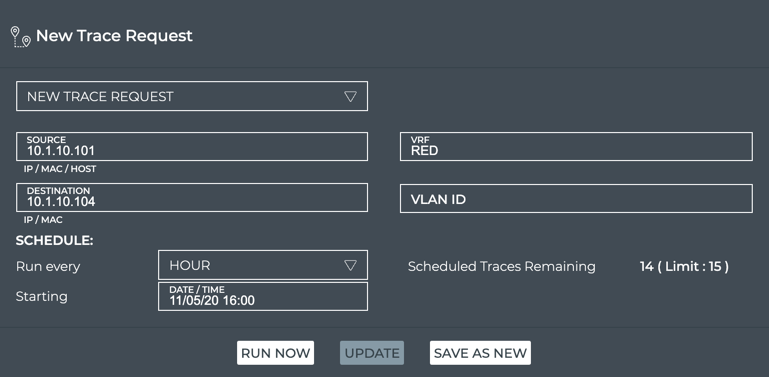
Verify your entries are correct, then click Save As New.
Provide a name for the trace. Note: This name must be unique for a given user.
Click Save.
You can now run this trace on demand by selecting it from the dropdown list, or wait for it to run on its defined schedule. To view the scheduled trace results after its normal run, refer to View Scheduled Trace Results.
To create a layer 3 scheduled trace that uses a VRF other than default and then see the results in the Scheduled Trace Results card, run:
netq add trace name <text-new-trace-name> <ip> from (<src-hostname>|<ip-src>) vrf <vrf> interval <text-time-min>
This example shows the creation of a scheduled trace between server01 (source, 10.1.10.101) and server04 (destination, 10.1.10.104) with a name of Svr01toSvr04Hrly that runs on an hourly basis. The interval option value is 60 minutes, as denoted by the units indicator (m).
cumulus@switch:~$ netq add trace name Svr01toSvr04Hrly 10.1.10.104 from 10.10.10.1 interval 60m
Successfully added/updated Svr01toSvr04Hrly running every 60m
View the results in the NetQ UI. Refer to View Scheduled Trace Results.
Create a Layer 2 Scheduled Trace
Use the instructions here, based on how you want to create the trace using the NetQ UI or NetQ CLI.
To schedule a layer 2 trace:
Determine the IP or MAC address of the source device and the MAC address of the destination device.
Click
(main menu), then IP Neighbors under the Network section.Click
and enter destination hostname.Make note of the MAC address and VLAN ID.
Filter the list again for the source hostname, and make note of its IP or MAC address.
Open the Trace Request card.
- On new workbench: Click in the Global Search field. Type trace. Click the card name.
- On current workbench: Click . Click Trace. Click the card. Click Open Cards.
In the Source field, enter the hostname, IP or MAC address of the device where you want to start the trace.
In the Destination field, enter the MAC address of the device where you want to end the trace.
In the VLAN field, enter the VLAN ID associated with the destination device.
Select a timeframe under Schedule to specify how often you want to run the trace.
- Accept the default starting time, or click in the Starting field to specify the day you want the trace to run for the first time.
Click Next.
Click the time you want the trace to run for the first time.
Click OK.
This example shows the creation of a scheduled trace between server01 (source, 44:38:39:00:00:32) and server04 (destination, 44:38:39:00:00:3e) on VLAN 10 that is run every three hours as of November 5, 2020 at 11 p.m.
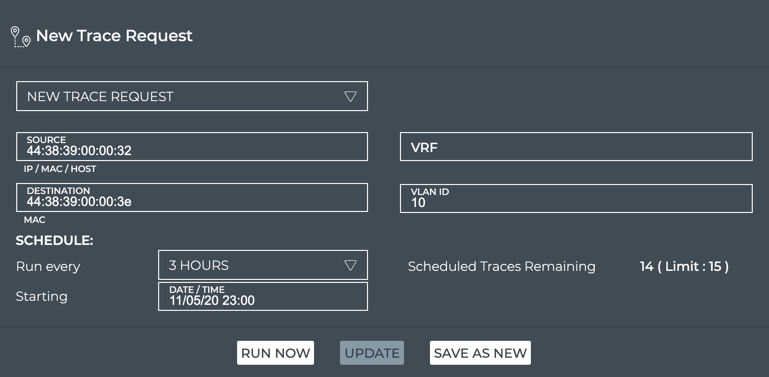
Verify your entries are correct, then click Save As New.
Provide a name for the trace. Note: This name must be unique for a given user.
Click Save.
You can now run this trace on demand by selecting it from the dropdown list, or wait for it to run on its defined schedule. To view the scheduled trace results after its normal run, refer to View Scheduled Trace Results.
To create a layer 2 scheduled trace and then see the results in the Scheduled Trace Result card, run:
netq add trace name <text-new-trace-name> <mac> vlan <1-4096> from (<src-hostname> | <ip-src>) [vrf <vrf>] interval <text-time-min>
This example shows the creation of a scheduled trace between server01 (source, 10.1.10.101) and server04 (destination, 44:38:39:00:00:3e) on VLAN 10 with a name of Svr01toSvr04x3Hrs that runs every three hours. The interval option value is 180 minutes, as denoted by the units indicator (m).
cumulus@switch:~$ netq add trace name Svr01toSvr04x3Hrs 44:38:39:00:00:3e vlan 10 from 10.1.10.101 interval 180m
Successfully added/updated Svr01toSvr04x3Hrs running every 180m
View the results in the NetQ UI. Refer to View Scheduled Trace Results.
Run a Scheduled Trace on Demand
You might find that, although you have a schedule for a particular trace, you want to have visibility into the connectivity data now. You can run a scheduled trace on demand from the small, medium and large Trace Request cards.
To run a scheduled trace now:
Open the small or medium or large Trace Request card.
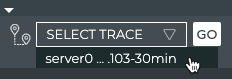
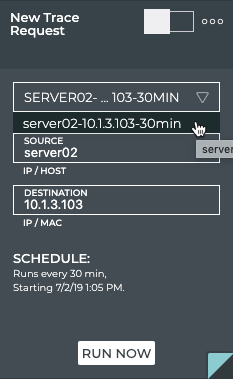
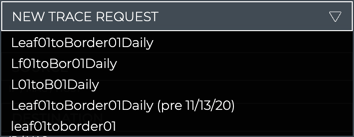
Select the scheduled trace from the Select Trace or New Trace Request list. Note: In the medium and large cards, the trace details are filled in on selection of the scheduled trace.
Click Go or Run Now. A corresponding Trace Results card is opened on your workbench.
View Scheduled Trace Results
You can view the results of scheduled traces at any time. Results can be displayed in the NetQ UI or in the NetQ CLI.
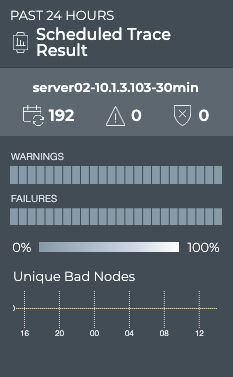
The results of scheduled traces are displayed on the Scheduled Trace Result card.
Granularity of Data Shown Based on Time Period
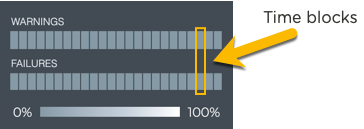
On the medium and large Trace Result cards, the status of the runs is represented in heat maps stacked vertically; one for runs with warnings and one for runs with failures. Depending on the time period of data on the card, the number of smaller time blocks used to indicate the status varies. A vertical stack of time blocks, one from each map, includes the results from all checks during that time. The results are shown by how saturated the color is for each block. If all traces run during that time period pass, then both blocks are 100% gray. If there are only failures, the associated lower blocks are 100% saturated white and the warning blocks are 100% saturated gray. As warnings and failures increase, the blocks increase their white saturation. As warnings or failures decrease, the blocks increase their gray saturation. An example heat map for a time period of 24 hours is shown here with the most common time periods in the table showing the resulting time blocks.
| Time Period | Number of Runs | Number Time Blocks | Amount of Time in Each Block |
|---|---|---|---|
| 6 hours | 18 | 6 | 1 hour |
| 12 hours | 36 | 12 | 1 hour |
| 24 hours | 72 | 24 | 1 hour |
| 1 week | 504 | 7 | 1 day |
| 1 month | 2,086 | 30 | 1 day |
| 1 quarter | 7,000 | 13 | 1 week |
View Detailed Scheduled Trace Results
Once a scheduled trace request has completed, the results are available in the corresponding Trace Result card.
To view the results:
Open the Trace Request card.
Click
. Click Trace. Click on card. Click Open Cards.Change to the full-screen card using the card size picker to view all scheduled traces.
Select the scheduled trace results you want to view.
Click
(Open Card). This opens the medium Scheduled Trace Results card(s) for the selected items.
Note the distribution of results. Are there many failures? Are they concentrated together in time? Has the trace begun passing again?
Hover over the heat maps to view the status numbers and what percentage of the total results that represents for a given region.
Switch to the large Scheduled Trace Result card.
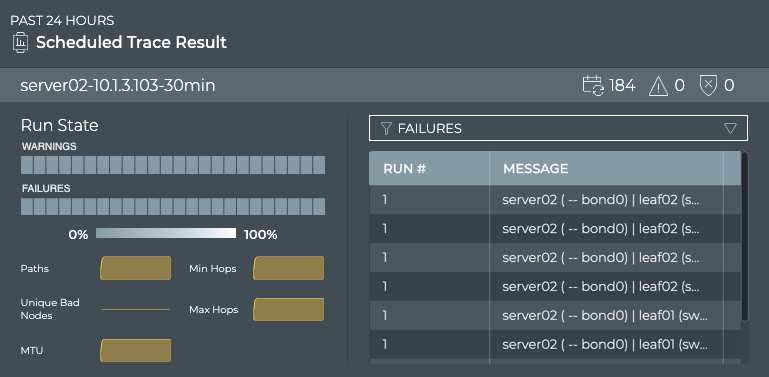
If there are a large number of warnings or failures, view the associated messages by selecting Failures or Warning in the filter above the table. This might help narrow the failures down to a particular device or small set of devices that you can investigate further.
Look for a consistent number of paths, MTU, hops in the small charts under the heat map. Changes over time here might correlate with the messages and give you a clue to any specific issues. Note if the number of bad nodes changes over time. Devices that become unreachable are often the cause of trace failures.
View the available paths for each run, by selecting Paths in the filter above the table.
You can view the configuration of the request that produced the results shown on this card workflow, by hovering over the card and clicking
 . If you want to change the configuration, click Edit to open the large Trace Request card, pre-populated with the current configuration. Follow the instructions in Create a Scheduled Trace Request to make your changes in the same way you created a new scheduled trace.
To view a summary of all scheduled trace results, switch to the full screen card.
Look for changes and patterns in the results for additional clues to isolate root causes of trace failures. Select and view related traces using the Edit menu.
View the details of any specific trace result by clicking on the trace. A new window opens similar to the following:
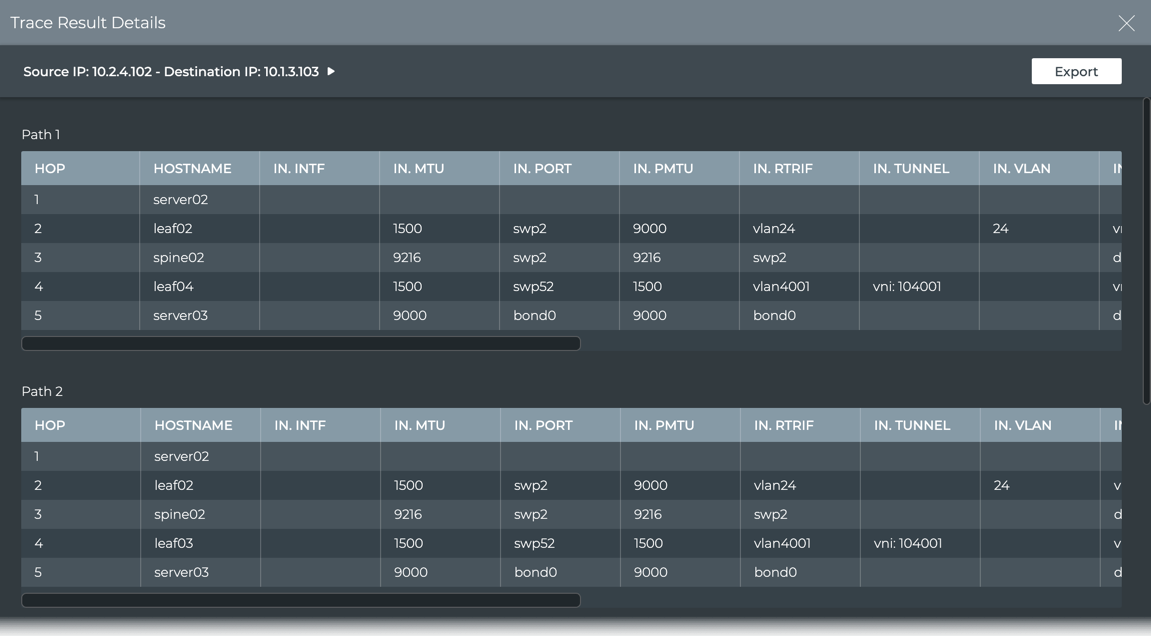
- Hop 1 is from the source device, server02 in this case.
- It exits this device at switch port bond0 with an MTU of 9000 and over the default VRF to get to leaf02.
- The trace goes in to swp2 with an MTU of 9216 over the vrf1 interface.
- It exits leaf02 through switch port 52 and so on.
- Export this data by clicking Export or click
 to return to the results list to view another trace in detail.
View a Summary of All Scheduled Traces
You can view a summary of all scheduled traces using the netq show trace summary command. The summary displays the name of the trace, a job ID, status, and timestamps for when was run and when it completed.
This example shows all scheduled traces run in the last 24 hours.
cumulus@switch:~$ netq show trace summary
Name            Job ID       Status           Status Details               Start Time           End Time
--------------- ------------ ---------------- ---------------------------- -------------------- ----------------
leaf01toborder0 f8d6a2c5-54d Complete         0                            Fri Nov  6 15:04:54  Fri Nov  6 15:05
1               b-44a8-9a5d-                                               2020                 :21 2020
                9d31f4e4701d
New Trace       0e65e196-ac0 Complete         1                            Fri Nov  6 15:04:48  Fri Nov  6 15:05
                5-49d7-8c81-                                               2020                 :03 2020
                6e6691e191ae
Svr01toSvr04Hrl 4c580c97-8af Complete         0                            Fri Nov  6 15:01:16  Fri Nov  6 15:01
y               8-4ea2-8c09-                                               2020                 :44 2020
                038cde9e196c
Abc             c7174fad-71c Complete         1                            Fri Nov  6 14:57:18  Fri Nov  6 14:58
                a-49d3-8c1d-                                               2020                 :11 2020
                67962039ebf9
Lf01toBor01Dail f501f9b0-cca Complete         0                            Fri Nov  6 14:52:35  Fri Nov  6 14:57
y               3-4fa1-a60d-                                               2020                 :55 2020
                fb6f495b7a0e
L01toB01Daily   38a75e0e-7f9 Complete         0                            Fri Nov  6 14:50:23  Fri Nov  6 14:57
                9-4e0c-8449-                                               2020                 :38 2020
                f63def1ab726
leaf01toborder0 f8d6a2c5-54d Complete         0                            Fri Nov  6 14:34:54  Fri Nov  6 14:57
1               b-44a8-9a5d-                                               2020                 :20 2020
                9d31f4e4701d
leaf01toborder0 f8d6a2c5-54d Complete         0                            Fri Nov  6 14:04:54  Fri Nov  6 14:05
1               b-44a8-9a5d-                                               2020                 :20 2020
                9d31f4e4701d
New Trace       0e65e196-ac0 Complete         1                            Fri Nov  6 14:04:48  Fri Nov  6 14:05
                5-49d7-8c81-                                               2020                 :02 2020
                6e6691e191ae
Svr01toSvr04Hrl 4c580c97-8af Complete         0                            Fri Nov  6 14:01:16  Fri Nov  6 14:01
y               8-4ea2-8c09-                                               2020                 :43 2020
                038cde9e196c
...
L01toB01Daily   38a75e0e-7f9 Complete         0                            Thu Nov  5 15:50:23  Thu Nov  5 15:58
                9-4e0c-8449-                                               2020                 :22 2020
                f63def1ab726
leaf01toborder0 f8d6a2c5-54d Complete         0                            Thu Nov  5 15:34:54  Thu Nov  5 15:58
1               b-44a8-9a5d-                                               2020                 :03 2020
                9d31f4e4701d
View Scheduled Trace Settings for a Given Trace
You can view the configuration settings used by a give scheduled trace using the netq show trace settings command.
This example shows the settings for the scheduled trace named Lf01toBor01Daily.
cumulus@switch:~$ netq show trace settings name Lf01toBor01Daily
View Scheduled Trace Results for a Given Trace
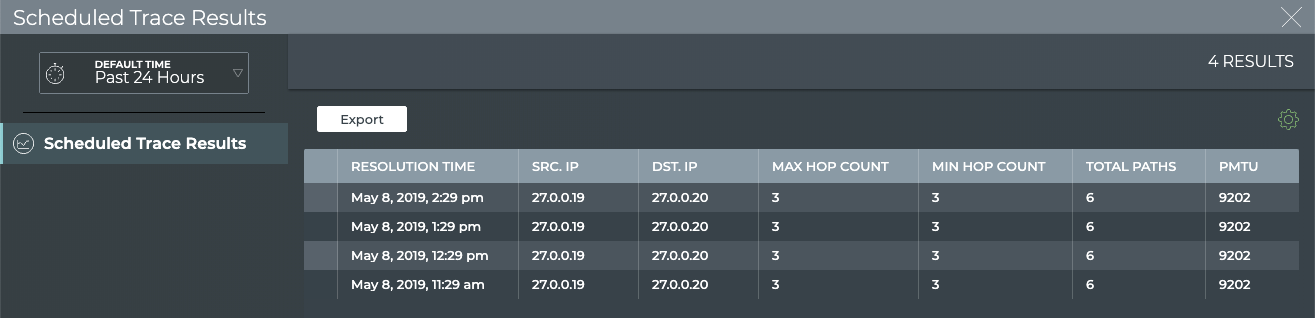
You can view the results for a give scheduled trace using the netq show trace results command.
This example obtains the job ID for the trace named Lf01toBor01Daily, then shows the results.
cumulus@switch:~$ netq show trace summary name Lf01toBor01Daily json
cumulus@switch:~$ netq show trace results f501f9b0-cca3-4fa1-a60d-fb6f495b7a0e
Manage Scheduled Traces
You can modify and remove scheduled traces at any time as described here. An administrator can also manage scheduled traces through the NetQ Management dashboard. Refer to Delete a Scheduled Trace for details.
Modify a Scheduled Trace
After reviewing the results of a scheduled trace for a period of time, you might want to modify how often you run it or use the VRF or VLAN. You can do this using the NetQ UI.
Be aware that changing the configuration of a trace can cause the results to be inconsistent with prior runs of the trace. If this is an unacceptable result, create a new scheduled trace. Optionally you can remove the original trace.
To modify a scheduled trace:
Open the Trace Request card.
Click
. Click Trace. Click the card. Click Open Cards.Select the trace from the New Trace Request dropdown.
Edit the schedule, VLAN or VRF as needed.
Click Update.
Click Yes to complete the changes, or change the name of the previous version of this scheduled trace.

Click the change name link.
Edit the name.
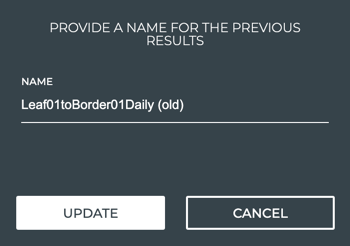
Click Update.
Click Yes to complete the changes, or repeat these steps until you have the name you want.
The validation can now be selected from the New Trace listing (on the small, medium or large size card) and run immediately using Go or Run Now, or you can wait for it to run the first time according to the schedule you specified. Refer to View Scheduled Trace Results.
Remove Scheduled Traces
If you have reached the maximum of 15 scheduled traces for your premises, you might need to remove one trace in favor of another. You can remove a scheduled trace at any time using the NetQ UI or NetQ CLI.
Both a standard user and an administrative user can remove scheduled traces. No notification is generated on removal. Be sure to communicate with other users before removing a scheduled trace to avoid confusion and support issues.
Open the Trace Request card.
Click
. Click Trace. Click on card. Click Open Cards.Change to the full-screen card using the card size picker.
Select one or more traces to remove.
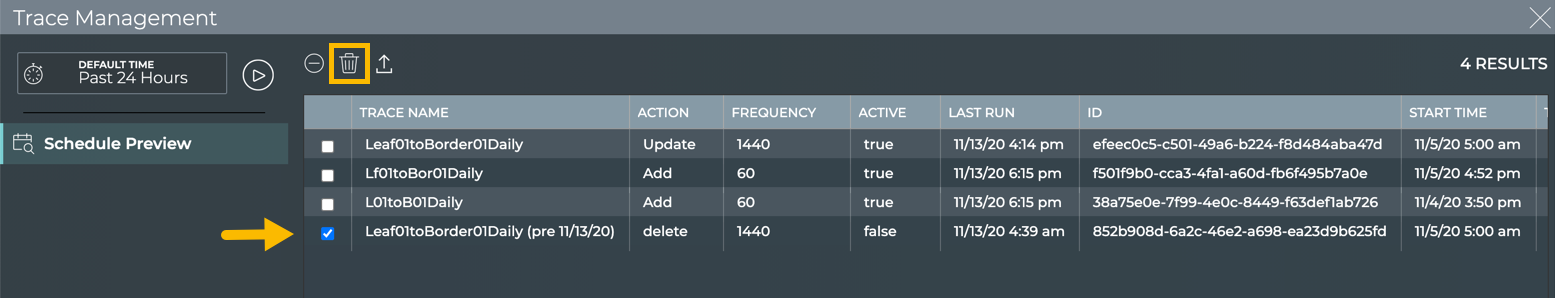
- Click
 .
.
Determine the name of the scheduled trace you want to remove. Run:
netq show trace summary [name <text-trace-name>] [around <text-time-hr>] [json]This example shows all scheduled traces in JSON format. Alternately, drop the
jsonoption and obtain the name for the standard output.cumulus@switch:~$ netq show trace summary json [ { "job_end_time": 1605300327131, "job_req_time": 1604424893944, "job_start_time": 1605300318198, "jobid": "f8d6a2c5-54db-44a8-9a5d-9d31f4e4701d", "status": "Complete", "status_details": "1", "trace_name": "leaf01toborder01", "trace_params": { "alert_on_failure": "0", "dst": "10.10.10.63", "src": "10.10.10.1", "vlan": "-1", "vrf": "" } }, { "job_end_time": 1605300237448, "job_req_time": 1604424893944, "job_start_time": 1605300206939, "jobid": "f8d6a2c5-54db-44a8-9a5d-9d31f4e4701d", "status": "Complete", "status_details": "1", "trace_name": "leaf01toborder01", "trace_params": { "alert_on_failure": "0", "dst": "10.10.10.63", "src": "10.10.10.1", "vlan": "-1", "vrf": "" } }, { "job_end_time": 1605300223824, "job_req_time": 1604599038706, "job_start_time": 1605300206930, "jobid": "c7174fad-71ca-49d3-8c1d-67962039ebf9", "status": "Complete", "status_details": "1", "trace_name": "Abc", "trace_params": { "alert_on_failure": "1", "dst": "27.0.0.2", "src": "27.0.0.1", "vlan": "-1", "vrf": "" } }, { "job_end_time": 1605300233045, "job_req_time": 1604519423182, "job_start_time": 1605300206930, "jobid": "38a75e0e-7f99-4e0c-8449-f63def1ab726", "status": "Complete", "status_details": "1", "trace_name": "L01toB01Daily", "trace_params": { "alert_on_failure": "0", "dst": "10.10.10.63", "src": "10.10.10.1", "vlan": "-1", "vrf": "" } }, ...Remove the trace. Run:
netq del trace <text-trace-name>This example removes the leaf01toborder01 trace.
cumulus@switch:~$ netq del trace leaf01toborder01
Successfully deleted schedule trace leaf01toborder01
Repeat these steps for additional traces you want to remove.