NVIDIA® Cumulus NetQ™ is a highly scalable, modern network operations tool set that utilizes telemetry for deep troubleshooting, visibility, and automated workflows from a single GUI interface, reducing maintenance and network downtime. It combines the ability to easily upgrade, configure and deploy network elements with a full suite of operations capabilities, such as visibility, troubleshooting, validation, trace and comparative look-back functionality.
This guide is intended for network administrators who are responsible for deploying, configuring, monitoring and troubleshooting the network in their data center or campus environment. NetQ 4.1 offers the ability to easily monitor and manage your network infrastructure and operational health. This guide provides instructions and information about monitoring individual components of the network, the network as a whole, and the NetQ software applications using the NetQ command line interface (NetQ CLI), NetQ (graphical) user interface (NetQ UI), and NetQ Admin UI.
What's New
Cumulus NetQ 4.1 eases your customers deployment and maintenance activities for their data center networks with new configuration, performance, and security features and improvements.
The k8s cluster security certificate is now valid for 10 years from the date of installation.
Enhanced monitoring for the SONiC operating system. Support includes collection of the MAC FDB, interface counters, and DOM information. This is an early access feature.
You can upgrade NetQ versions 3.0.0 and later directly to version 4.1.0. Upgrades from NetQ 2.4.x and earlier require a fresh installation.
Additional Information
For information regarding bug fixes and known issues present in this release, refer to the release notes.
NetQ CLI Changes
Many commands have changed in this release to accommodate the addition of new options or to simplify their syntax. Additionally, NVIDIA added new commands while removing others. This topic provides a summary of those changes.
New Commands
The following table summarizes the new commands available with this release.
Command
Summary
Version
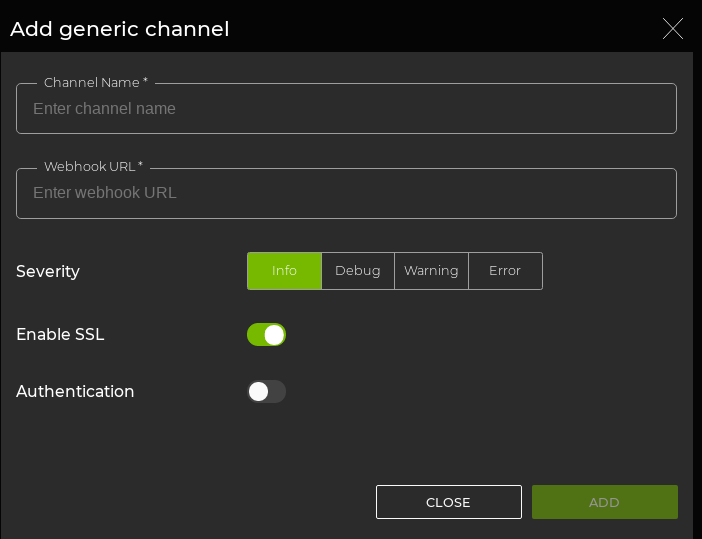
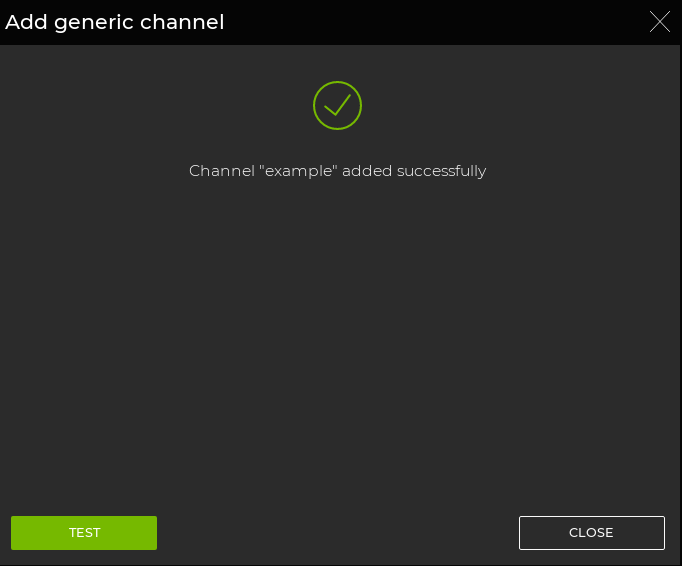
netq add notification channel generic
Configures the generic webhook channel.
4.1.0
netq install cluster add-worker
Adds a new worker node in an on-premise cluster deployment.
4.1.0
netq install opta cluster add-worker
Adds a new worker node in a cloud-hosted cluster deployment.
4.1.0
netq check addresses
Validation for duplicate address detection.
4.1.0
Modified Commands
The following table summarizes the commands that have changed with this release.
Updated Command
What Changed
Version
netq show wjh-drop
added [between <text-fixed-time> and <text-fixed-endtime>] [around <text-fixed-time>] This accepts a time string such as 10m, 30s, 1h, 1d. Absolute epoch time in seconds is also accepted e.g. 1638205776
4.1.0
netq check evpn netq check vxlan
Added [streaming] option to perform a streaming query check.
4.1.0
netq check evpn
Removed mac-consistency option. Use include 2 for this data instead.
4.1.0
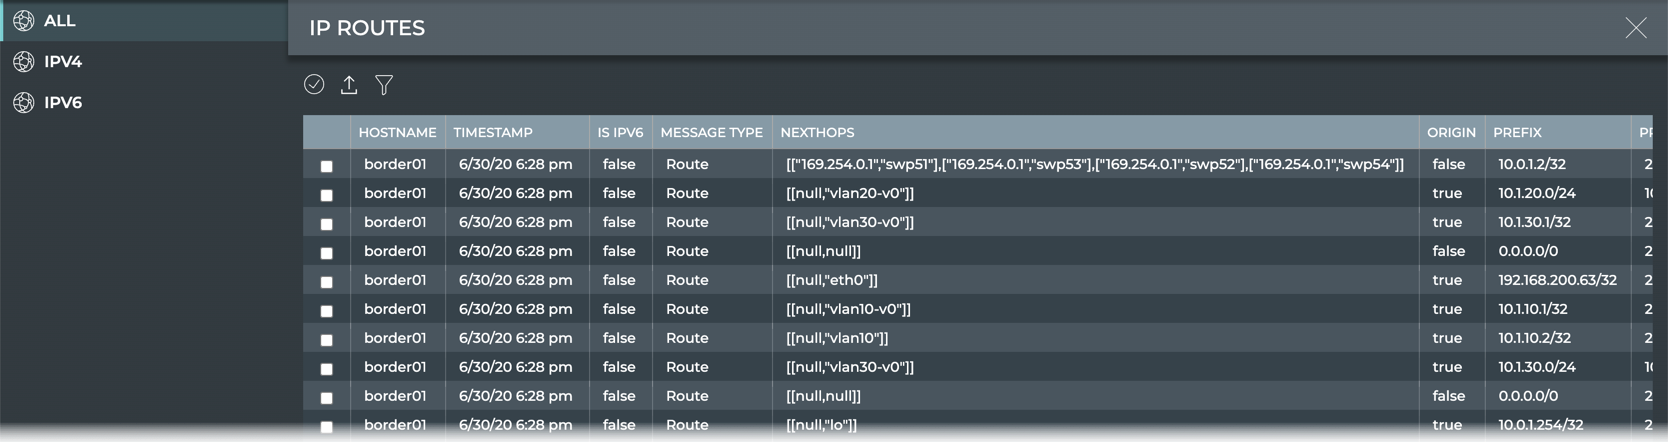
netq show ip routes netq show ip routes netq show ipv6 routes netq show ipv6 routes
Added [edge] option to display the edge switch that a route is learned from on hosts and network devices that do not run Cumulus Linux.
4.1.0
Removed Commands
The following table summarizes the commands that have been removed in this release.
Updated Command
Version
netq config add agent gnmi-log-level
4.1.0
Get Started
This topic provides overviews of NetQ components, architecture, and the CLI and UI interfaces. These provide the basis for understanding and following the instructions contained in the rest of the user guide.
NetQ Overview
Cumulus NetQ is a highly scalable, modern network operations tool set that provides visibility and troubleshooting of your overlay and underlay networks in real-time. NetQ delivers actionable insights and operational intelligence about the health of your data center - from the container, virtual machine, or host, all the way to the switch and port. NetQ correlates configuration and operational status, and instantly identifies and tracks state changes while simplifying management for the entire Linux-based data center. With NetQ, network operations change from a manual, reactive, node-by-node approach to an automated, informed and agile one.
NetQ performs three primary functions:
Data collection: real-time and historical telemetry and network state information
Data analytics: deep processing of the data
Data visualization: rich graphical user interface (GUI) for actionable insight
NetQ is available as an on-site or in-cloud deployment.
Unlike other network operations tools, NetQ delivers significant operational improvements to your network management and maintenance processes. It simplifies the data center network by reducing the complexity through real-time visibility into hardware and software status and eliminating the guesswork associated with investigating issues through the analysis and presentation of detailed, focused data.
Demystify Overlay Networks
While overlay networks provide significant advantages in network management, it can be difficult to troubleshoot issues that occur in the overlay one node at a time. You are unable to correlate what events (configuration changes, power outages, and so forth) might have caused problems in the network and when they occurred. Only a sampling of data is available to use for your analysis. By contrast, with NetQ deployed, you have a networkwide view of the overlay network, can correlate events with what is happening now or in the past, and have real-time data to fill out the complete picture of your network health and operation.
In summary:
Without NetQ
With NetQ
Difficult to debug overlay network
View networkwide status of overlay network
Hard to find out what happened in the past
View historical activity with time-machine view
Periodically sampled data
Real-time collection of telemetry data for a more complete data set
Protect Network Integrity with NetQ Validation
Network configuration changes can cause the creation of many trouble tickets because you cannot test a new configuration before deploying it. When the tickets start pouring in, you are stuck with a large amount of data that is collected and stored in multiple tools, making correlation of the events to the resolution required difficult at best. Isolating faults in the past is challenging. By contract, with NetQ deployed, you can proactively verify a configuration change as inconsistencies and can catch misconfigurations before deployment. And historical data is readily available to correlate past events with current issues.
In summary:
Without NetQ
With NetQ
Reactive to trouble tickets
Catch inconsistencies and misconfigurations before deployment with integrity checks/validation
Large amount of data and multiple tools to correlate the logs/events with the issues
Correlate network status, all in one place
Periodically sampled data
Readily available historical data for viewing and correlating changes in the past with current issues
Troubleshoot Issues Across the Network
Troubleshooting networks is challenging in the best of times, but trying to do so manually, one node at a time, and digging through a series of long and ugly logs make the job harder than it needs to be. NetQ provides rolled up and correlated network status on a regular basis, enabling you to get down to the root of the problem quickly, whether it occurred recently or over a week ago. The graphical user interface makes this possible visually to speed the analysis.
In summary:
Without NetQ
With NetQ
Large amount of data and multiple tools to correlate the logs/events with the issues
Rolled up and correlated network status, view events and status together
Past events are lost
Historical data gathered and stored for comparison with current network state
Manual, node-by-node troubleshooting
View issues on all devices all at one time, pointing to the source of the problem
Track Connectivity with NetQ Trace
Conventional trace only traverses the data path looking for problems, and does so on a node to node basis. For paths with a small number of hops that might be fine, but in larger networks, it can become very time consuming. NetQ verifies both the data and control paths, providing additional information. It discovers misconfigurations along all hops in one go, speeding the time to resolution.
In summary:
Without NetQ
With NetQ
Trace covers only data path; hard to check control path
Verifies both data and control paths
View portion of entire path
View all paths between devices at one time to find problem paths
Node-to-node check on misconfigurations
View any misconfigurations along all hops from source to destination
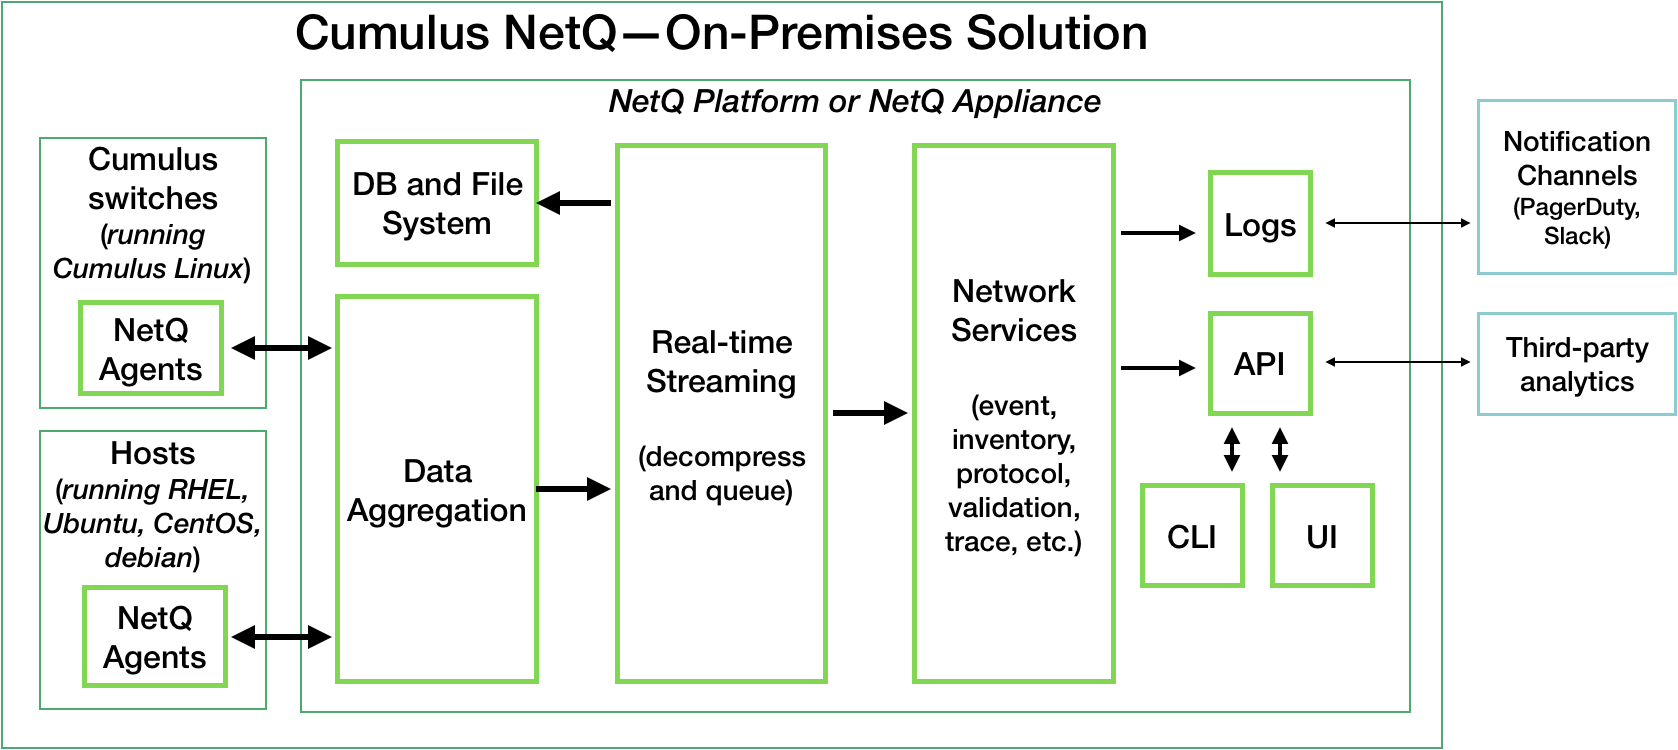
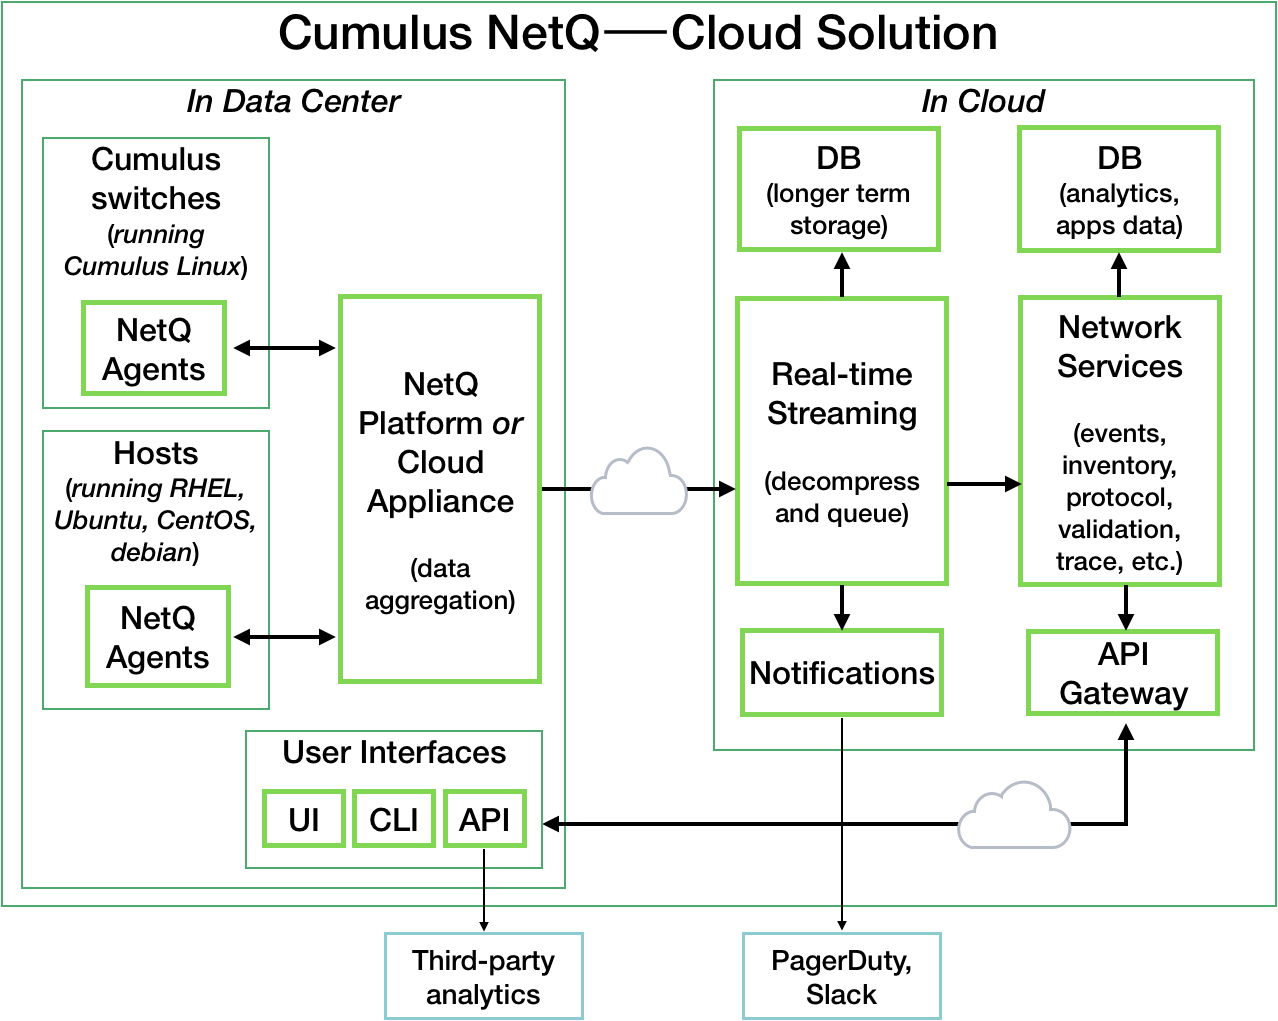
NetQ Components
Cumulus NetQ contains the following applications and key components:
Telemetry data collection and aggregation
NetQ switch agents
NetQ host agents
Telemetry data aggregation
Database
Data streaming
Network services
User interfaces
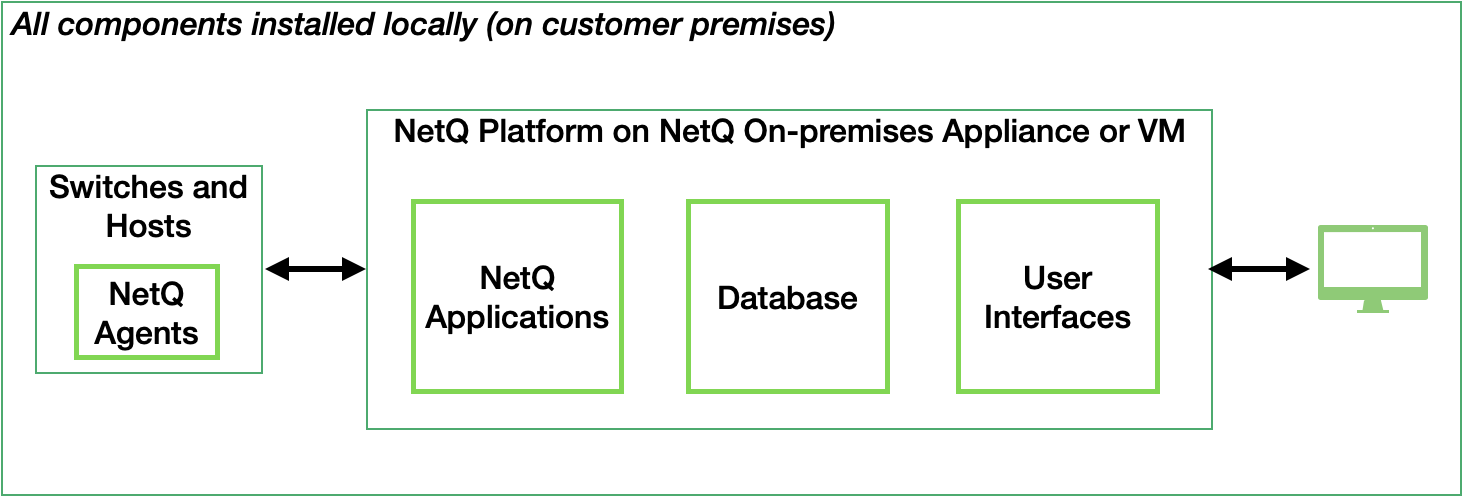
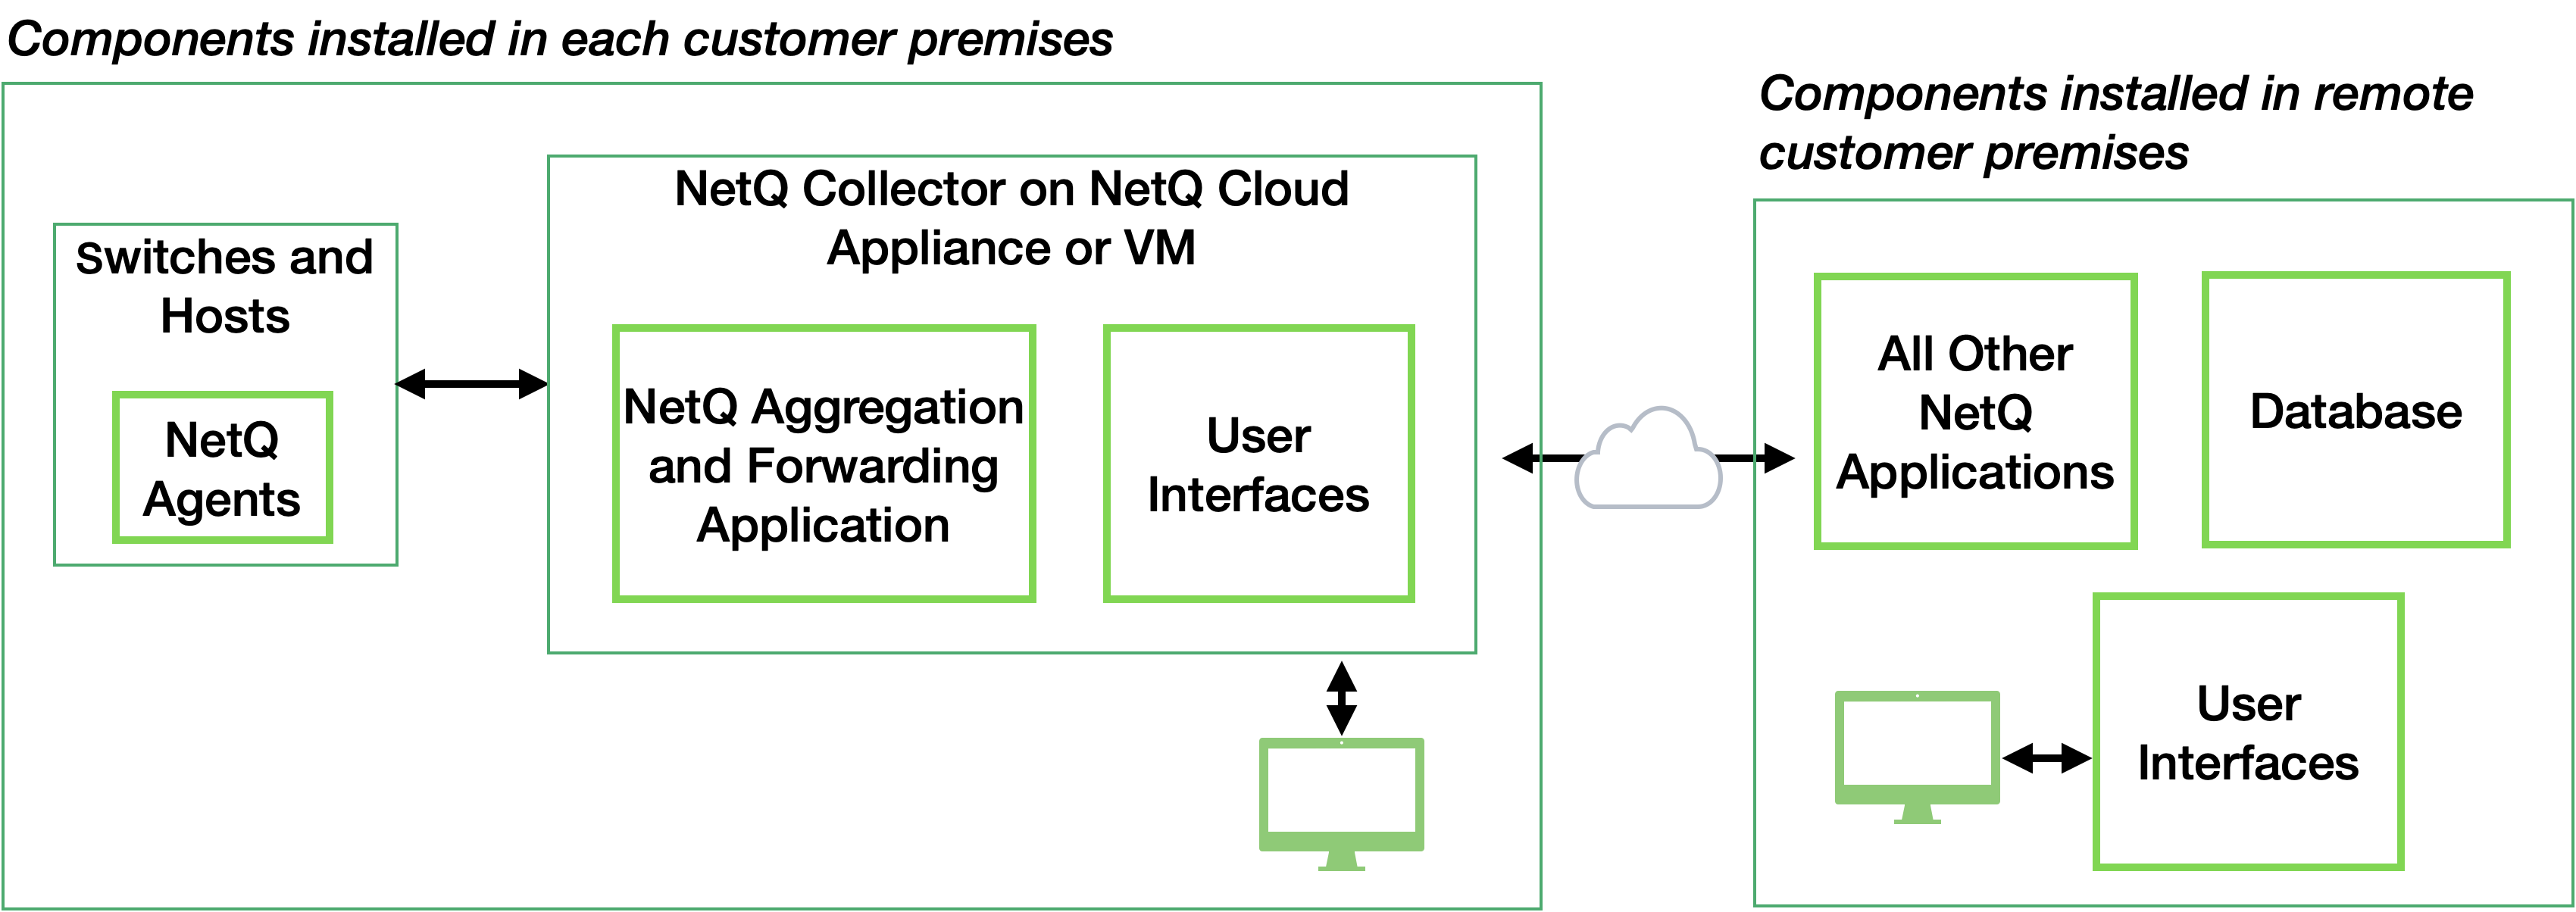
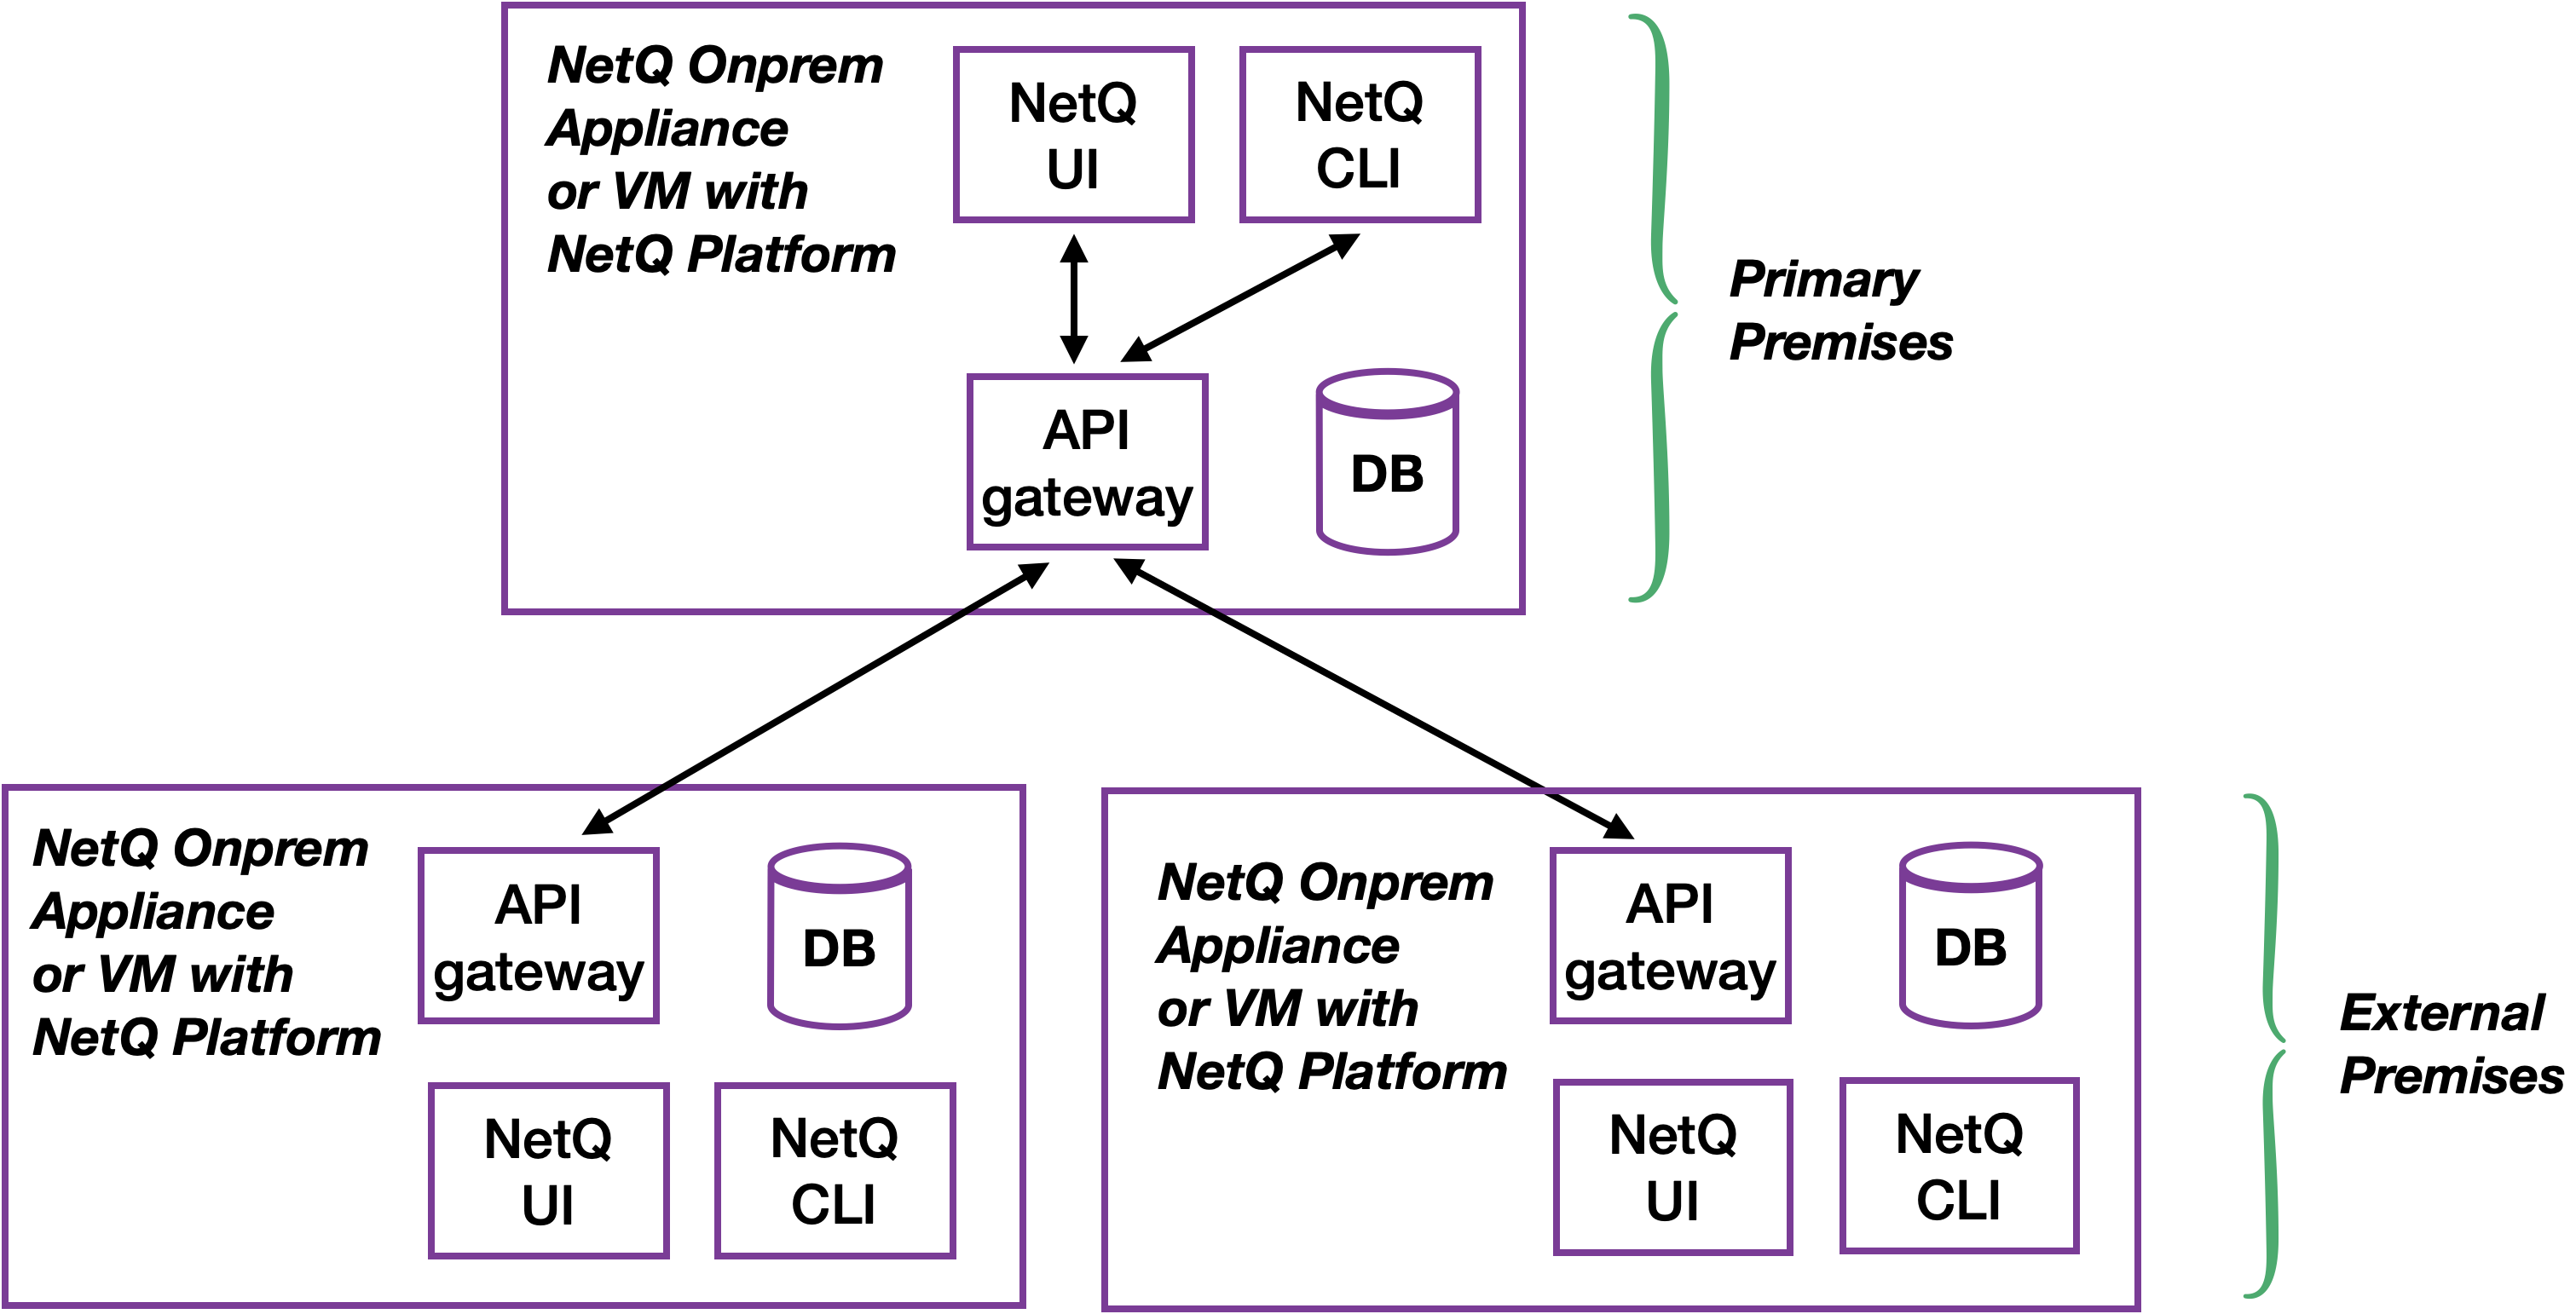
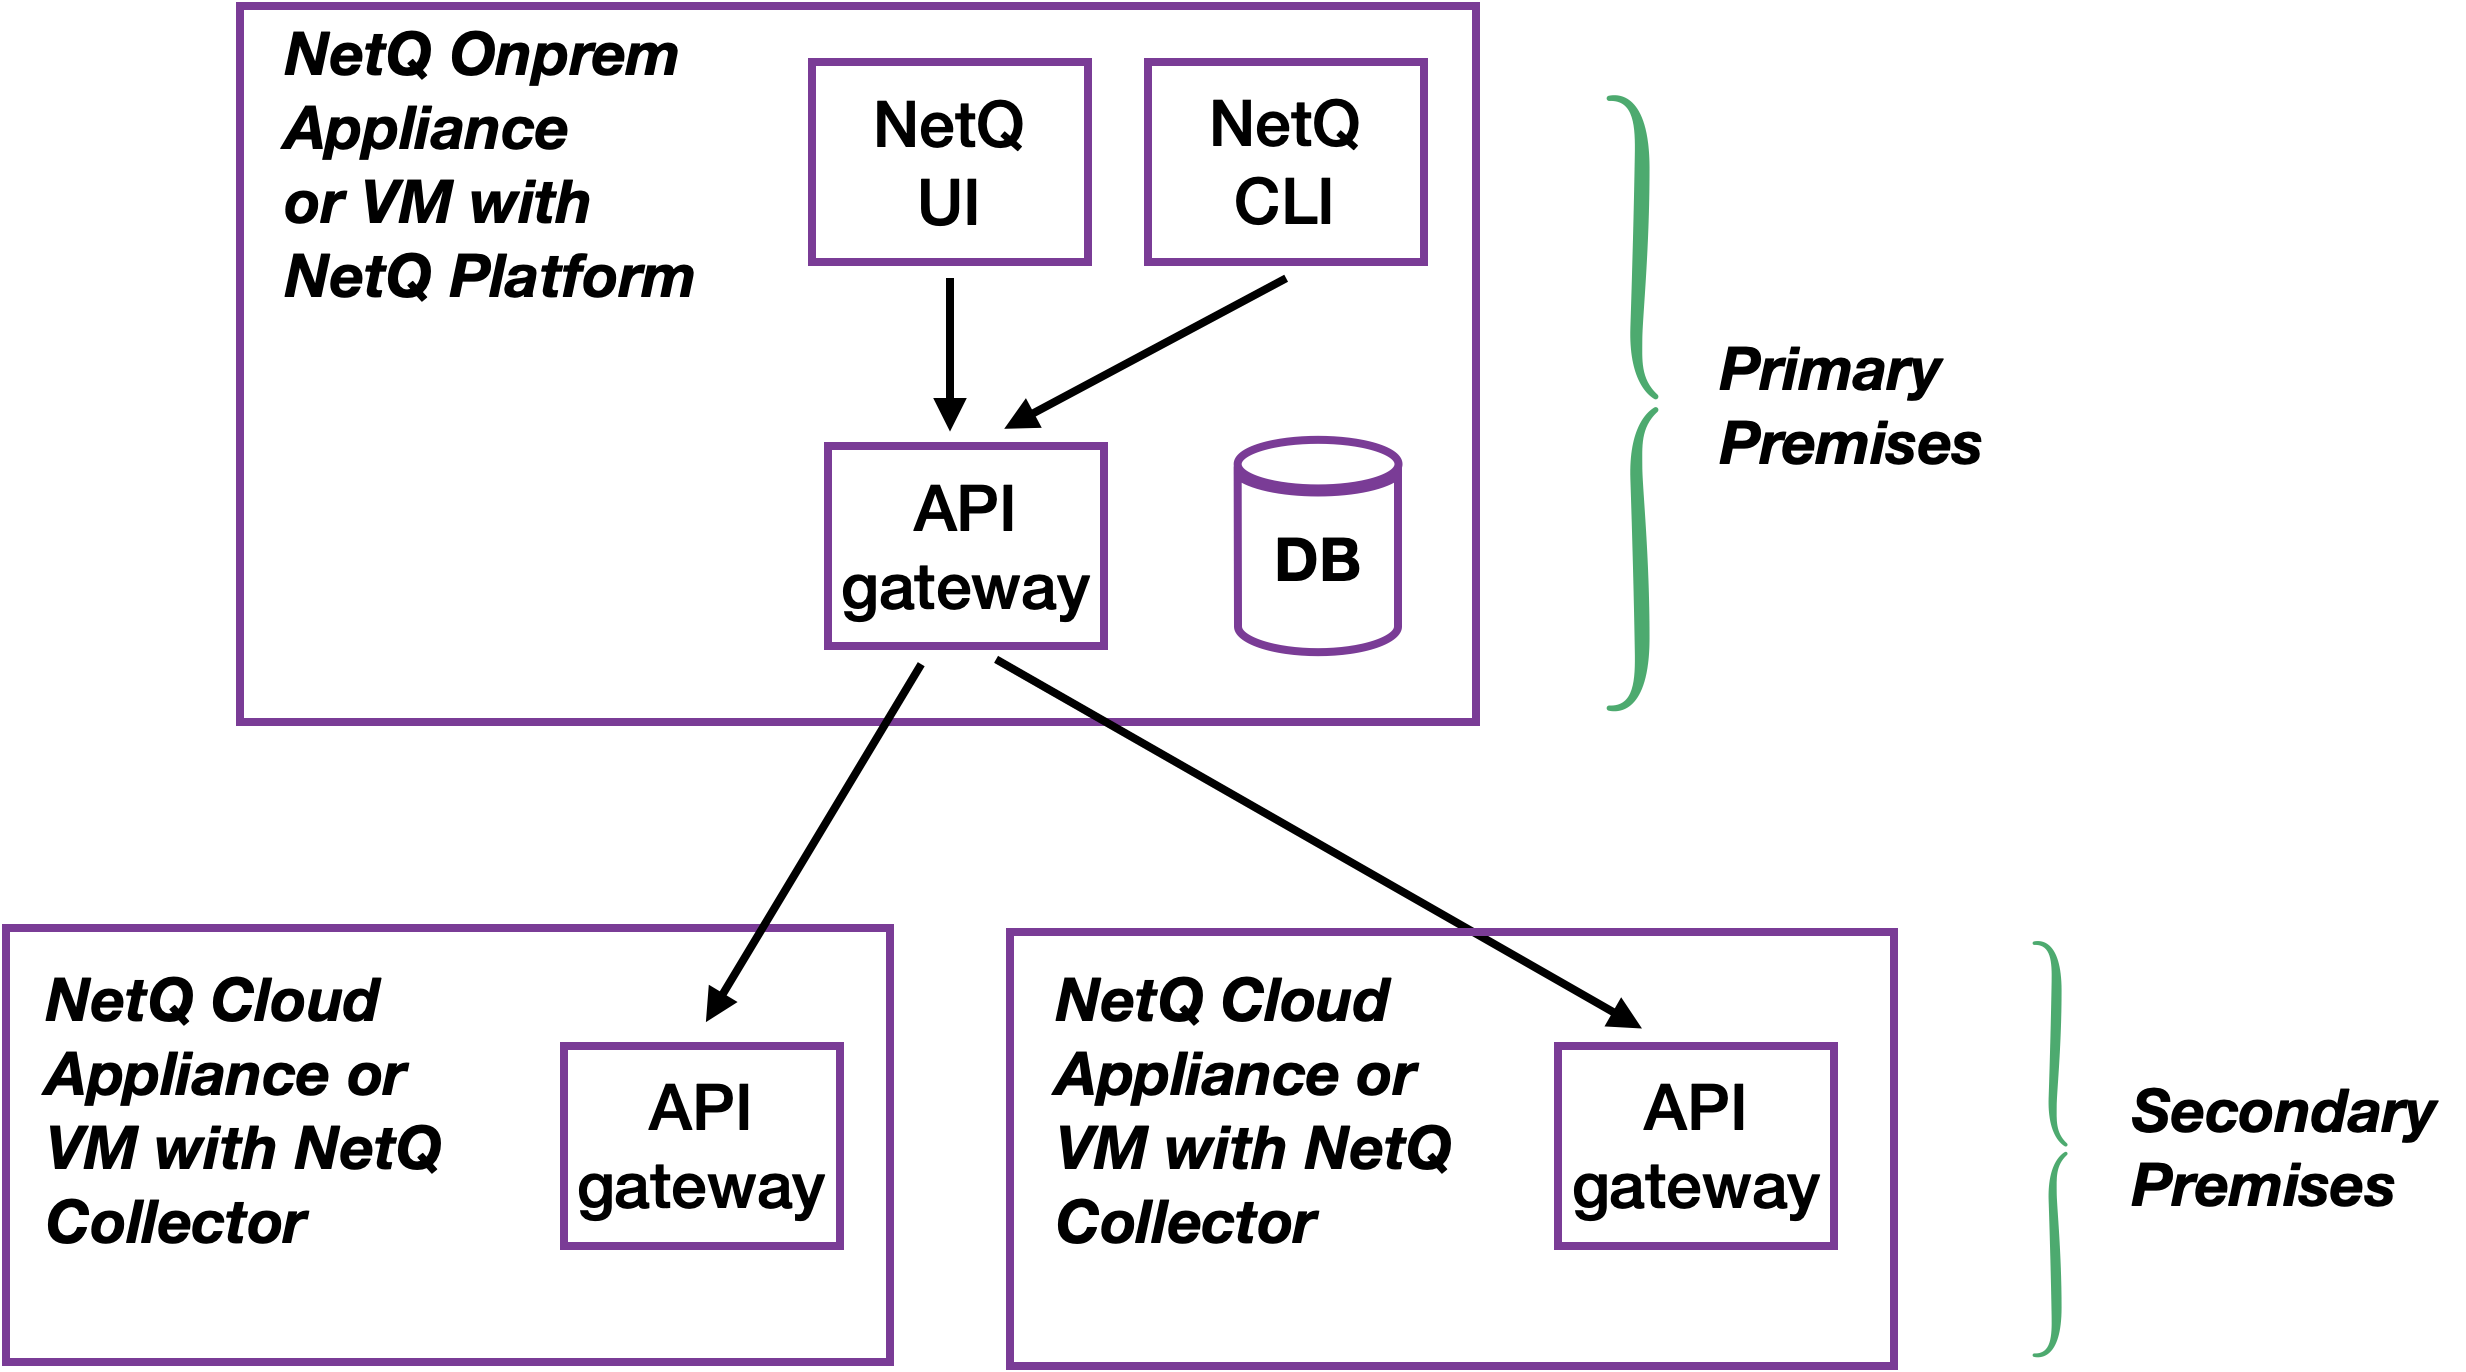
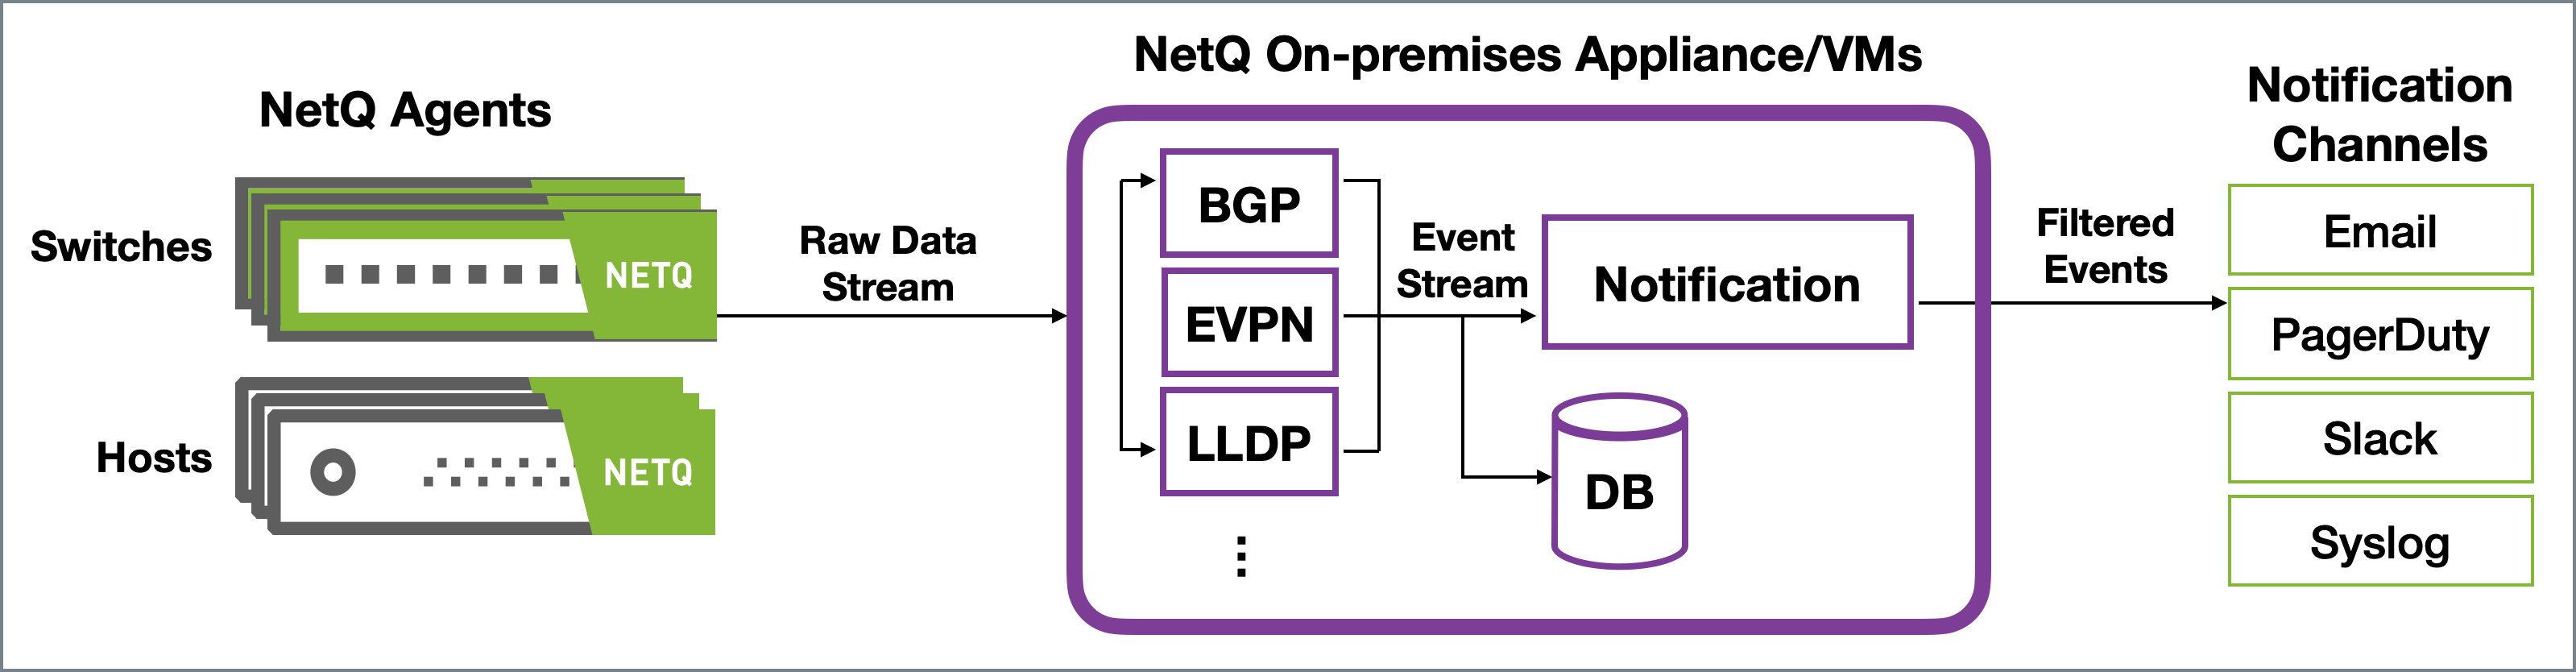
While these functions apply to both the on-premises and in-cloud solutions, where the functions reside varies, as shown here.
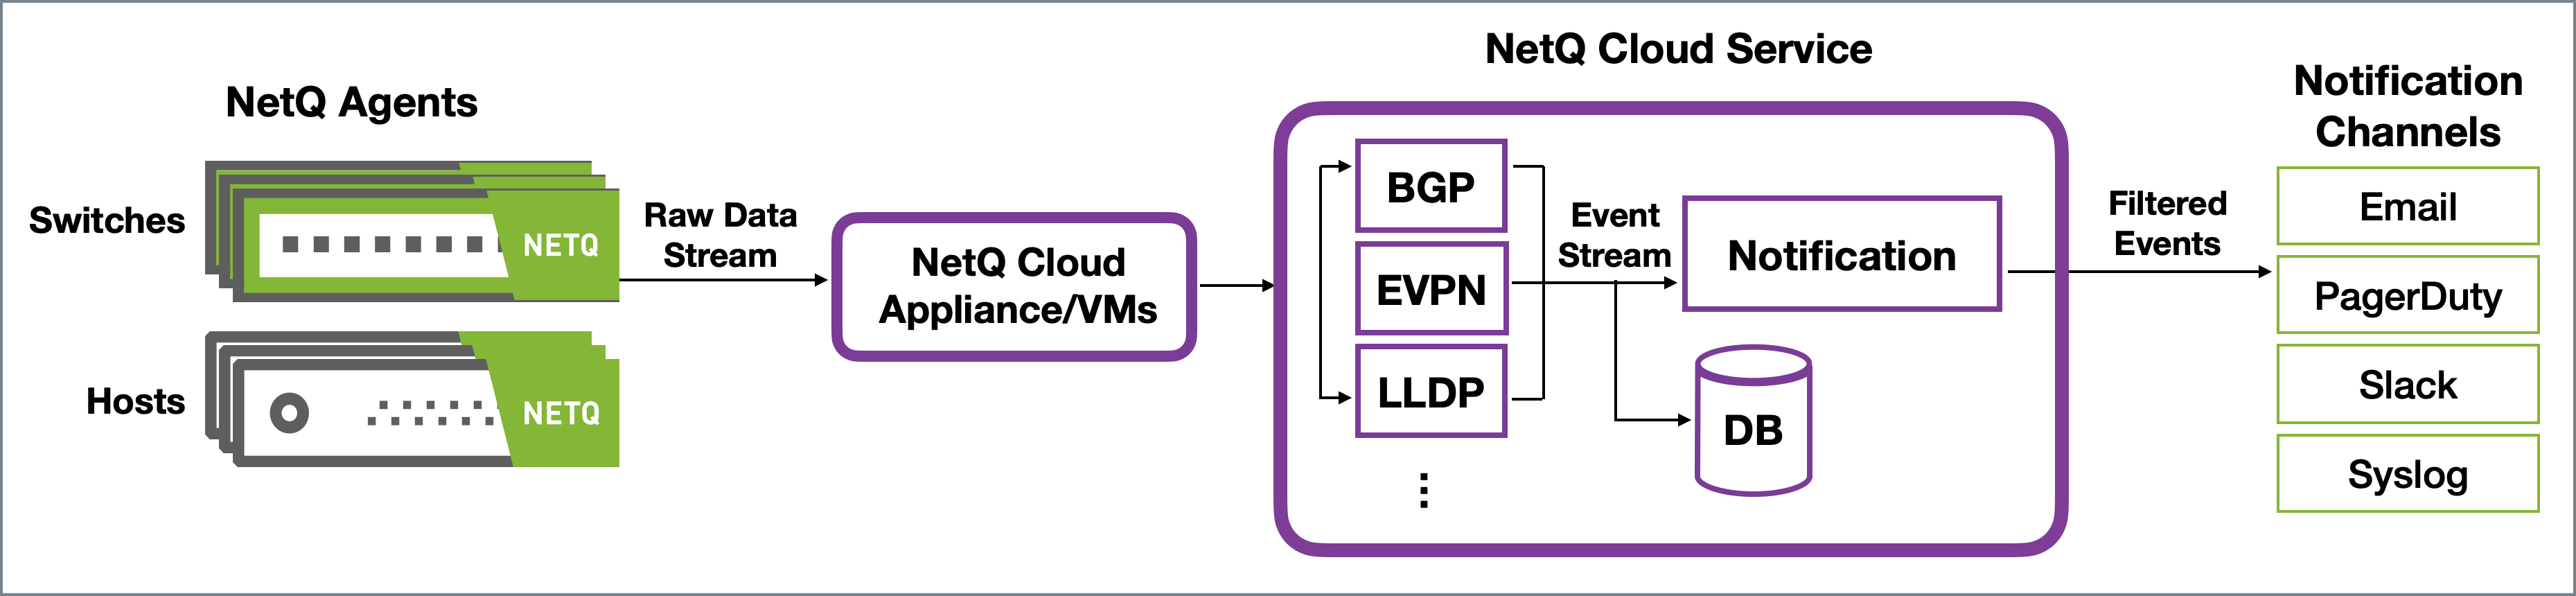
NetQ interfaces with event notification applications, third-party analytics tools.
Each of the NetQ components used to gather, store and process data about the network state are described here.
NetQ Agents
NetQ Agents are software installed and running on every monitored node in the network — including Cumulus® Linux® switches, Linux bare metal hosts, and virtual machines. The NetQ Agents push network data regularly and event information immediately to the NetQ Platform.
Switch Agents
The NetQ Agents running on Cumulus Linux or SONiC switches gather the following network data via Netlink:
Interfaces
IP addresses (v4 and v6)
IP routes (v4 and v6)
Links
Bridge FDB (MAC Address table)
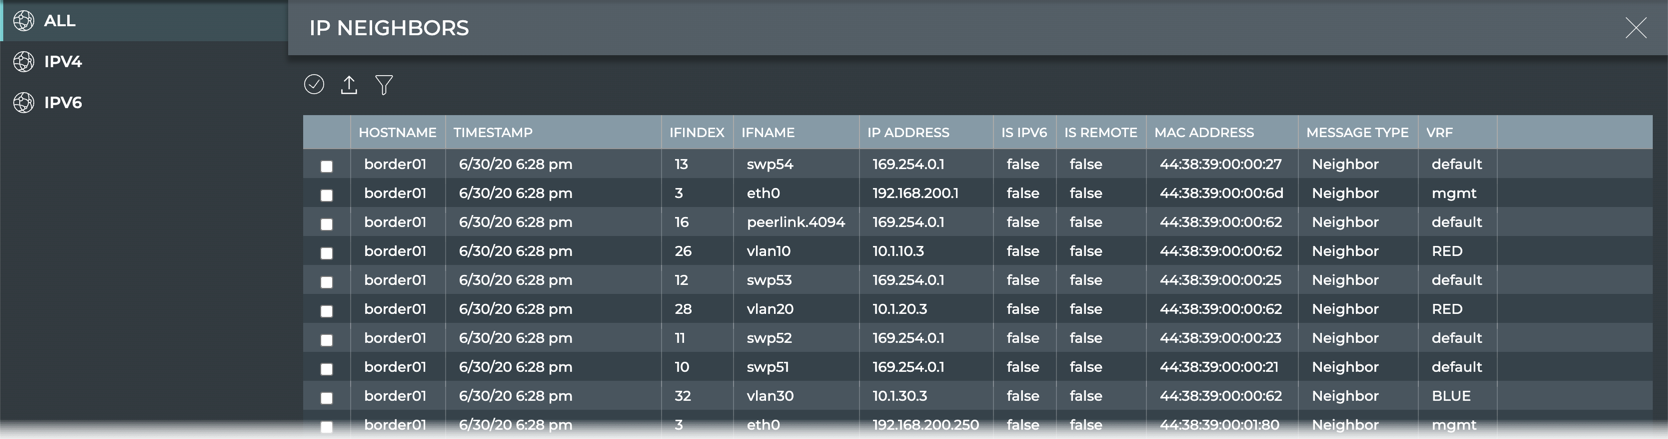
ARP Entries/Neighbors (IPv4 and IPv6)
for the following protocols:
Bridging protocols: LLDP, STP, MLAG
Routing protocols: BGP, OSPF
Network virtualization: EVPN, VXLAN
The NetQ Agent is supported on Cumulus Linux 3.3.2 and later and SONiC 202012 and later.
Host Agents
The NetQ Agents running on hosts gather the same information as that for switches, plus the following network data:
Network IP and MAC addresses
Container IP and MAC addresses
The NetQ Agent obtains container information by listening to the Kubernetes orchestration tool.
The NetQ Agent is supported on hosts running Ubuntu 16.04, Red Hat® Enterprise Linux 7, and CentOS 7 Operating Systems.
NetQ Core
The NetQ core performs the data collection, storage, and processing for delivery to various user interfaces. It is comprised of a collection of scalable components running entirely within a single server. The NetQ software queries this server, rather than individual devices enabling greater scalability of the system. Each of these components is described briefly here.
Data Aggregation
The data aggregation component collects data coming from all of the NetQ Agents. It then filters, compresses, and forwards the data to the streaming component. The server monitors for missing messages and also monitors the NetQ Agents themselves, providing alarms when appropriate. In addition to the telemetry data collected from the NetQ Agents, the aggregation component collects information from the switches and hosts, such as vendor, model, version, and basic operational state.
Data Stores
Two types of data stores are used in the NetQ product. The first stores the raw data, data aggregations, and discrete events needed for quick response to data requests. The second stores data based on correlations, transformations and processing of the raw data.
Real-time Streaming
The streaming component processes the incoming raw data from the aggregation server in real time. It reads the metrics and stores them as a time series, and triggers alarms based on anomaly detection, thresholds, and events.
Network Services
The network services component monitors protocols and services operation individually and on a networkwide basis and stores status details.
User Interfaces
NetQ data is available through several user interfaces:
NetQ CLI (command line interface)
NetQ UI (graphical user interface)
NetQ RESTful API (representational state transfer application programming interface)
The CLI and UI query the RESTful API for the data to present. Standard integrations can be configured to integrate with third-party notification tools.
Data Center Network Deployments
Three deployment types are commonly deployed for network management in the data center:
Out-of-Band Management (recommended)
In-band Management
High Availability
This topic provides a summary of each type.
NetQ operates over layer 3, and can operate in both layer 2 bridged and layer 3 routed environments. NVIDIA recommends a layer 3 routed environment whenever possible.
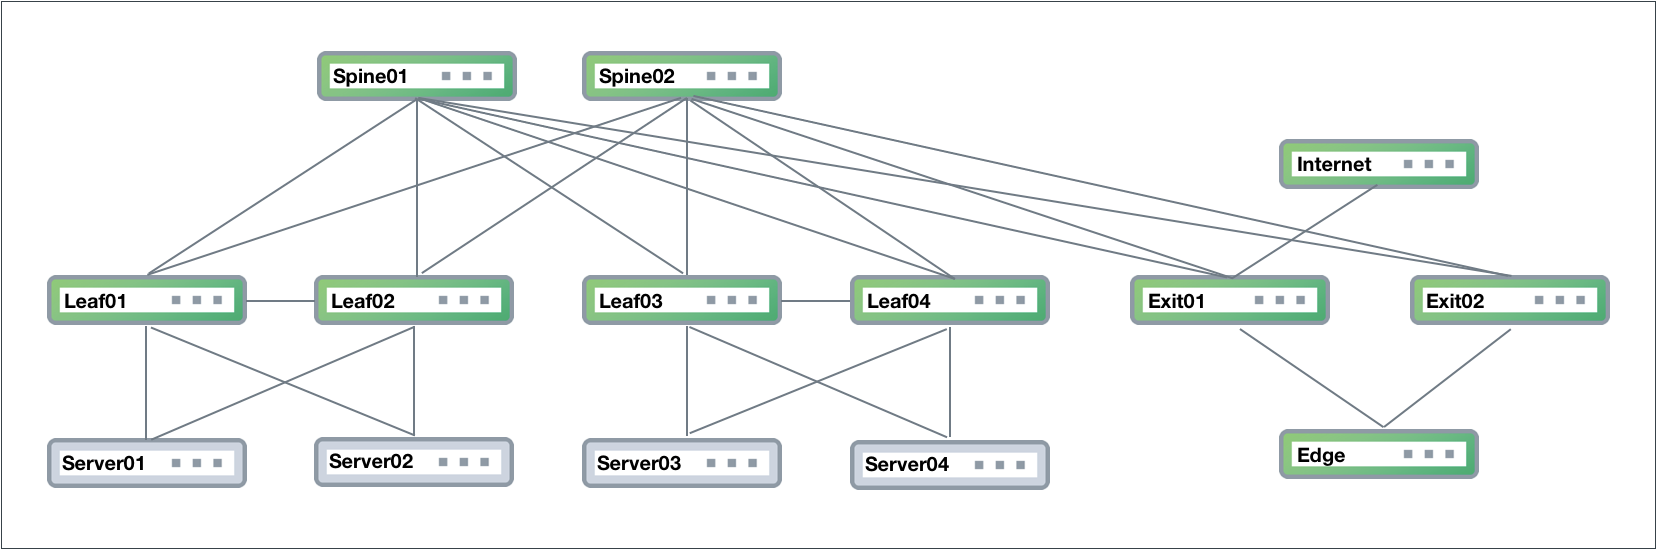
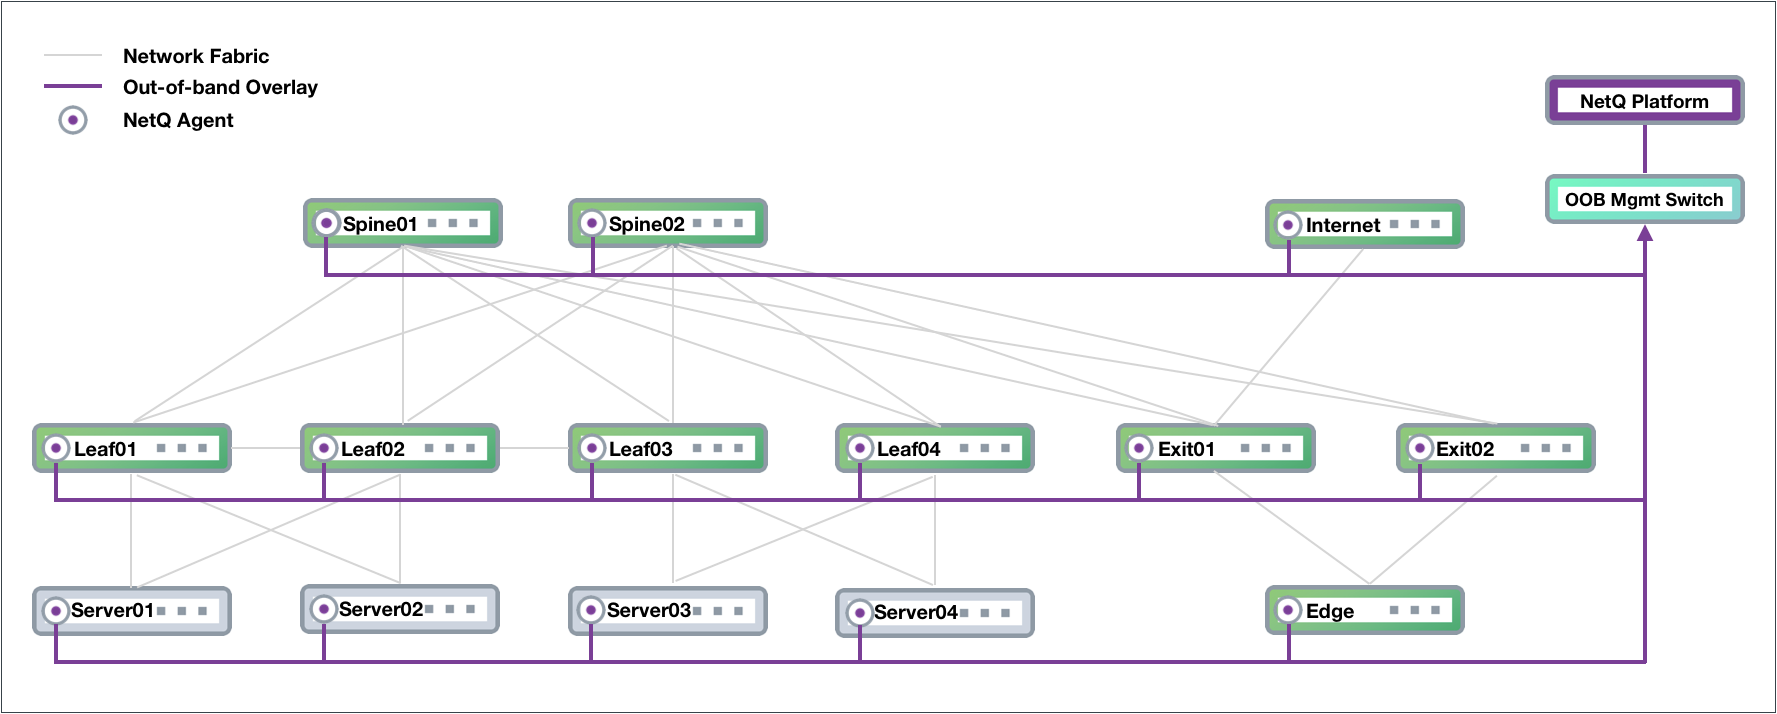
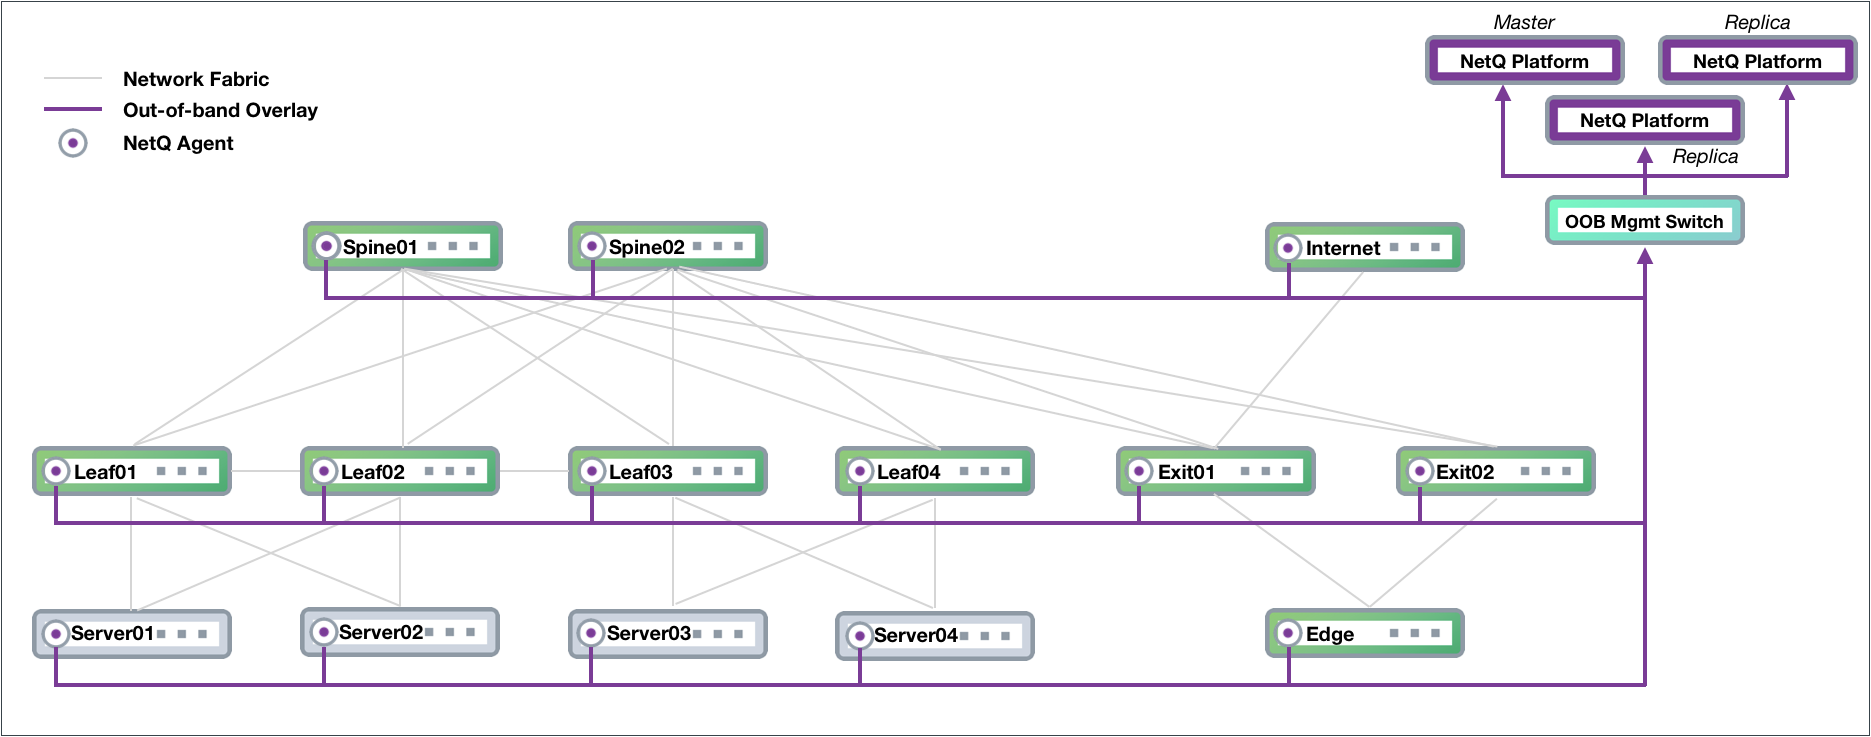
Out-of-band Management Deployment
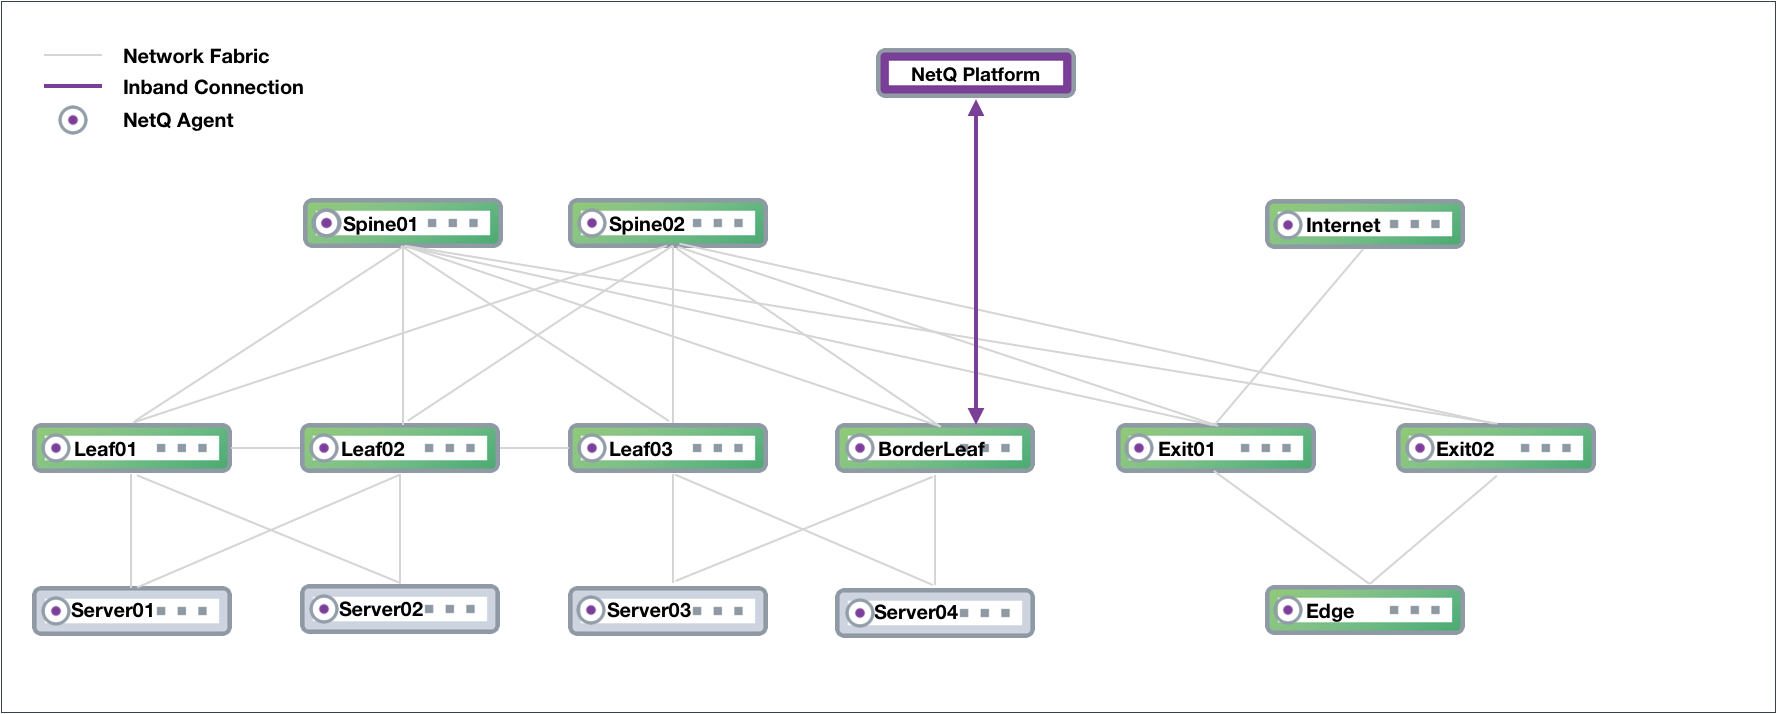
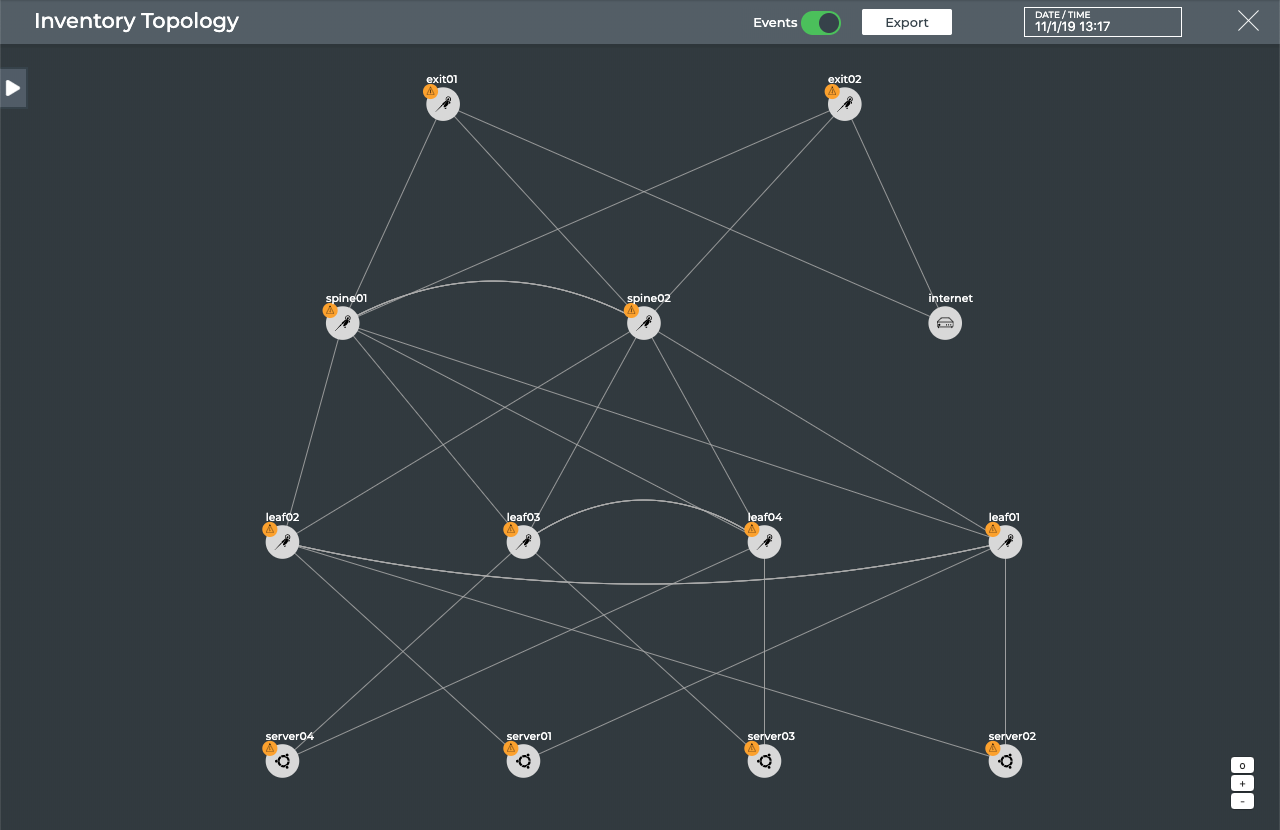
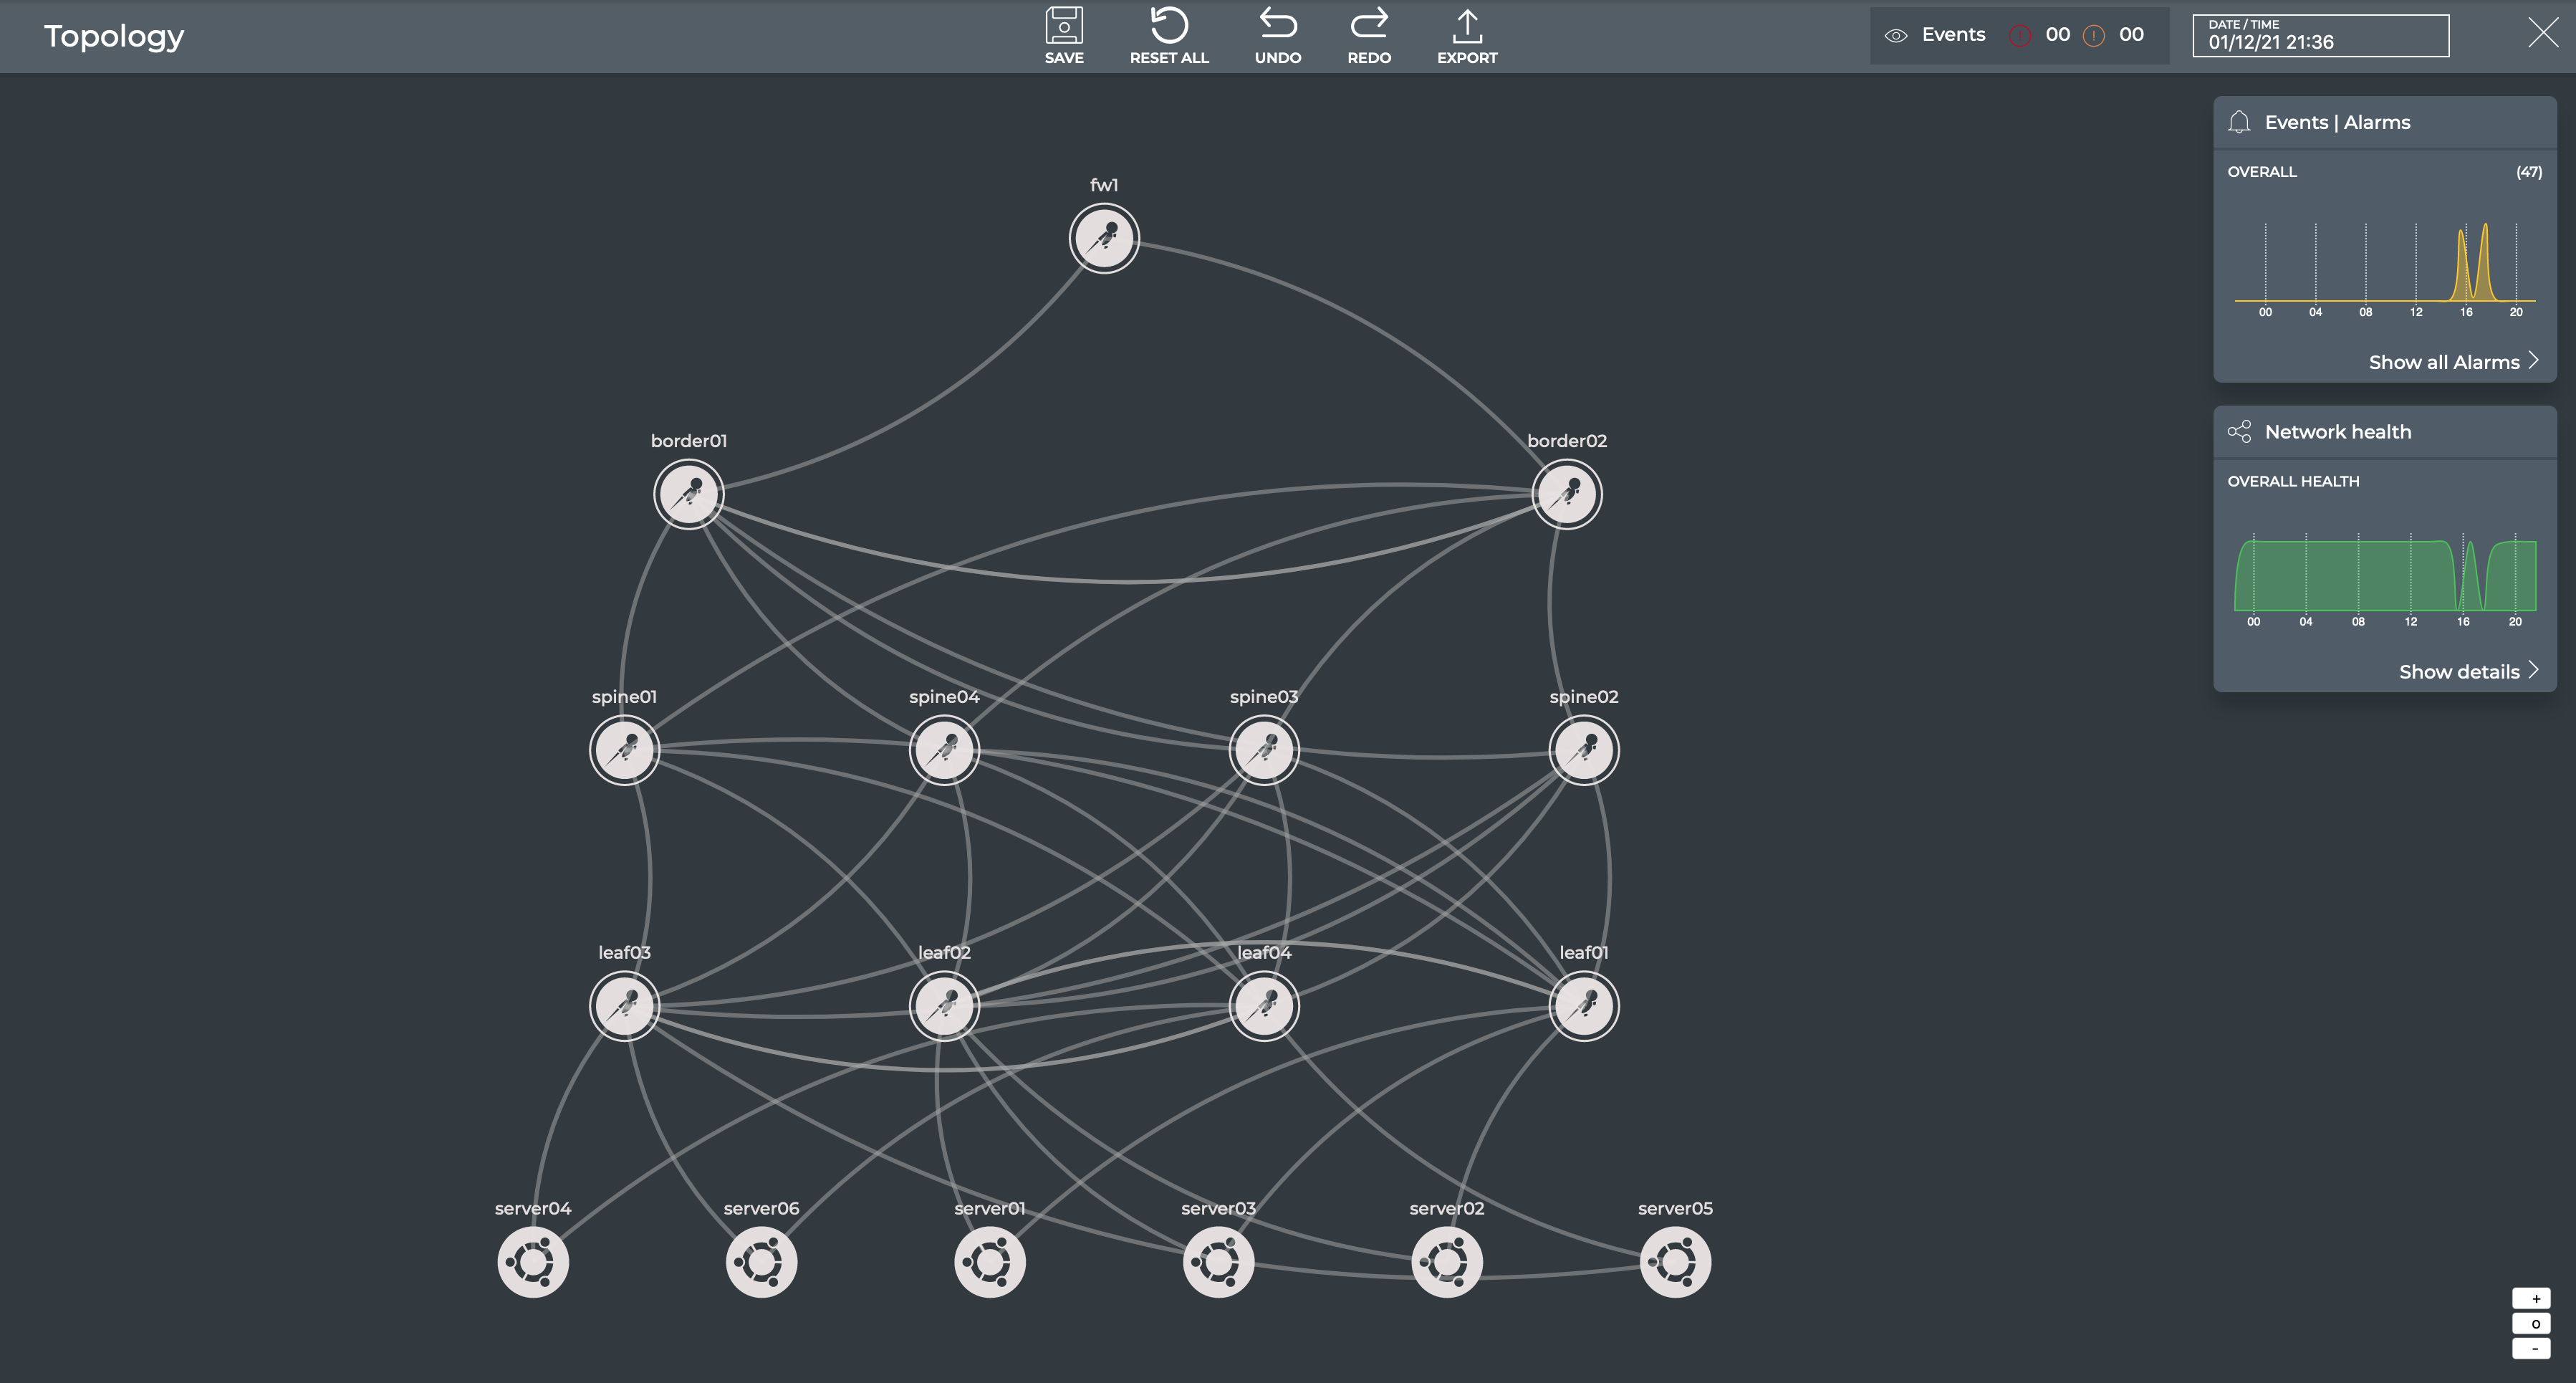
NVIDIA recommends deploying NetQ on an out-of-band (OOB) management network to separate network management traffic from standard network data traffic, but does not require it. This figure shows a sample Clos-based network fabric design for a data center using an OOB management network overlaid on top, where NetQ resides.
The physical network hardware includes:
Spine switches: aggregate and distribute data; also known as an aggregation switch, end-of-row (EOR) switch or distribution switch
Leaf switches: where servers connect to the network; also known as a Top of Rack (TOR) or access switch
Server hosts: host applications and data served to the user through the network
Exit switch: where connections to outside the data center occur; also known as Border Leaf or Service Leaf
Edge server (optional): where the firewall is the demarcation point, peering can occur through the exit switch layer to Internet (PE) devices
Internet device (PE): where provider edge (PE) equipment communicates at layer 3 with the network fabric
The diagram shows physical connections (in the form of grey lines) between Spine 01 and four Leaf devices and two Exit devices, and Spine 02 and the same four Leaf devices and two Exit devices. Leaf 01 and Leaf 02 connect to each other over a peerlink and act as an MLAG pair for Server 01 and Server 02. Leaf 03 and Leaf 04 connect to each other over a peerlink and act as an MLAG pair for Server 03 and Server 04. The Edge connects to both Exit devices, and the Internet node connects to Exit 01.
Data Center Network Example
The physical management hardware includes:
OOB Management Switch: aggregation switch that connects to all network devices through communications with the NetQ Agent on each node
NetQ Platform: hosts the telemetry software, database and user interfaces (refer to description above)
These switches connect to each physical network device through a virtual network overlay, shown with purple lines.
In-band Management Deployment
While not the preferred deployment method, you might choose to implement NetQ within your data network. In this scenario, there is no overlay and all traffic to and from the NetQ Agents and the NetQ Platform traverses the data paths along with your regular network traffic. The roles of the switches in the Clos network are the same, except that the NetQ Platform performs the aggregation function that the OOB management switch performed. If your network goes down, you might not have access to the NetQ Platform for troubleshooting.
High Availability Deployment
NetQ supports a high availability deployment for users who prefer a solution in which the collected data and processing provided by the NetQ Platform remains available through alternate equipment should the platform fail for any reason. In this configuration, three NetQ Platforms are deployed, with one as the master and two as workers (or replicas). Data from the NetQ Agents is sent to all three switches so that if the master NetQ Platform fails, one of the replicas automatically becomes the master and continues to store and provide the telemetry data. This example is based on an OOB management configuration, and modified to support high availability for NetQ.
NetQ Operation
In either in-band or out-of-band deployments, NetQ offers networkwide configuration and device management, proactive monitoring capabilities, and performance diagnostics for complete management of your network. Each component of the solution provides a critical element to make this possible.
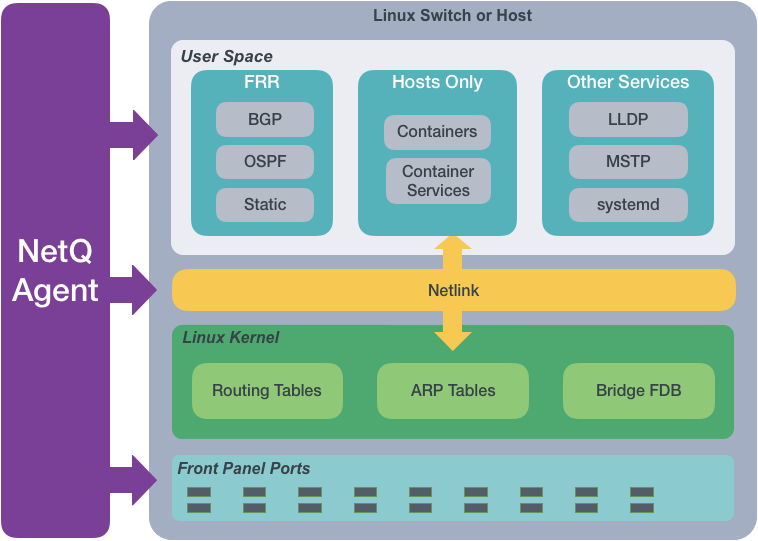
The NetQ Agent
From a software perspective, a network switch has software associated with the hardware platform, the operating system, and communications. For data centers, the software on a network switch is similar to the diagram shown here.
The NetQ Agent interacts with the various components and software on switches and hosts and provides the gathered information to the NetQ Platform. You can view the data using the NetQ CLI or UI.
The NetQ Agent polls the user space applications for information about the performance of the various routing protocols and services that are running on the switch. Cumulus Linux supports BGP and OSPF routing protocols as well as static addressing through FRRouting (FRR). Cumulus Linux also supports LLDP and MSTP among other protocols, and a variety of services such as systemd and sensors. SONiC supports BGP and LLDP.
For hosts, the NetQ Agent also polls for performance of containers managed with Kubernetes. All of this information is used to provide the current health of the network and verify it is configured and operating correctly.
For example, if the NetQ Agent learns that an interface has gone down, a new BGP neighbor has been configured, or a container has moved, it provides that information to the NetQ Platform. That information can then be used to notify users of the operational state change through various channels. By default, data is logged in the database, but you can use the CLI (netq show events) or configure the Event Service in NetQ to send the information to a third-party notification application as well. NetQ supports PagerDuty and Slack integrations.
The NetQ Agent interacts with the Netlink communications between the Linux kernel and the user space, listening for changes to the network state, configurations, routes and MAC addresses. NetQ uses this information to enable notifications about these changes so that network operators and administrators can respond quickly when changes are not expected or favorable.
For example, if a new route is added or a MAC address removed, NetQ Agent records these changes and sends that information to the NetQ Platform. Based on the configuration of the Event Service, these changes can be sent to a variety of locations for end user response.
The NetQ Agent also interacts with the hardware platform to obtain performance information about various physical components, such as fans and power supplies, on the switch. Operational states and temperatures are measured and reported, along with cabling information to enable management of the hardware and cabling, and proactive maintenance.
For example, as thermal sensors in the switch indicate that it is becoming very warm, various levels of alarms are generated. These are then communicated through notifications according to the Event Service configuration.
The NetQ Platform
Once the collected data is sent to and stored in the NetQ database, you can:
Validate configurations, identifying misconfigurations in your
current network, in the past, or prior to deployment,
Monitor communication paths throughout the network,
Notify users of issues and management information,
Anticipate impact of connectivity changes,
and so forth.
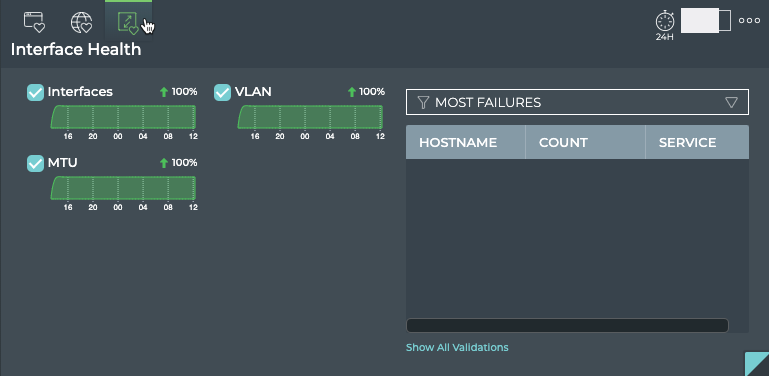
Validate Configurations
The NetQ CLI enables validation of your network health through two sets of commands: netq check and netq show. They extract the information from the Network Service component and Event service. The Network Service component is continually validating the connectivity and configuration of the devices and protocols running on the network. Using the netq check and netq show commands displays the status of the various components and services on a networkwide and complete software stack basis. For example, you can perform a networkwide check on all sessions of BGP with a single netq check bgp command. The command lists any devices that have misconfigurations or other operational errors in seconds. When errors or misconfigurations are present, using the netq show bgp command displays the BGP configuration on each device so that you can compare and contrast each device, looking for potential causes. netq check and netq show commands are available for numerous components and services as shown in the following table.
Component or Service
Check
Show
Component or Service
Check
Show
Agents
X
X
LLDP
X
BGP
X
X
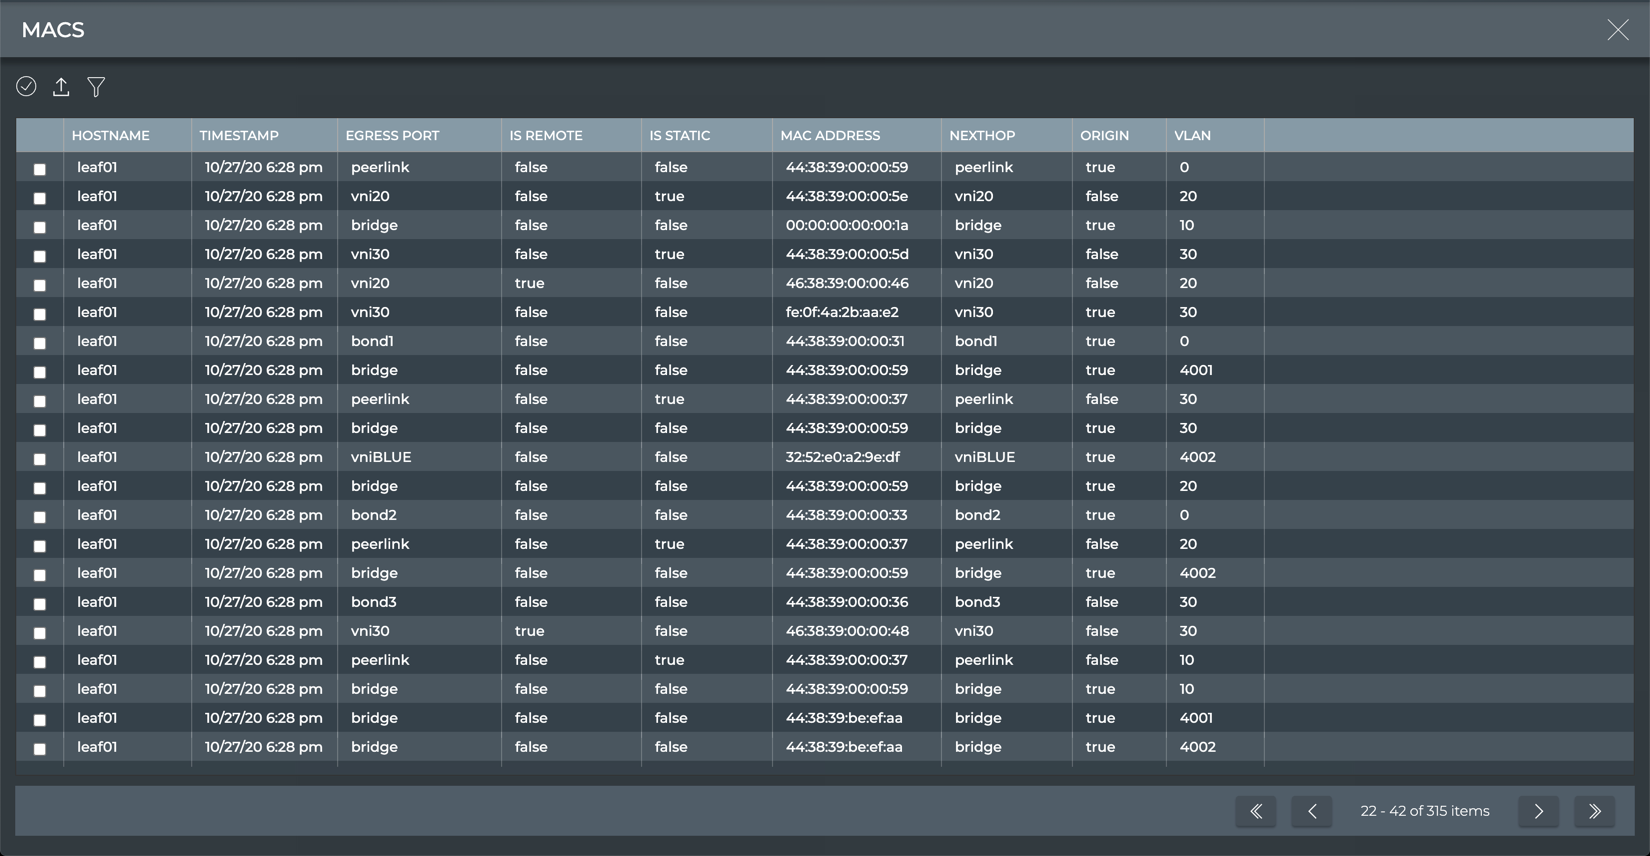
MACs
X
CLAG (MLAG)
X
X
MTU
X
Events
X
NTP
X
X
EVPN
X
X
OSPF
X
X
Interfaces
X
X
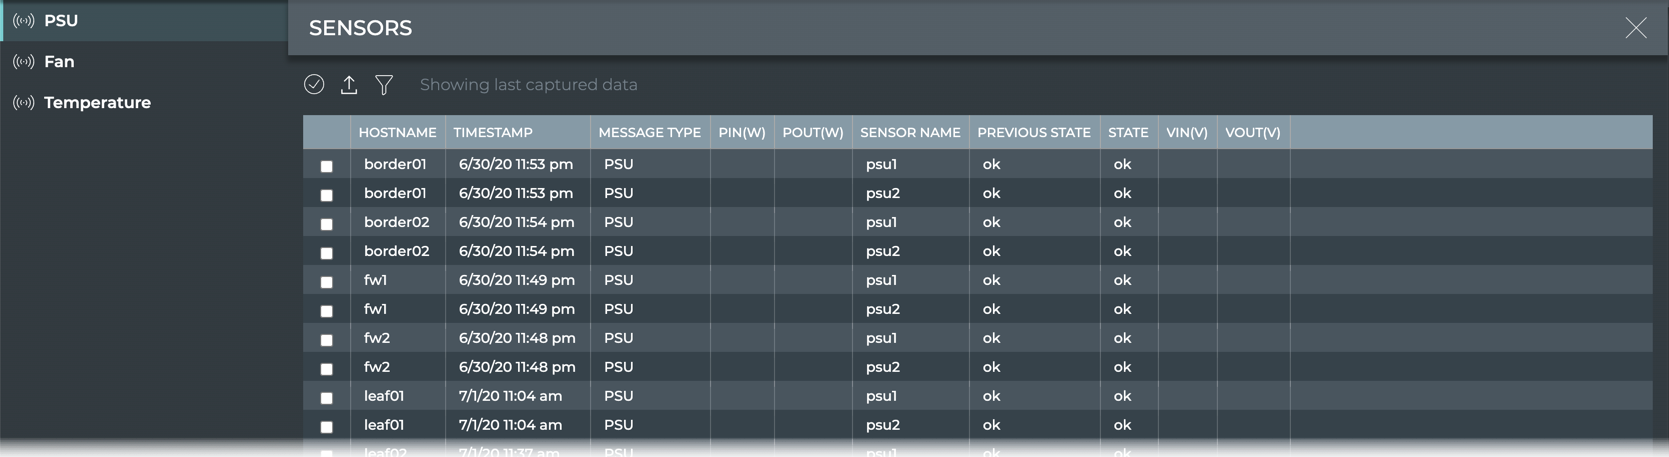
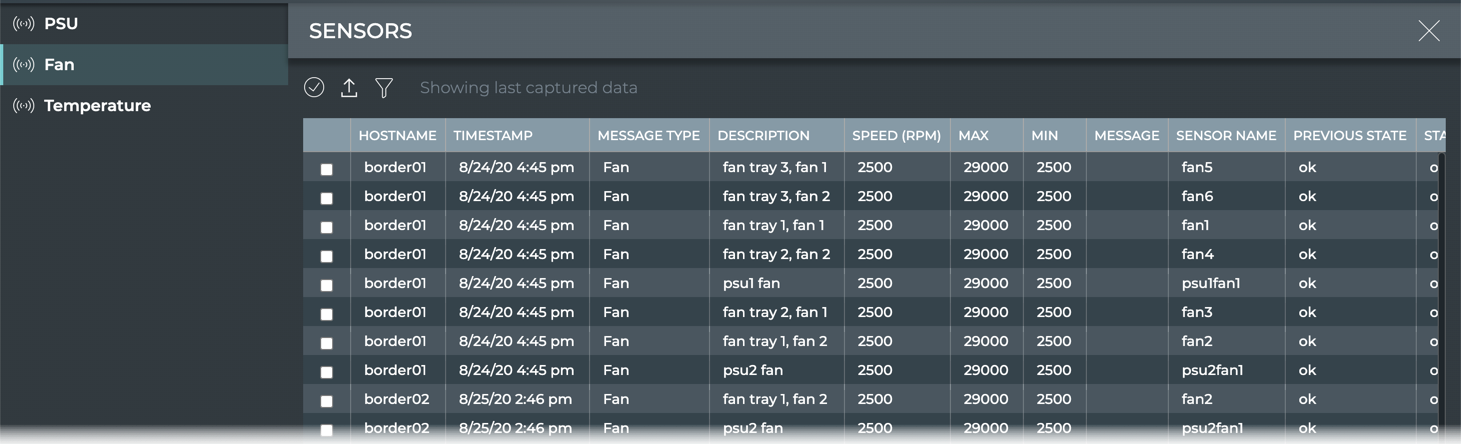
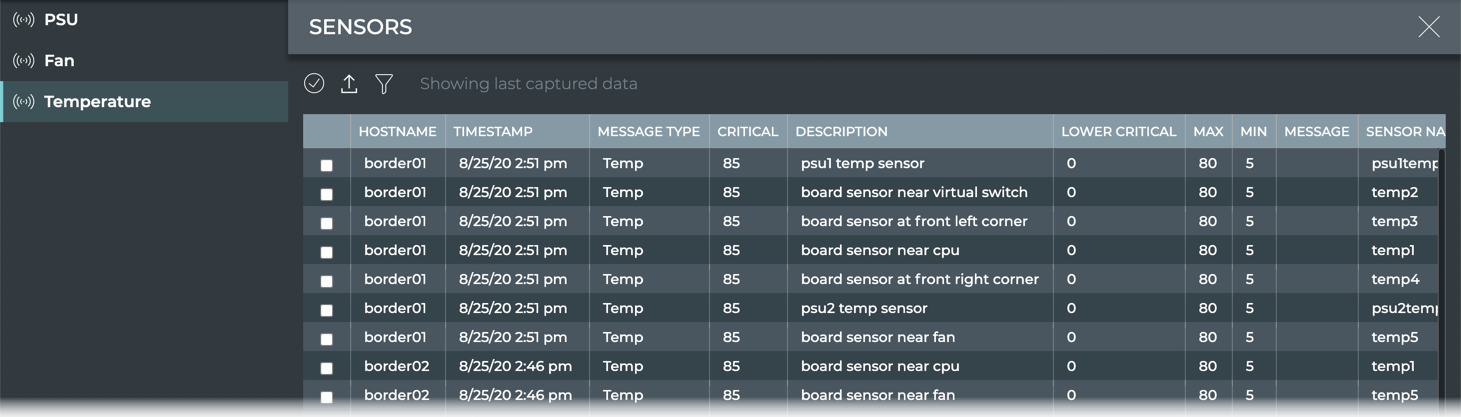
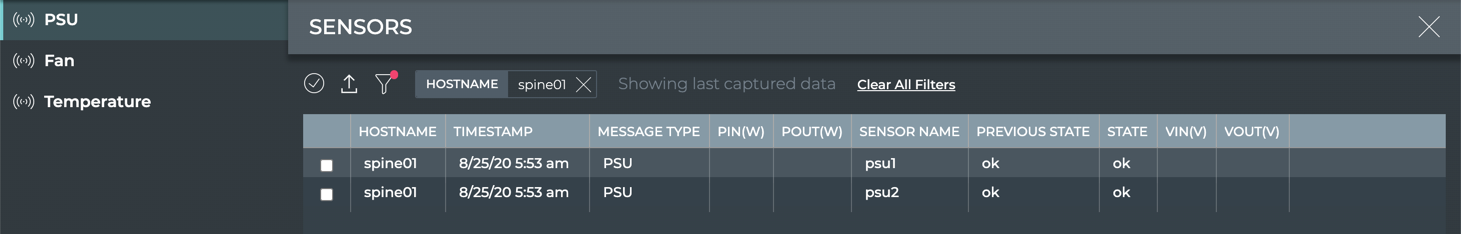
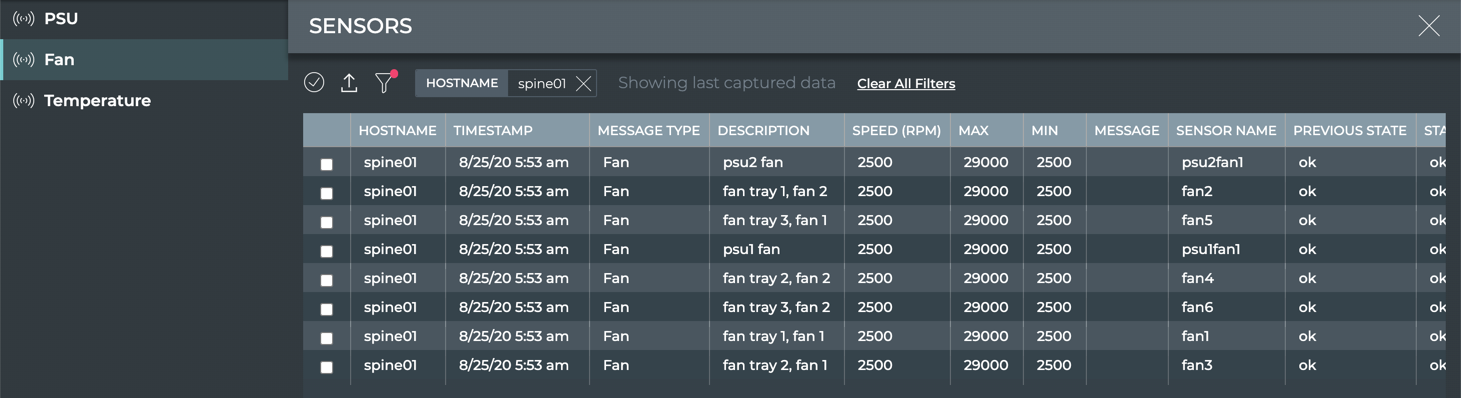
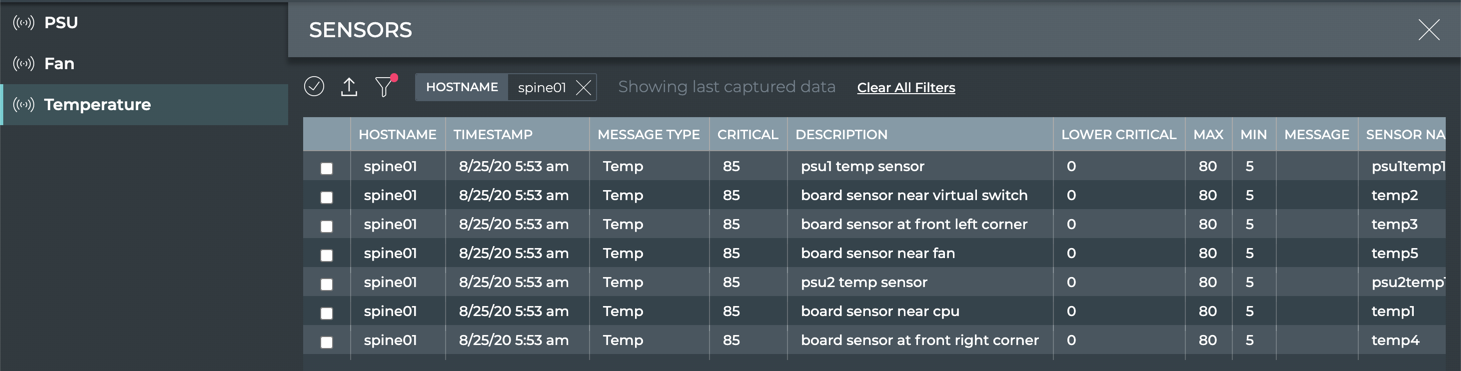
Sensors
X
X
Inventory
X
Services
X
IPv4/v6
X
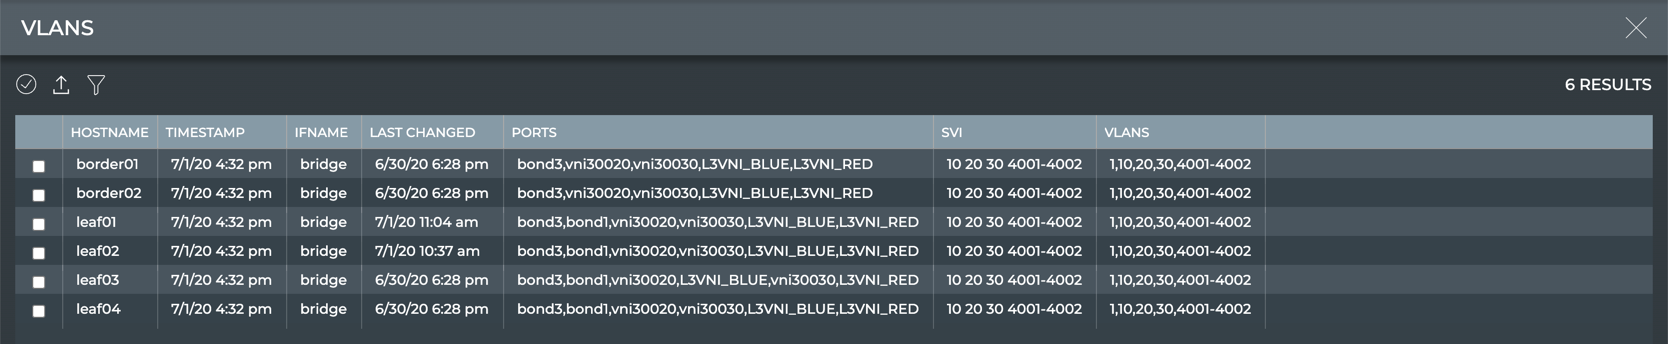
VLAN
X
X
Kubernetes
X
VXLAN
X
X
Monitor Communication Paths
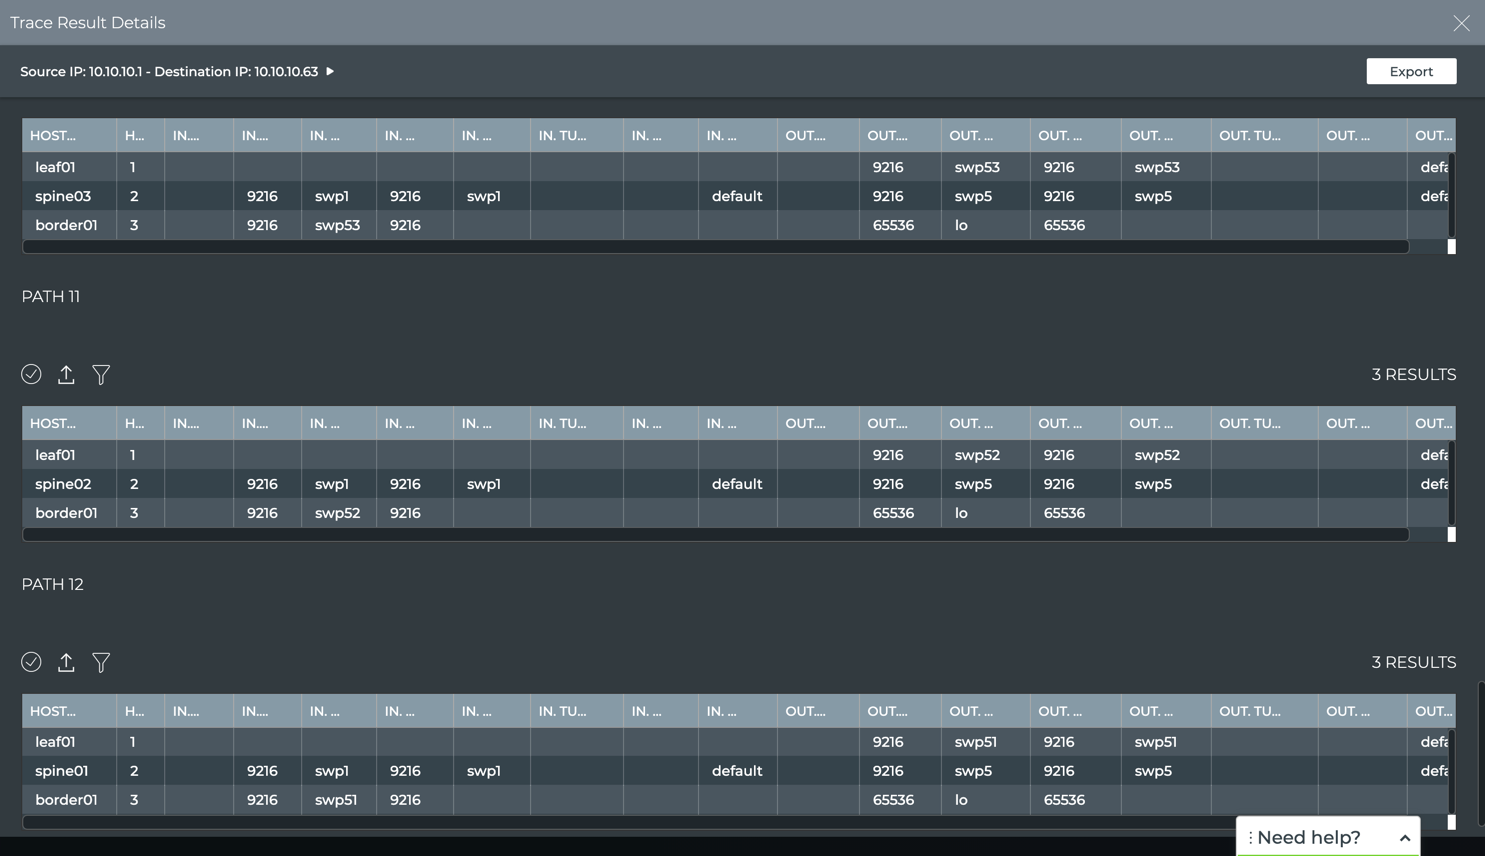
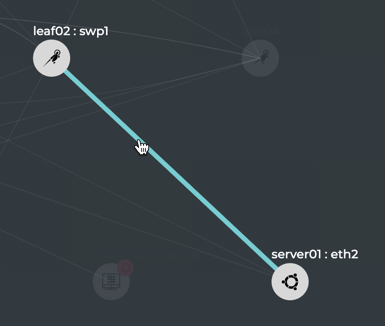
The trace engine validates the available communication paths between two network devices. The corresponding netq trace command enables you to view all of the paths between the two devices and if there are any breaks in the paths. This example shows two successful paths between server12 and leaf11, all with an MTU of 9152. The first command shows the output in path by path tabular mode. The second command shows the same output as a tree.
cumulus@switch:~$ netq trace 10.0.0.13 from 10.0.0.21
Number of Paths: 2
Number of Paths with Errors: 0
Number of Paths with Warnings: 0
Path MTU: 9152
Id  Hop Hostname    InPort          InTun, RtrIf    OutRtrIf, Tun   OutPort
--- --- ----------- --------------- --------------- --------------- ---------------
1   1   server12                                                    bond1.1002
    2   leaf12      swp8                            vlan1002        peerlink-1
    3   leaf11      swp6            vlan1002                        vlan1002
--- --- ----------- --------------- --------------- --------------- ---------------
2   1   server12                                                    bond1.1002
    2   leaf11      swp8                                            vlan1002
--- --- ----------- --------------- --------------- --------------- ---------------


cumulus@switch:~$ netq trace 10.0.0.13 from 10.0.0.21 pretty
Number of Paths: 2
Number of Paths with Errors: 0
Number of Paths with Warnings: 0
Path MTU: 9152
 hostd-12 bond1.1002 -- swp8 leaf12 <vlan1002> peerlink-1 -- swp6 <vlan1002> leaf11 vlan1002
          bond1.1002 -- swp8 leaf11 vlan1002
To better understand the output in greater detail:
Path 1 traverses the network from server12 out bond1.1002 into leaf12 interface swp8 out VLAN1002 peerlink-1 into VLAN1002 interface swp6 on leaf11
Path 2 traverses the network from server12 out bond1.1002 into VLAN1002 interface swp8 on leaf11
If the MTU does not match across the network, or any of the paths or parts of the paths have issues, that data appears in the summary at the top of the output and shown in red along the paths, giving you a starting point for troubleshooting.
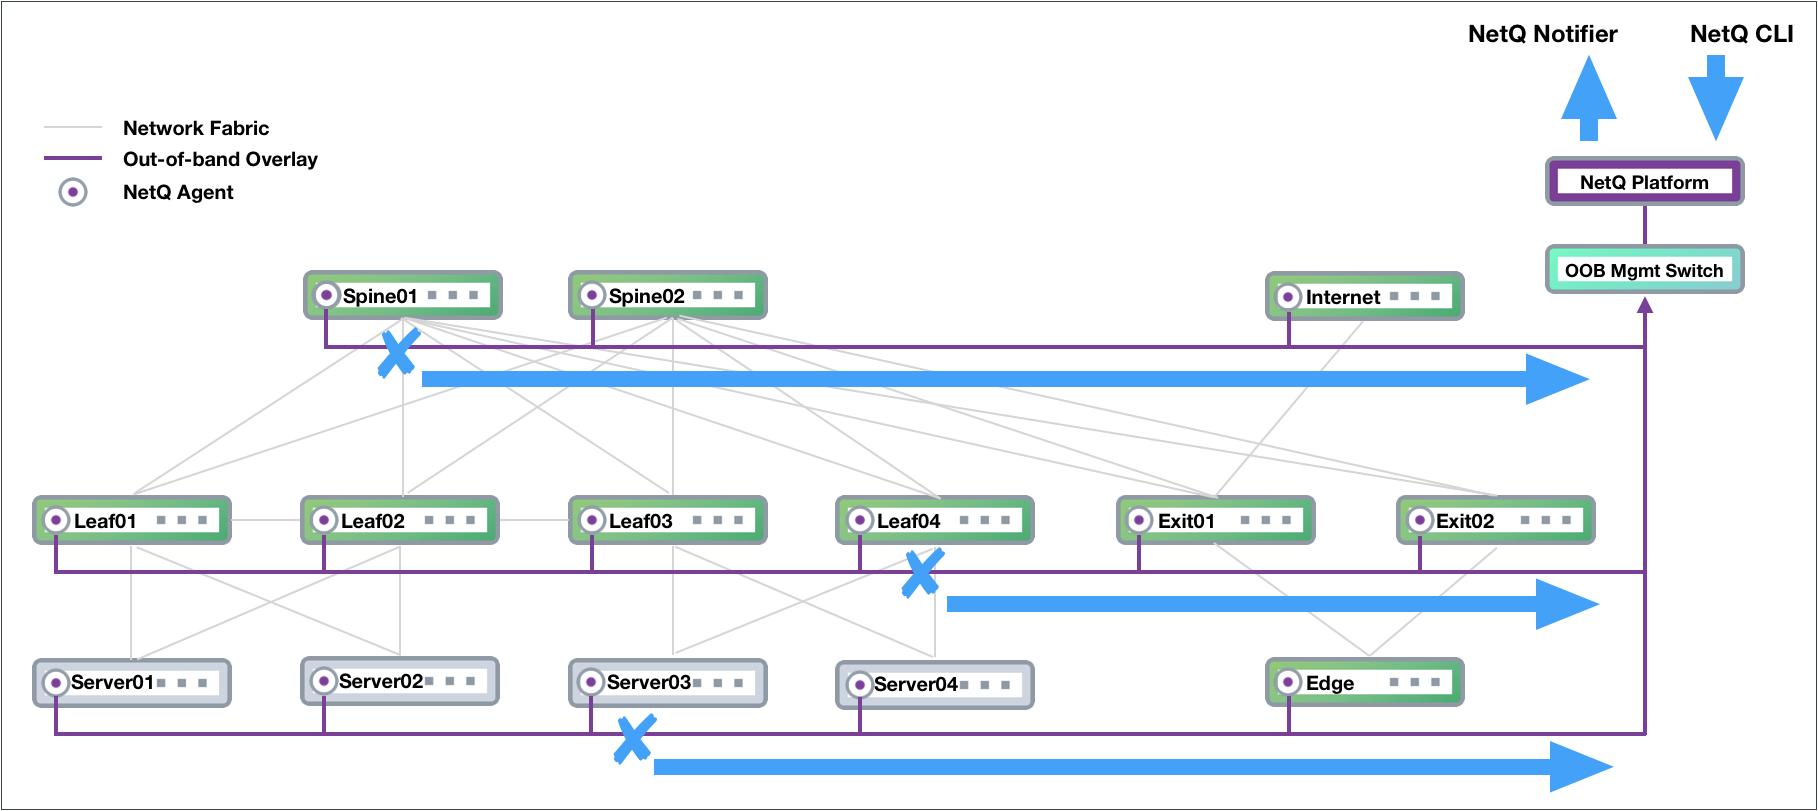
View Historical State and Configuration
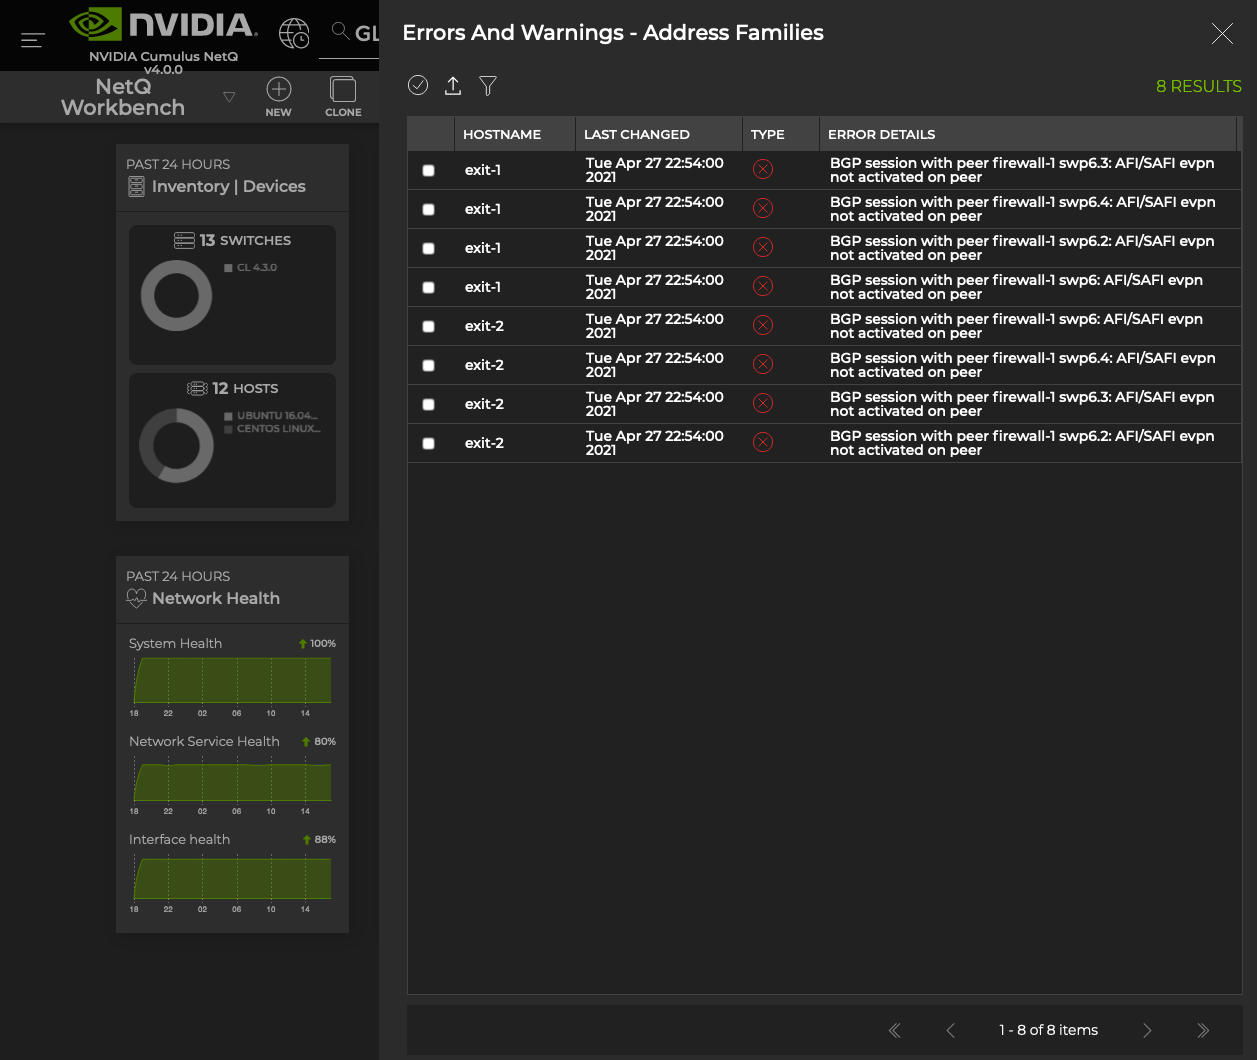
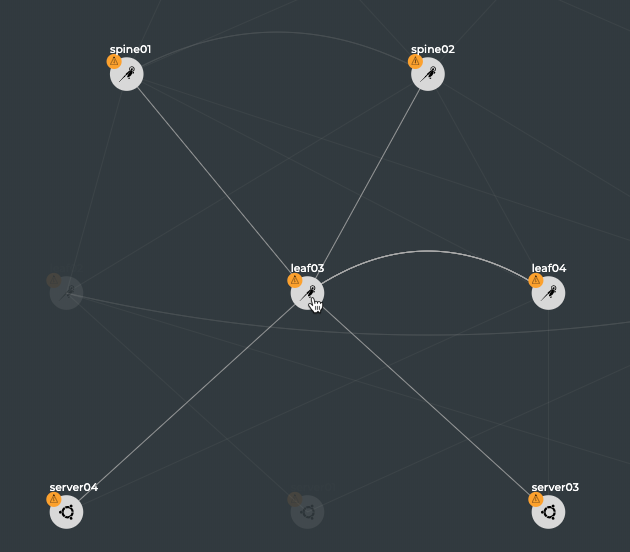
You can run all check, show and trace commands for the current status and for a prior point in time. For example, this is useful when you receive messages from the night before, but are not seeing any problems now. You can use the netq check command to look for configuration or operational issues around the time that NetQ timestamped the messages. Then use the netq show commands to see information about the configuration at that time of the device in question or if there were any changes in a given timeframe. Optionally, you can use the netq trace command to see what the connectivity looked like between any problematic nodes at that time. This example shows problems occurred on spine01, leaf04, and server03 last night. The network administrator received notifications and wants to investigate. Below the diagram are the commands to run to determine the cause of a BGP error on spine01. Note that the commands use the around option to see the results for last night and that you can run them from any switch in the network.
cumulus@switch:~$ netq check bgp around 30m
Total Nodes: 25, Failed Nodes: 3, Total Sessions: 220 , Failed Sessions: 24,
Hostname          VRF             Peer Name         Peer Hostname     Reason                                        Last Changed
----------------- --------------- ----------------- ----------------- --------------------------------------------- -------------------------
exit-1            DataVrf1080     swp6.2            firewall-1        BGP session with peer firewall-1 swp6.2: AFI/ 1d:2h:6m:21s
                                                                      SAFI evpn not activated on peer
exit-1            DataVrf1080     swp7.2            firewall-2        BGP session with peer firewall-2 (swp7.2 vrf  1d:1h:59m:43s
                                                                      DataVrf1080) failed,
                                                                      reason: Peer not configured
exit-1            DataVrf1081     swp6.3            firewall-1        BGP session with peer firewall-1 swp6.3: AFI/ 1d:2h:6m:21s
                                                                      SAFI evpn not activated on peer
exit-1            DataVrf1081     swp7.3            firewall-2        BGP session with peer firewall-2 (swp7.3 vrf  1d:1h:59m:43s
                                                                      DataVrf1081) failed,
                                                                      reason: Peer not configured
exit-1            DataVrf1082     swp6.4            firewall-1        BGP session with peer firewall-1 swp6.4: AFI/ 1d:2h:6m:21s
                                                                      SAFI evpn not activated on peer
exit-1            DataVrf1082     swp7.4            firewall-2        BGP session with peer firewall-2 (swp7.4 vrf  1d:1h:59m:43s
                                                                      DataVrf1082) failed,
                                                                      reason: Peer not configured
exit-1            default         swp6              firewall-1        BGP session with peer firewall-1 swp6: AFI/SA 1d:2h:6m:21s
                                                                      FI evpn not activated on peer
exit-1            default         swp7              firewall-2        BGP session with peer firewall-2 (swp7 vrf de 1d:1h:59m:43s
...

cumulus@switch:~$ netq exit-1 show bgp
Matching bgp records:
Hostname          Neighbor                     VRF             ASN        Peer ASN   PfxRx        Last Changed
----------------- ---------------------------- --------------- ---------- ---------- ------------ -------------------------
exit-1            swp3(spine-1)                default         655537     655435     27/24/412    Fri Feb 15 17:20:00 2019
exit-1            swp3.2(spine-1)              DataVrf1080     655537     655435     14/12/0      Fri Feb 15 17:20:00 2019
exit-1            swp3.3(spine-1)              DataVrf1081     655537     655435     14/12/0      Fri Feb 15 17:20:00 2019
exit-1            swp3.4(spine-1)              DataVrf1082     655537     655435     14/12/0      Fri Feb 15 17:20:00 2019
exit-1            swp4(spine-2)                default         655537     655435     27/24/412    Fri Feb 15 17:20:00 2019
exit-1            swp4.2(spine-2)              DataVrf1080     655537     655435     14/12/0      Fri Feb 15 17:20:00 2019
exit-1            swp4.3(spine-2)              DataVrf1081     655537     655435     14/12/0      Fri Feb 15 17:20:00 2019
exit-1            swp4.4(spine-2)              DataVrf1082     655537     655435     13/12/0      Fri Feb 15 17:20:00 2019
exit-1            swp5(spine-3)                default         655537     655435     28/24/412    Fri Feb 15 17:20:00 2019
exit-1            swp5.2(spine-3)              DataVrf1080     655537     655435     14/12/0      Fri Feb 15 17:20:00 2019
exit-1            swp5.3(spine-3)              DataVrf1081     655537     655435     14/12/0      Fri Feb 15 17:20:00 2019
exit-1            swp5.4(spine-3)              DataVrf1082     655537     655435     14/12/0      Fri Feb 15 17:20:00 2019
exit-1            swp6(firewall-1)             default         655537     655539     73/69/-      Fri Feb 15 17:22:10 2019
exit-1            swp6.2(firewall-1)           DataVrf1080     655537     655539     73/69/-      Fri Feb 15 17:22:10 2019
exit-1            swp6.3(firewall-1)           DataVrf1081     655537     655539     73/69/-      Fri Feb 15 17:22:10 2019
exit-1            swp6.4(firewall-1)           DataVrf1082     655537     655539     73/69/-      Fri Feb 15 17:22:10 2019
exit-1            swp7                         default         655537     -          NotEstd      Fri Feb 15 17:28:48 2019
exit-1            swp7.2                       DataVrf1080     655537     -          NotEstd      Fri Feb 15 17:28:48 2019
exit-1            swp7.3                       DataVrf1081     655537     -          NotEstd      Fri Feb 15 17:28:48 2019
exit-1            swp7.4                       DataVrf1082     655537     -          NotEstd      Fri Feb 15 17:28:48 2019
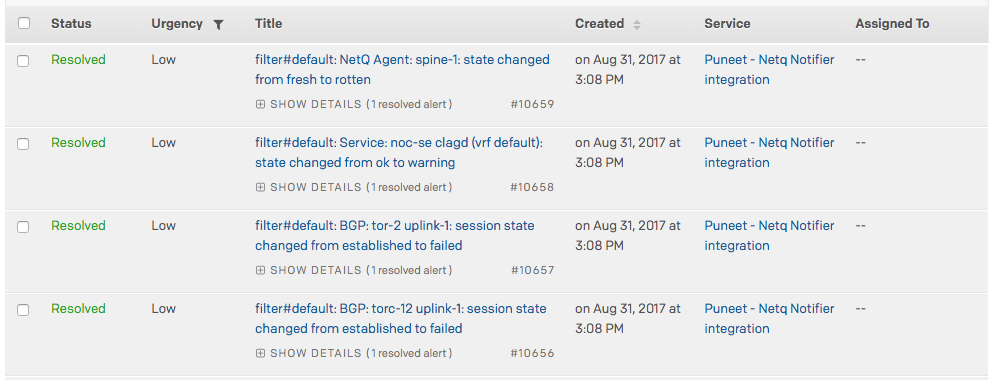
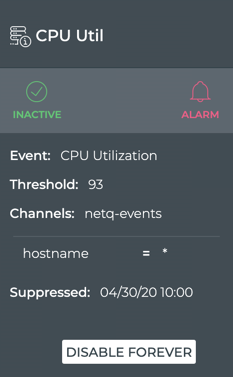
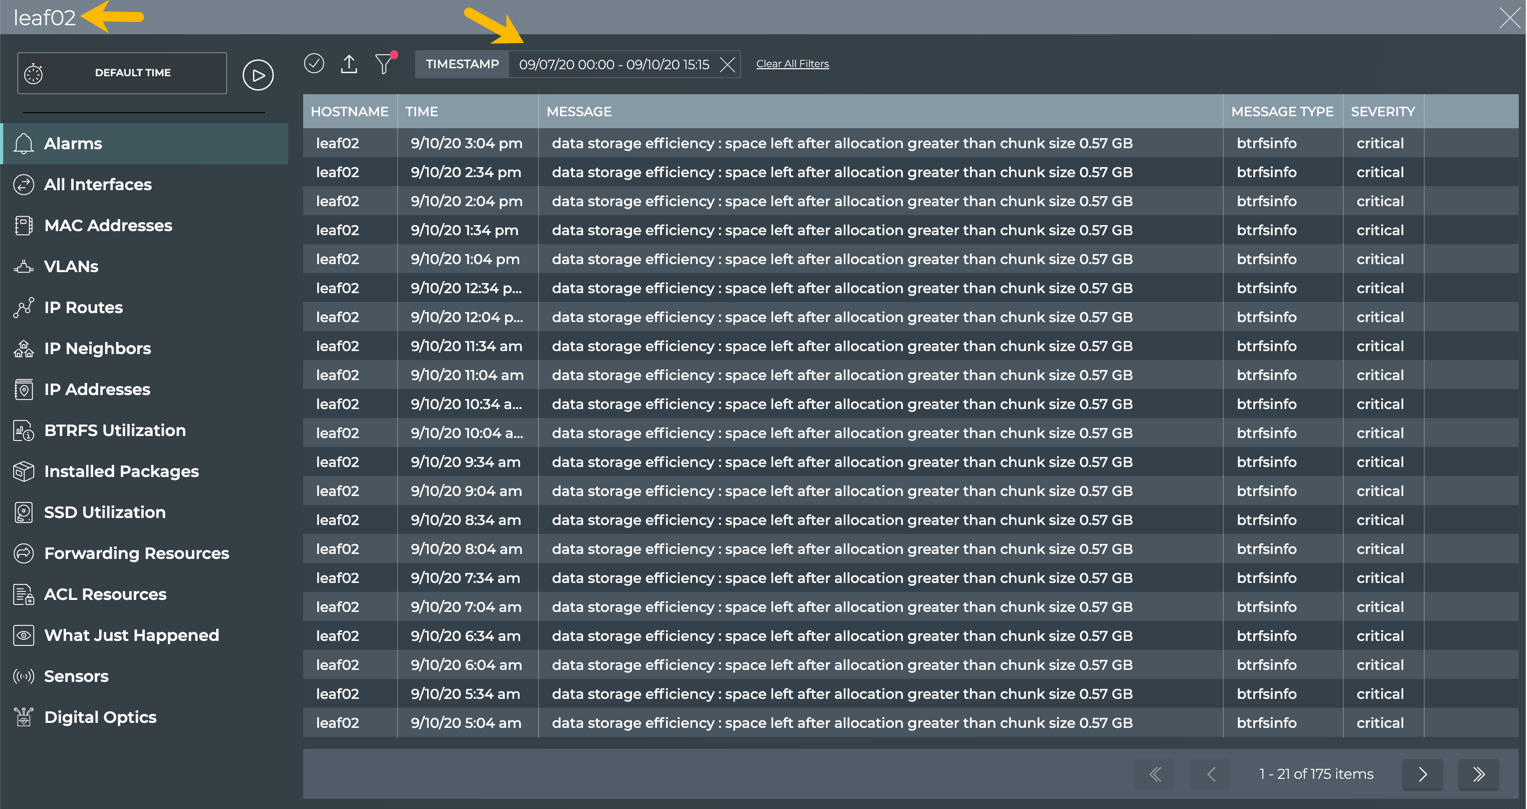
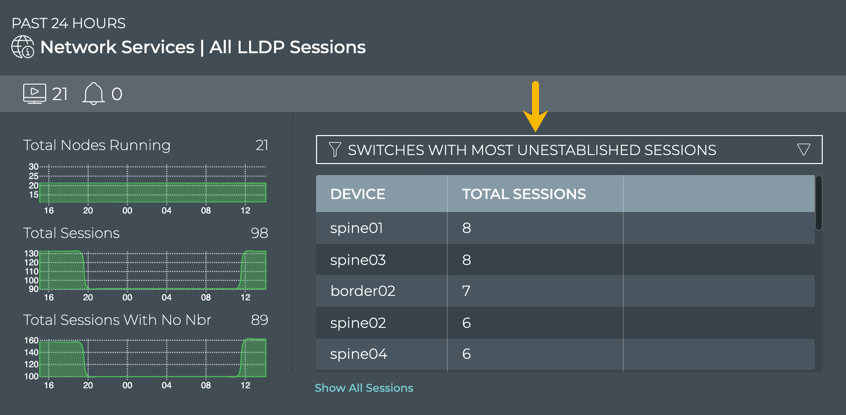
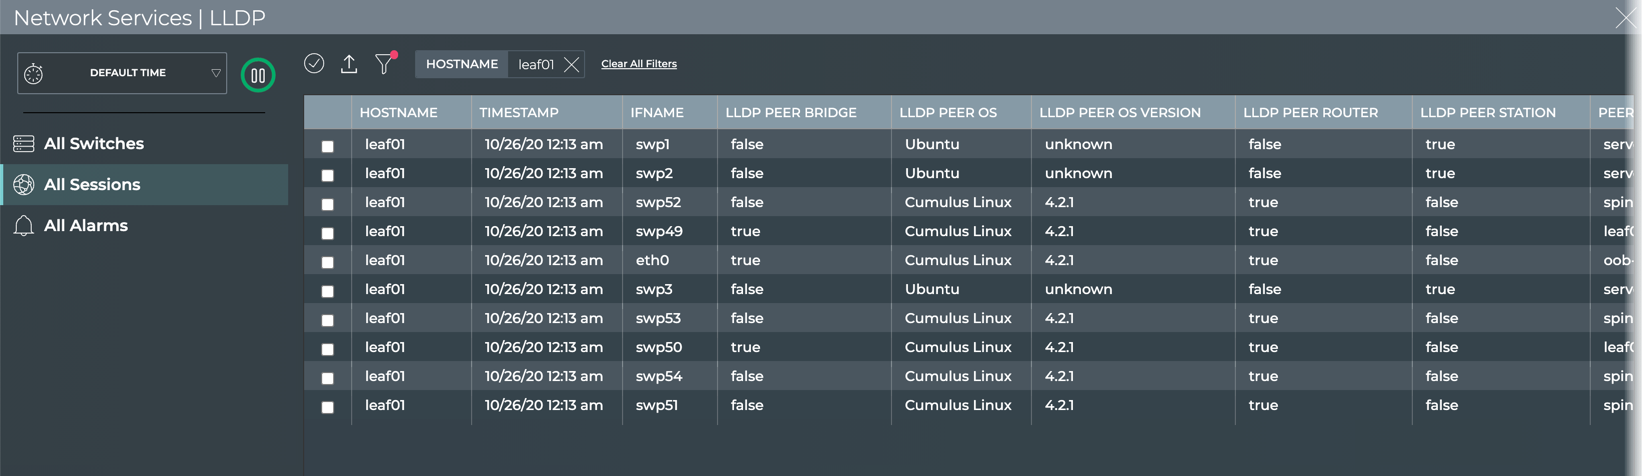
Manage Network Events
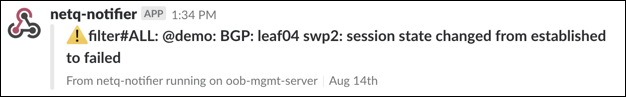
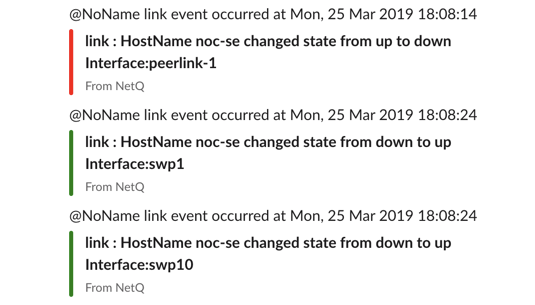
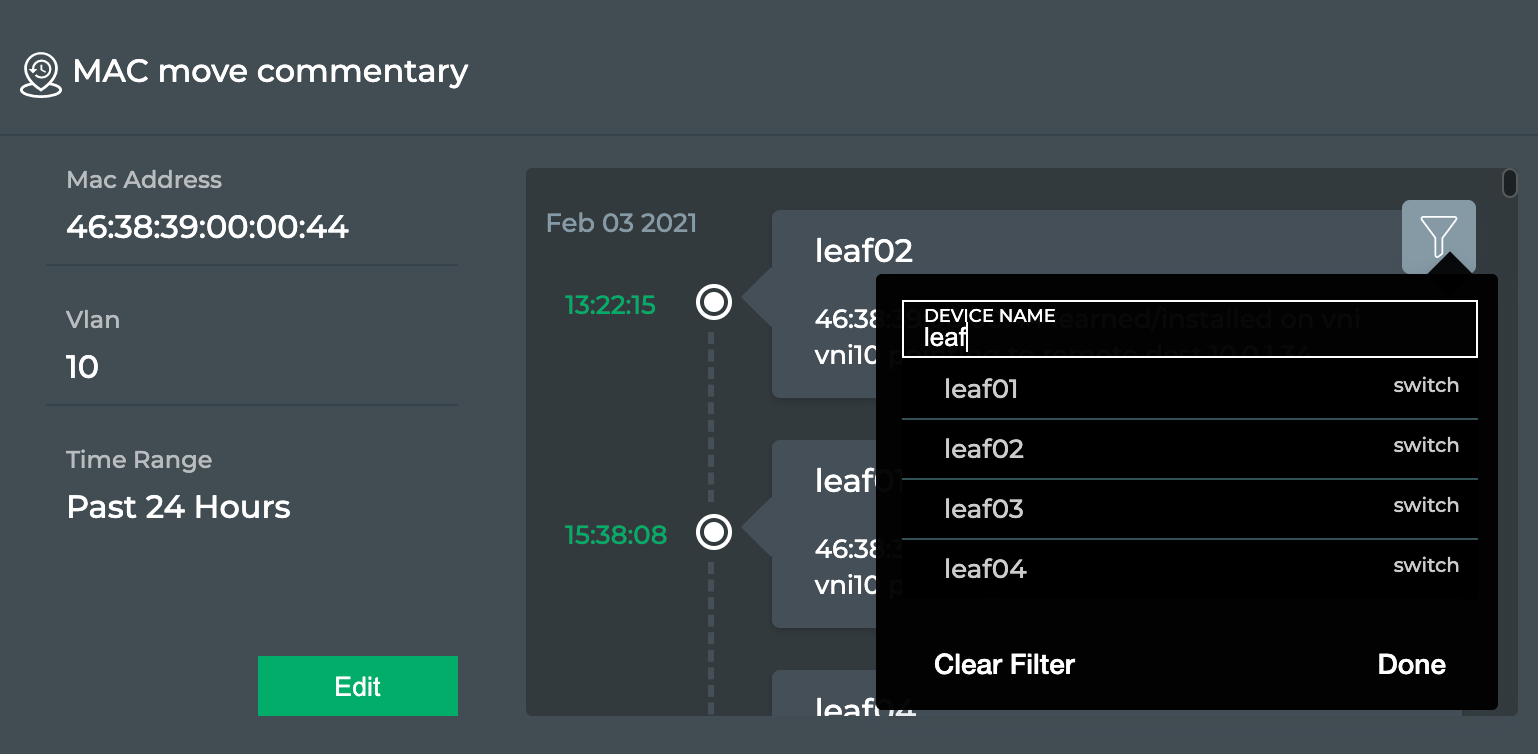
The NetQ notifier manages the events that occur for the devices and components, protocols and services that it receives from the NetQ Agents. The notifier enables you to capture and filter events that occur to manage the behavior of your network. This is especially useful when an interface or routing protocol goes down and you want to get them back up and running as quickly as possible, preferably before anyone notices or complains. You can improve resolution time significantly by creating filters that focus on topics appropriate for a particular group of users. You can easily create filters around events related to BGP and MLAG session states, interfaces, links, NTP and other services, fans, power supplies, and physical sensor measurements.
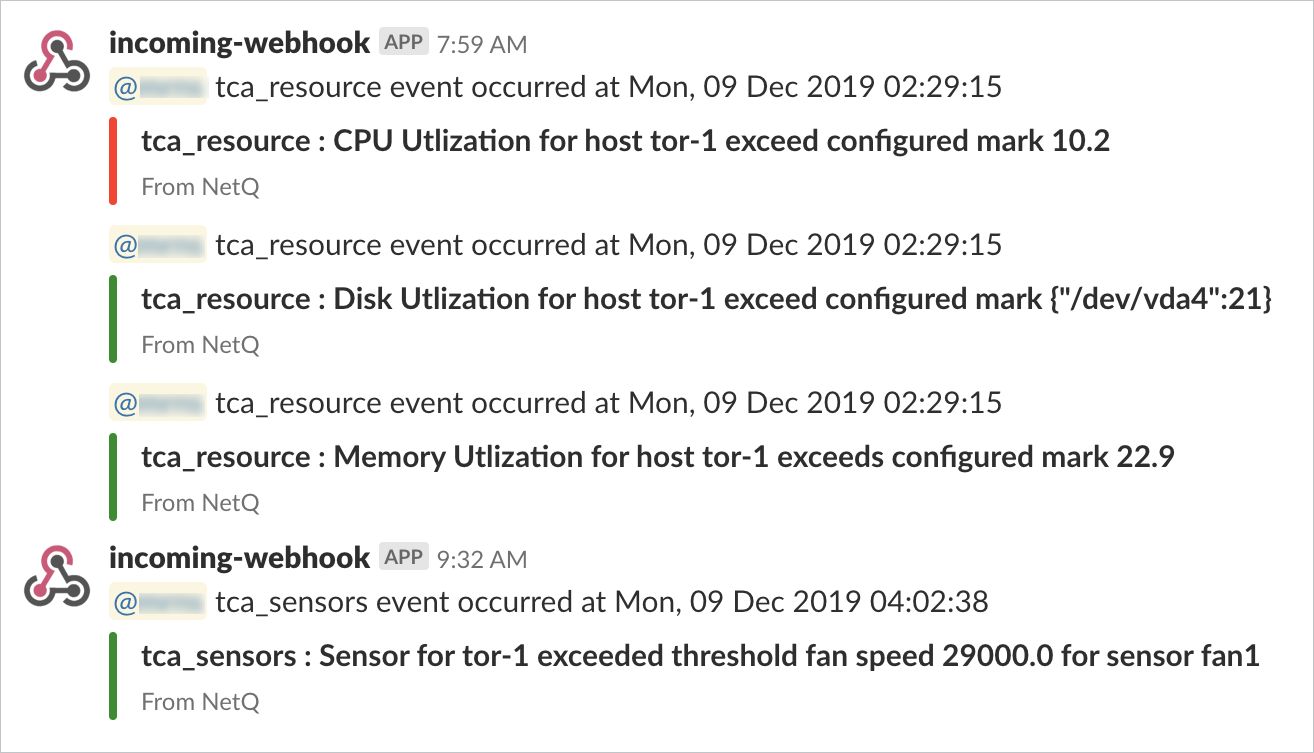
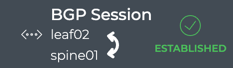
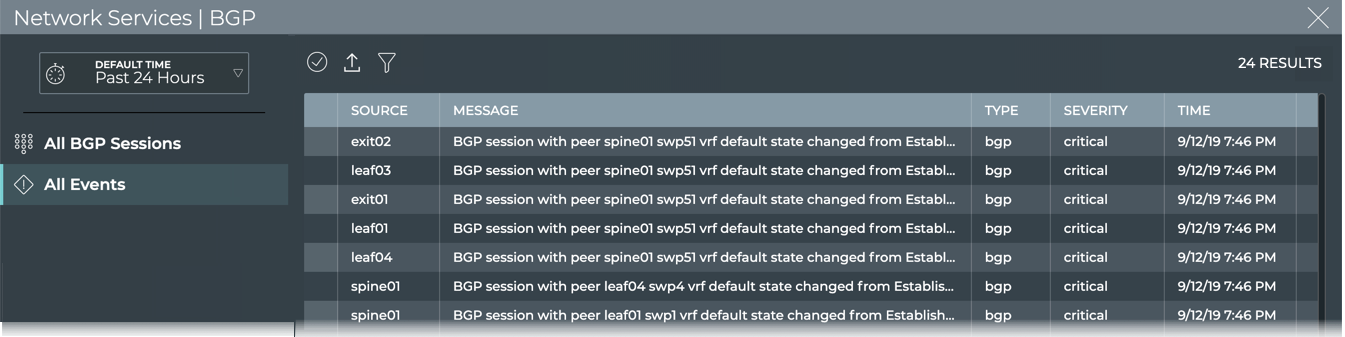
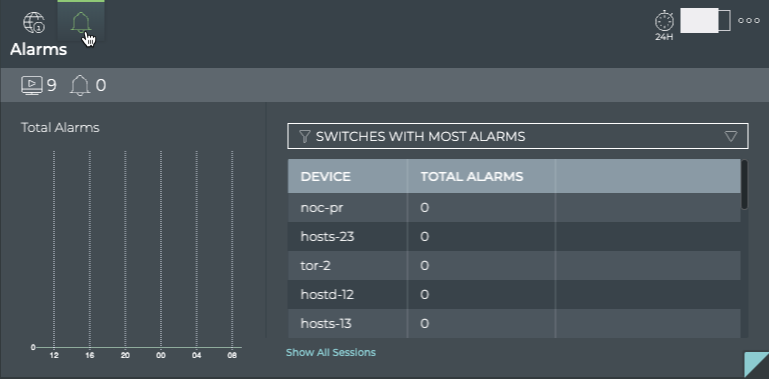
For example, for operators responsible for routing, you can create an integration with a notification application that notifies them of routing issues as they occur. This is an example of a Slack message received on a netq-notifier channel indicating that the BGP session on switch leaf04 interface swp2 has gone down.
Timestamps in NetQ
Every event or entry in the NetQ database is stored with a timestamp of when the event was captured by the NetQ Agent on the switch or server. This timestamp is based on the switch or server time where the NetQ Agent is running, and is pushed in UTC format. It is important to ensure that all devices are NTP synchronized to prevent events from being displayed out of order or not displayed at all when looking for events that occurred at a particular time or within a time window.
Interface state, IP addresses, routes, ARP/ND table (IP neighbor) entries and MAC table entries carry a timestamp that represents the time the event happened (such as when a route is deleted or an interface comes up) - except the first time the NetQ agent is run. If the network has been running and stable when a NetQ agent is brought up for the first time, then this time reflects when the agent was started. Subsequent changes to these objects are captured with an accurate time of when the event happened.
Data that is captured and saved based on polling, and just about all other data in the NetQ database, including control plane state (such as BGP or MLAG), has a timestamp of when the information was captured rather than when the event actually happened, though NetQ compensates for this if the data extracted provides additional information to compute a more precise time of the event. For example, BGP uptime can be used to determine when the event actually happened in conjunction with the timestamp.
When retrieving the timestamp, command outputs display the time in three ways:
For non-JSON output when the timestamp represents the Last Changed time, time is displayed in actual date and time when the time change occurred
For non-JSON output when the timestamp represents an Uptime, time is displayed as days, hours, minutes, and seconds from the current time
For JSON output, time is displayed in microseconds that have passed since the Epoch time (January 1, 1970 at 00:00:00 GMT)
This example shows the difference between the timestamp displays.
Restarting a NetQ Agent on a device does not update the timestamps for existing objects to reflect this new restart time. NetQ preserves their timestamps relative to the original start time of the Agent. A rare exception is if you reboot the device between the time it takes the Agent to stop and restart; in this case, the time is still relative to the start time of the Agent.
Exporting NetQ Data
You can export data from the NetQ Platform in a couple of ways:
Use the json option to output command results to JSON format for parsing in other applications
Use the UI to export data from the full screen cards
Example Using the CLI
You can check the state of BGP on your network with netq check bgp:
cumulus@leaf01:~$ netq check bgp
Total Nodes: 25, Failed Nodes: 3, Total Sessions: 220 , Failed Sessions: 24,
Hostname          VRF             Peer Name         Peer Hostname     Reason                                        Last Changed
----------------- --------------- ----------------- ----------------- --------------------------------------------- -------------------------
exit01            DataVrf1080     swp6.2            firewall01        BGP session with peer firewall01 swp6.2: AFI/ Tue Feb 12 18:11:16 2019
                                                                      SAFI evpn not activated on peer
exit01            DataVrf1080     swp7.2            firewall02        BGP session with peer firewall02 (swp7.2 vrf  Tue Feb 12 18:11:27 2019
                                                                      DataVrf1080) failed,
                                                                      reason: Peer not configured
exit01            DataVrf1081     swp6.3            firewall01        BGP session with peer firewall01 swp6.3: AFI/ Tue Feb 12 18:11:16 2019
                                                                      SAFI evpn not activated on peer
exit01            DataVrf1081     swp7.3            firewall02        BGP session with peer firewall02 (swp7.3 vrf  Tue Feb 12 18:11:27 2019
                                                                      DataVrf1081) failed,
                                                                      reason: Peer not configured
...
When you show the output in JSON format, this same command looks like this:
cumulus@leaf01:~$ netq check bgp json
{
    "failedNodes":[
        {
            "peerHostname":"firewall01",
            "lastChanged":1549995080.0,
            "hostname":"exit01",
            "peerName":"swp6.2",
            "reason":"BGP session with peer firewall01 swp6.2: AFI/SAFI evpn not activated on peer",
            "vrf":"DataVrf1080"
        },
        {
            "peerHostname":"firewall02",
            "lastChanged":1549995449.7279999256,
            "hostname":"exit01",
            "peerName":"swp7.2",
            "reason":"BGP session with peer firewall02 (swp7.2 vrf DataVrf1080) failed, reason: Peer not configured",
            "vrf":"DataVrf1080"
        },
        {
            "peerHostname":"firewall01",
            "lastChanged":1549995080.0,
            "hostname":"exit01",
            "peerName":"swp6.3",
            "reason":"BGP session with peer firewall01 swp6.3: AFI/SAFI evpn not activated on peer",
            "vrf":"DataVrf1081"
        },
        {
            "peerHostname":"firewall02",
            "lastChanged":1549995449.7349998951,
            "hostname":"exit01",
            "peerName":"swp7.3",
            "reason":"BGP session with peer firewall02 (swp7.3 vrf DataVrf1081) failed, reason: Peer not configured",
            "vrf":"DataVrf1081"
        },
...

    ],
    "summary": {
        "checkedNodeCount": 25,
        "failedSessionCount": 24,
        "failedNodeCount": 3,
        "totalSessionCount": 220
    }
}
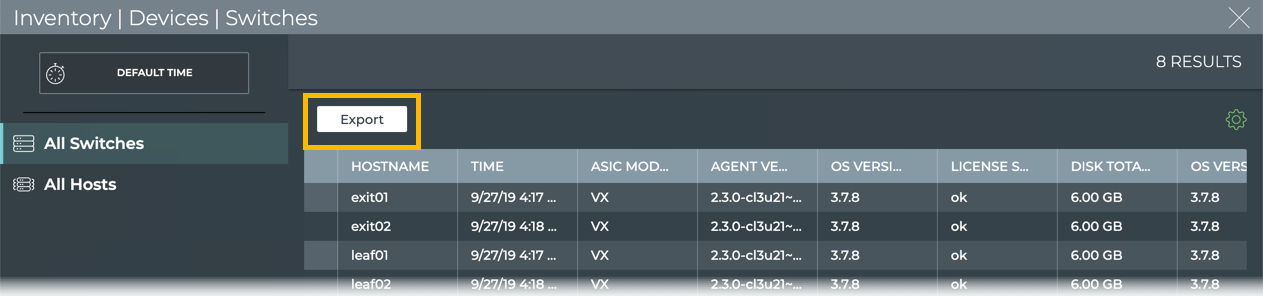
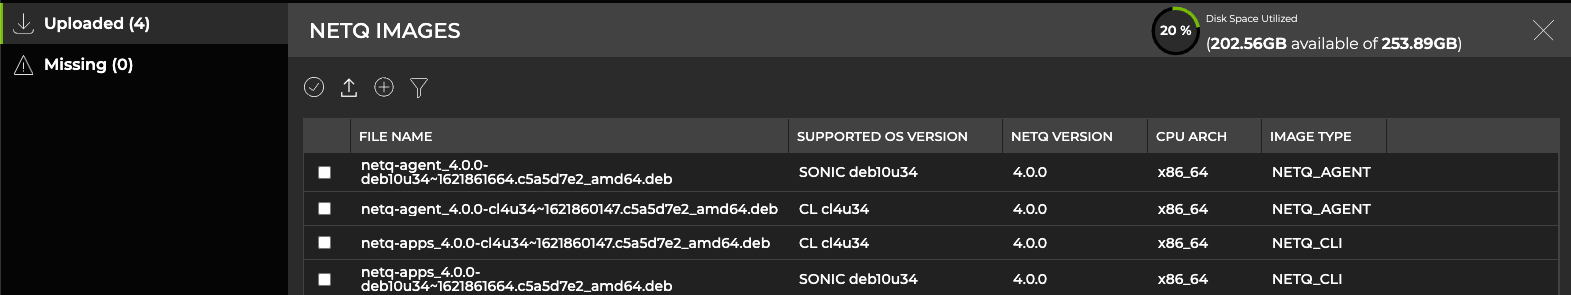
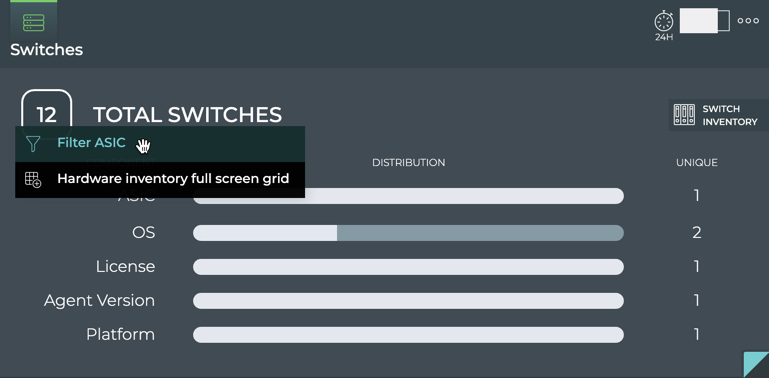
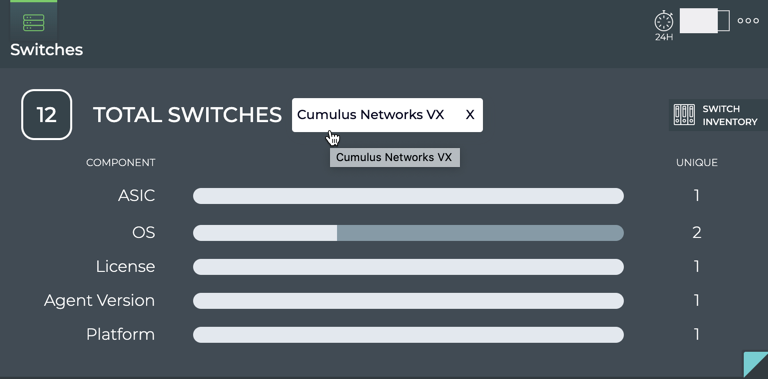
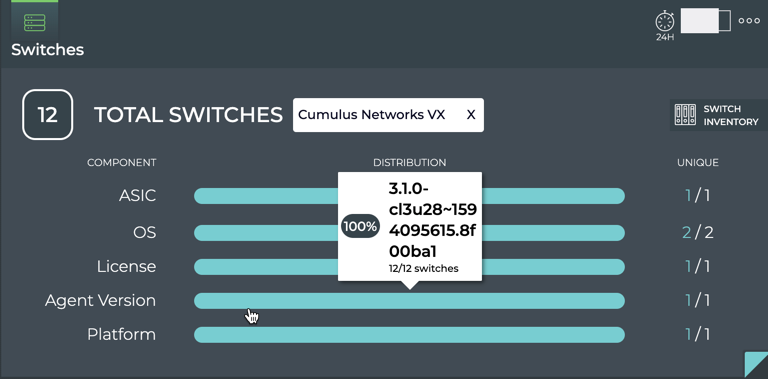
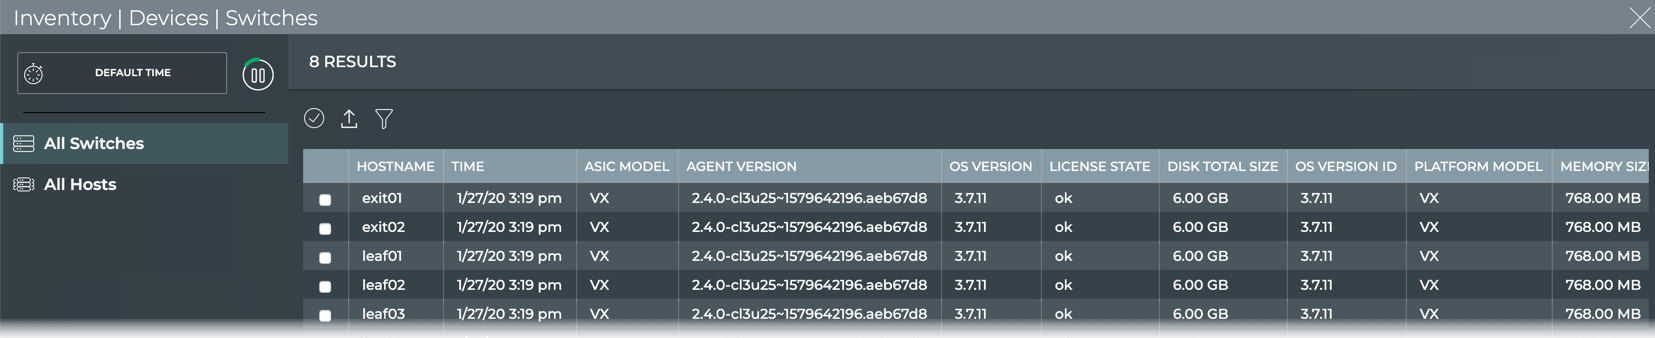
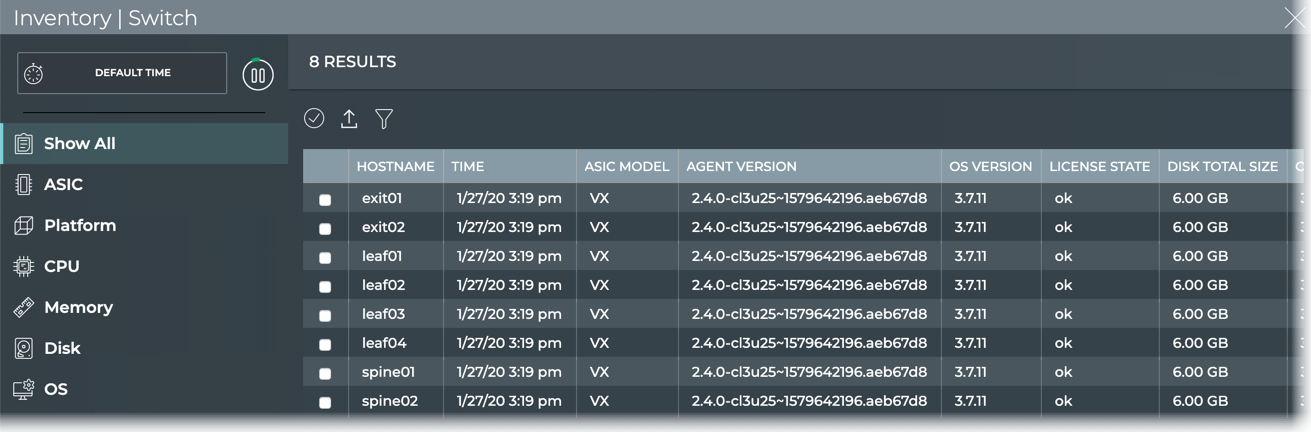
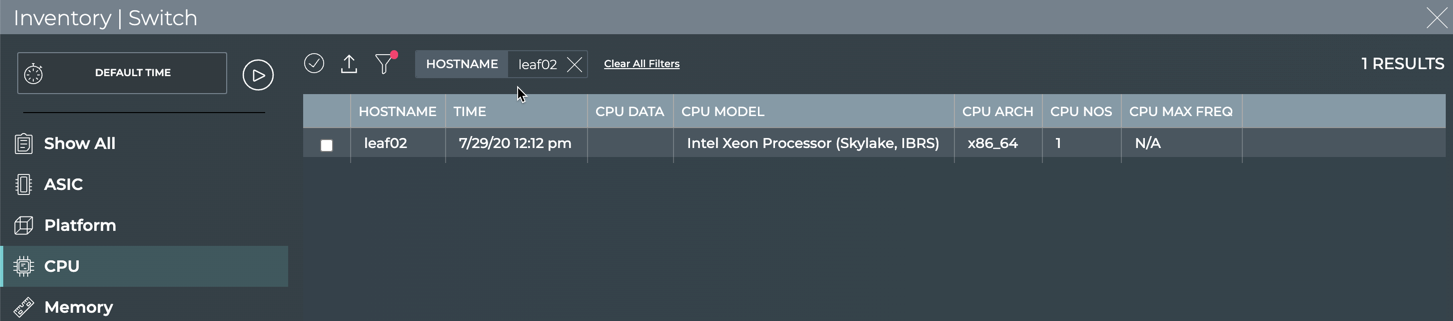
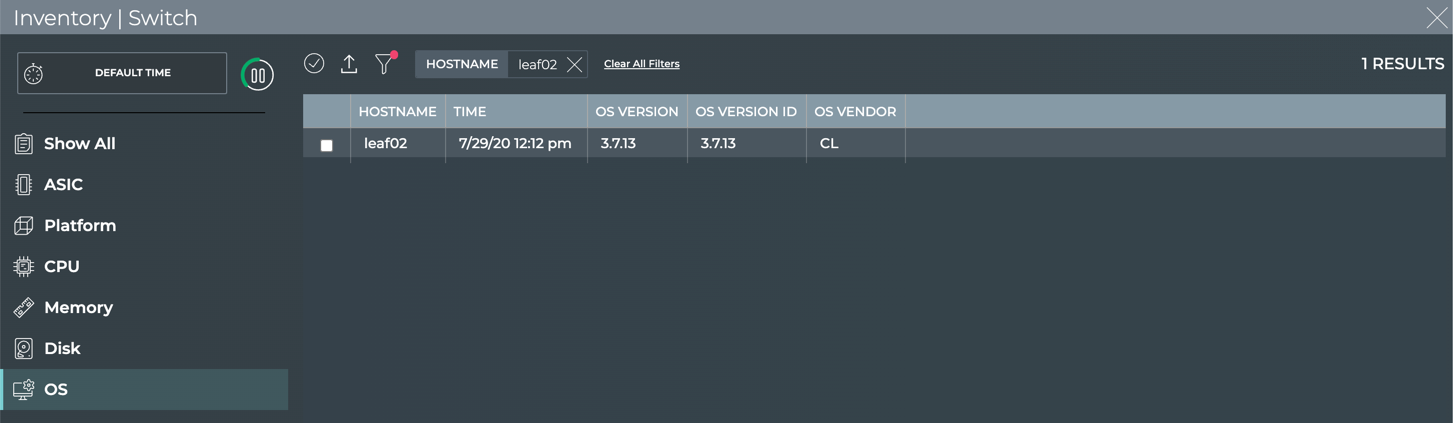
Example Using the UI
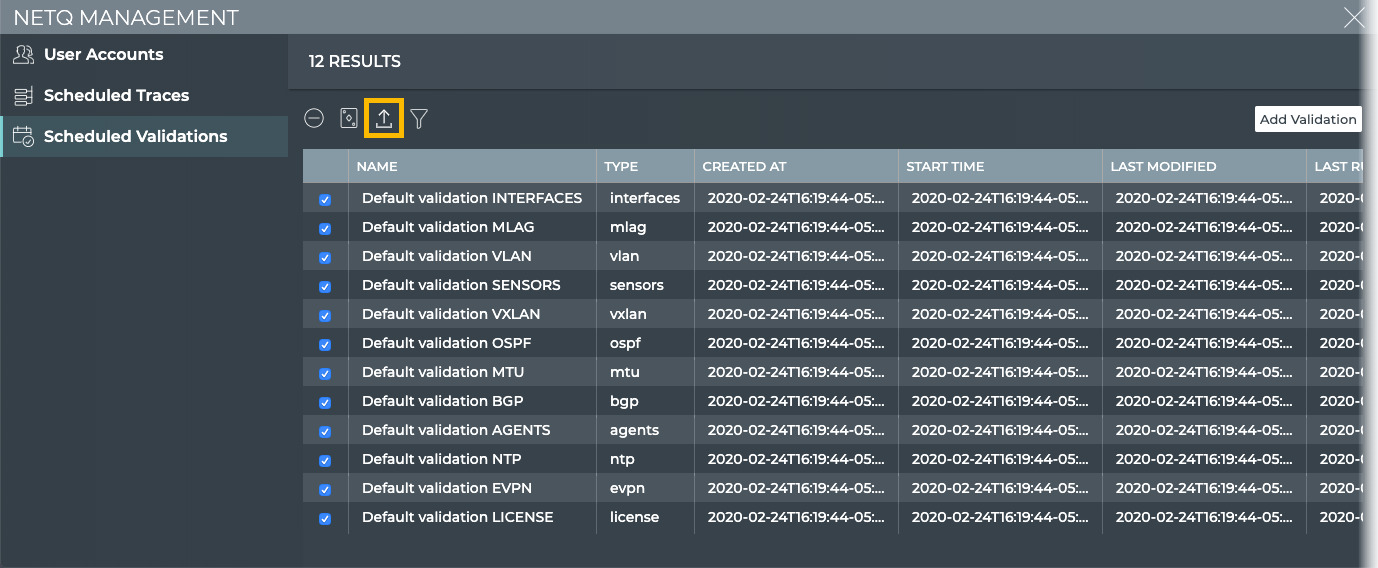
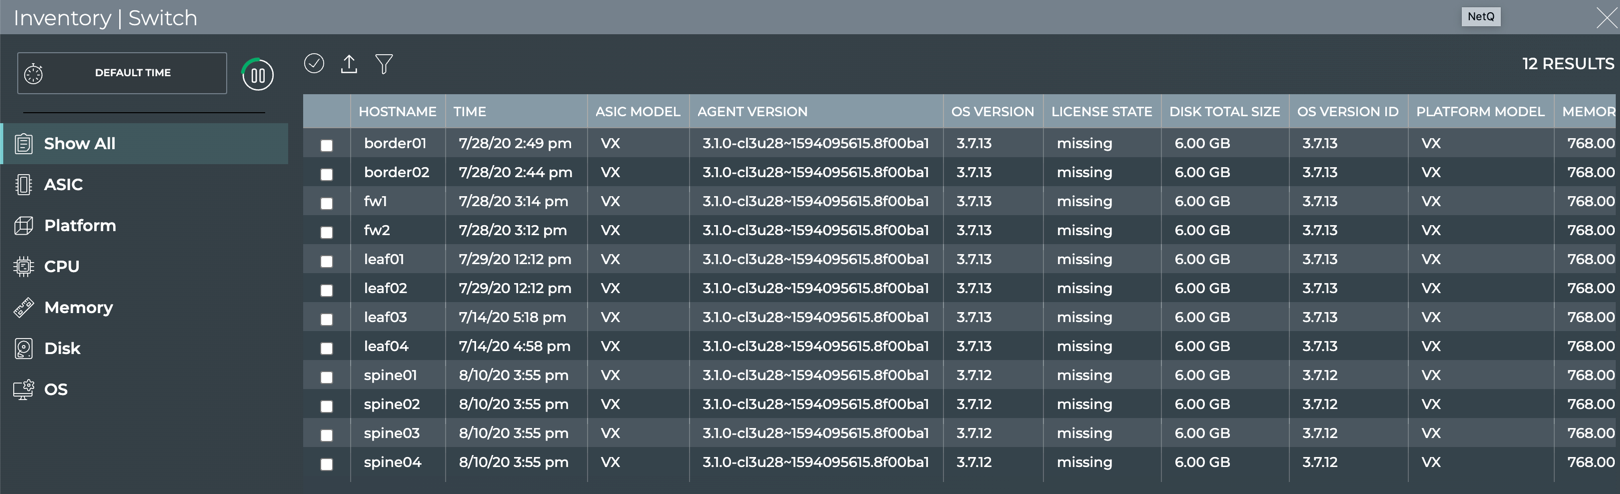
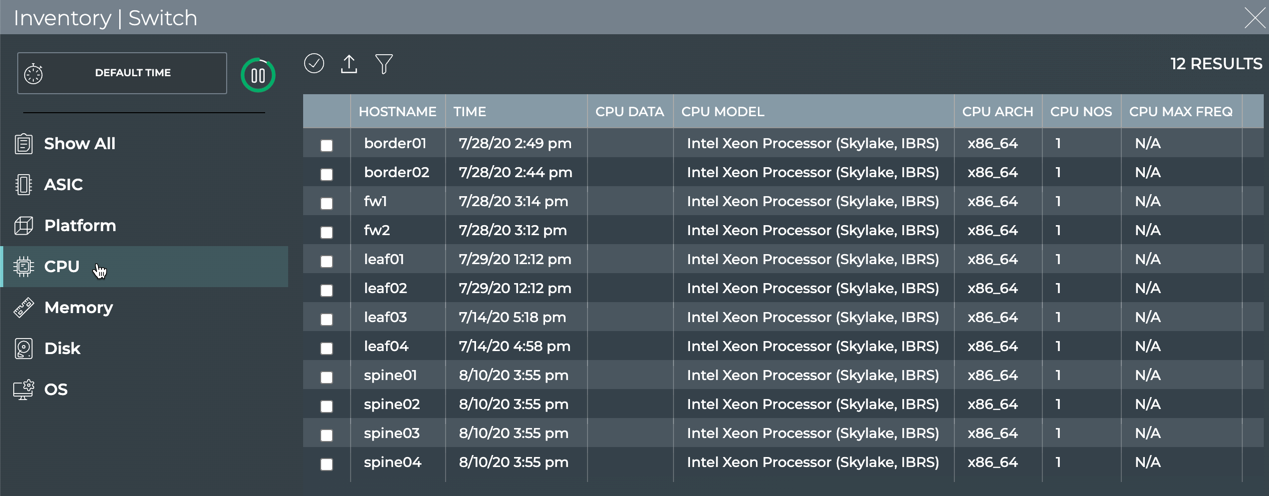
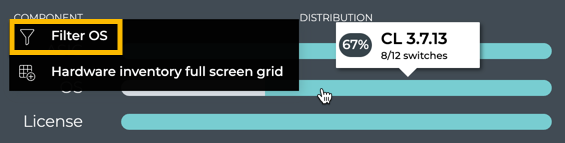
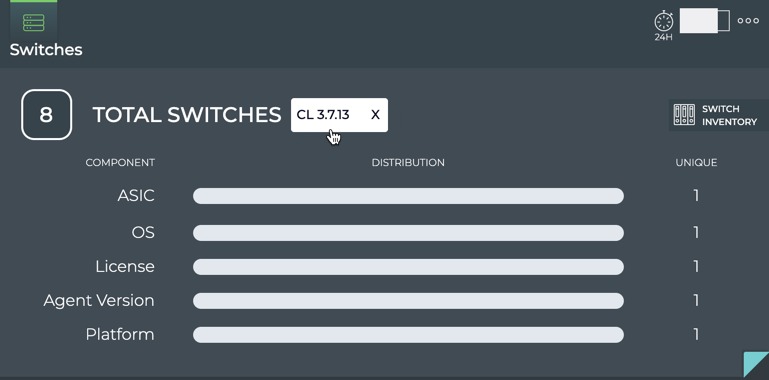
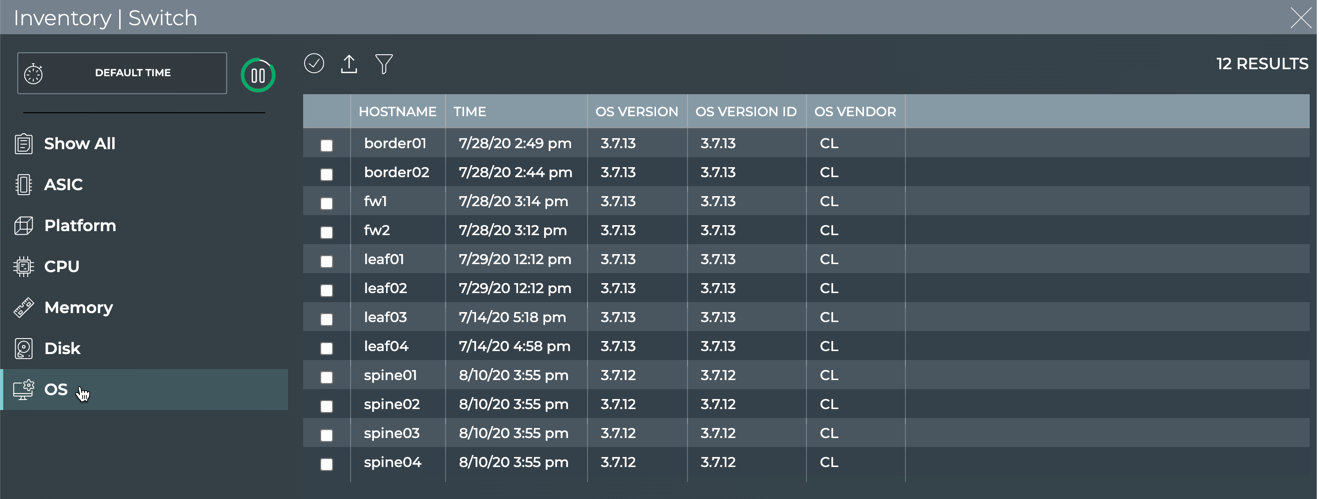
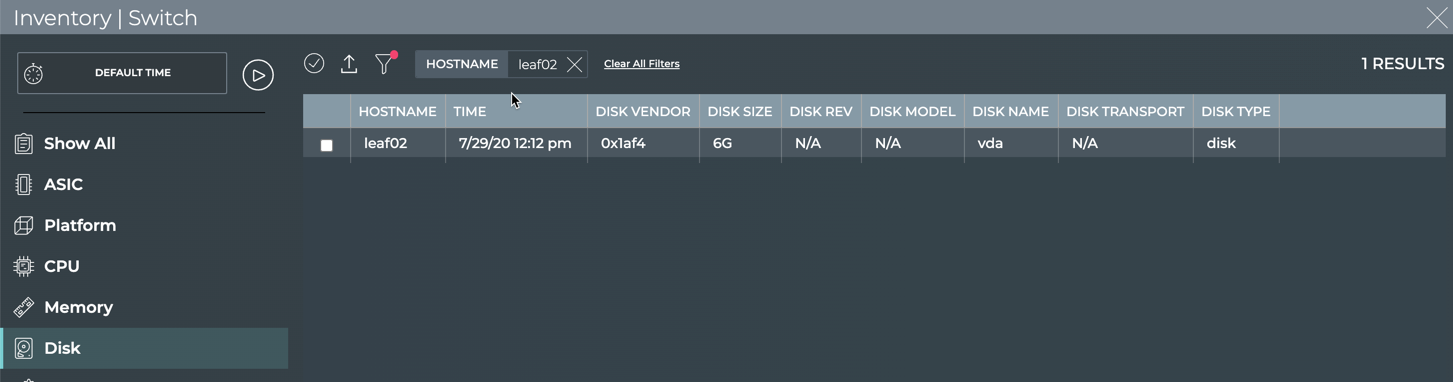
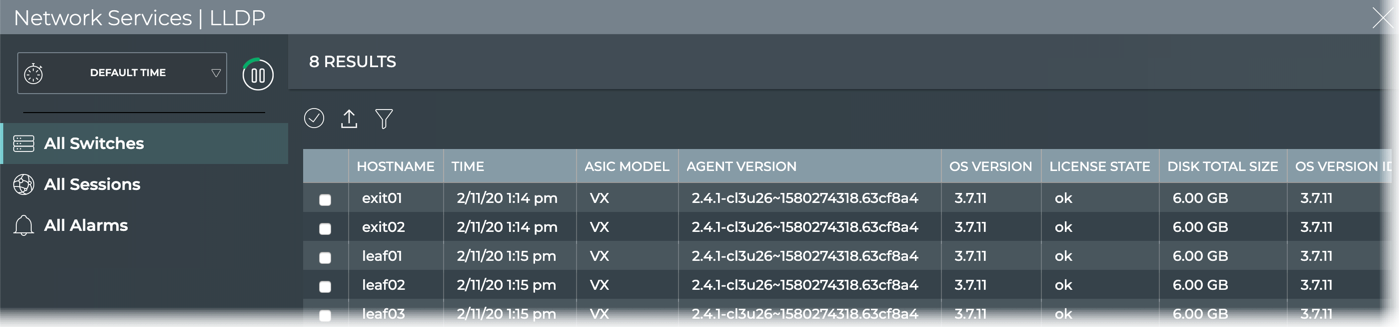
Open the full screen Switch Inventory card, select the data to export, and click Export.
Important File Locations
To aid in troubleshooting issues with NetQ, the following configuration and log files can provide insight into root causes of issues:
File
Description
/etc/netq/netq.yml
The NetQ configuration file. This file appears only if you installed either the netq-apps package or the NetQ Agent on the system.
/var/log/netqd.log
The NetQ daemon log file for the NetQ CLI. This log file appears only if you installed the netq-apps package on the system.
/var/log/netq-agent.log
The NetQ Agent log file. This log file appears only if you installed the NetQ Agent on the system.
Firewall and Port Requirements
The following ports must be open on your NetQ Platform:
You must open the following ports on your NetQ on-premises server:
Port or Protocol Number
Protocol
Component Access
4
IP Protocol
Calico networking (IP-in-IP Protocol)
22
TCP
SSH
80
TCP
Nginx
179
TCP
Calico networking (BGP)
443
TCP
NetQ UI
2379
TCP
etcd datastore
4789
UDP
Calico networking (VxLAN)
5000
TCP
Docker registry
6443
TCP
kube-apiserver
30001
TCP
DPU communication
31980
TCP
NetQ Agent communication
31982
TCP
NetQ Agent SSL communication
32708
TCP
API Gateway
NetQ User Interface Overview
The NetQ graphical user interface (UI) enables you to access NetQ capabilities through a web browser as opposed to through a terminal window using the Command Line Interface (CLI). Visual representations of the health of the network, inventory, and system events make it easy to both find faults and misconfigurations, and to fix them.
The NetQ UI is supported on Google Chrome and Mozilla Firefox. It is designed to be viewed on a display with a minimum resolution of 1920 × 1080 pixels.
Before you get started, you should refer to the release notes for this version.
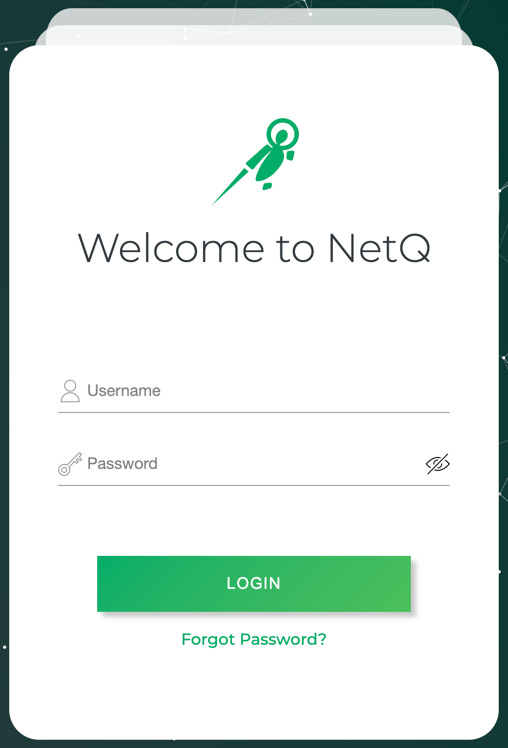
Access the NetQ UI
The NetQ UI is a web-based application. Logging in and logging out are simple and quick. Users working with a cloud deployment of NetQ can reset forgotten passwords.
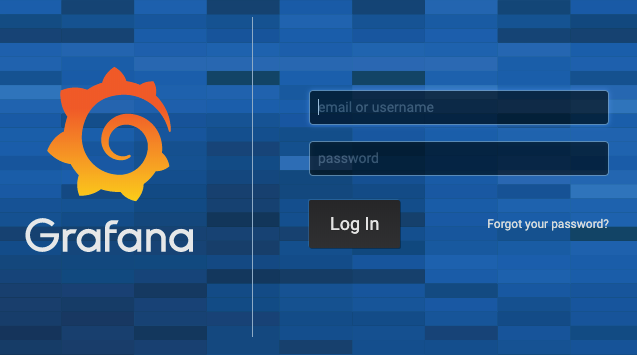
Log In to NetQ
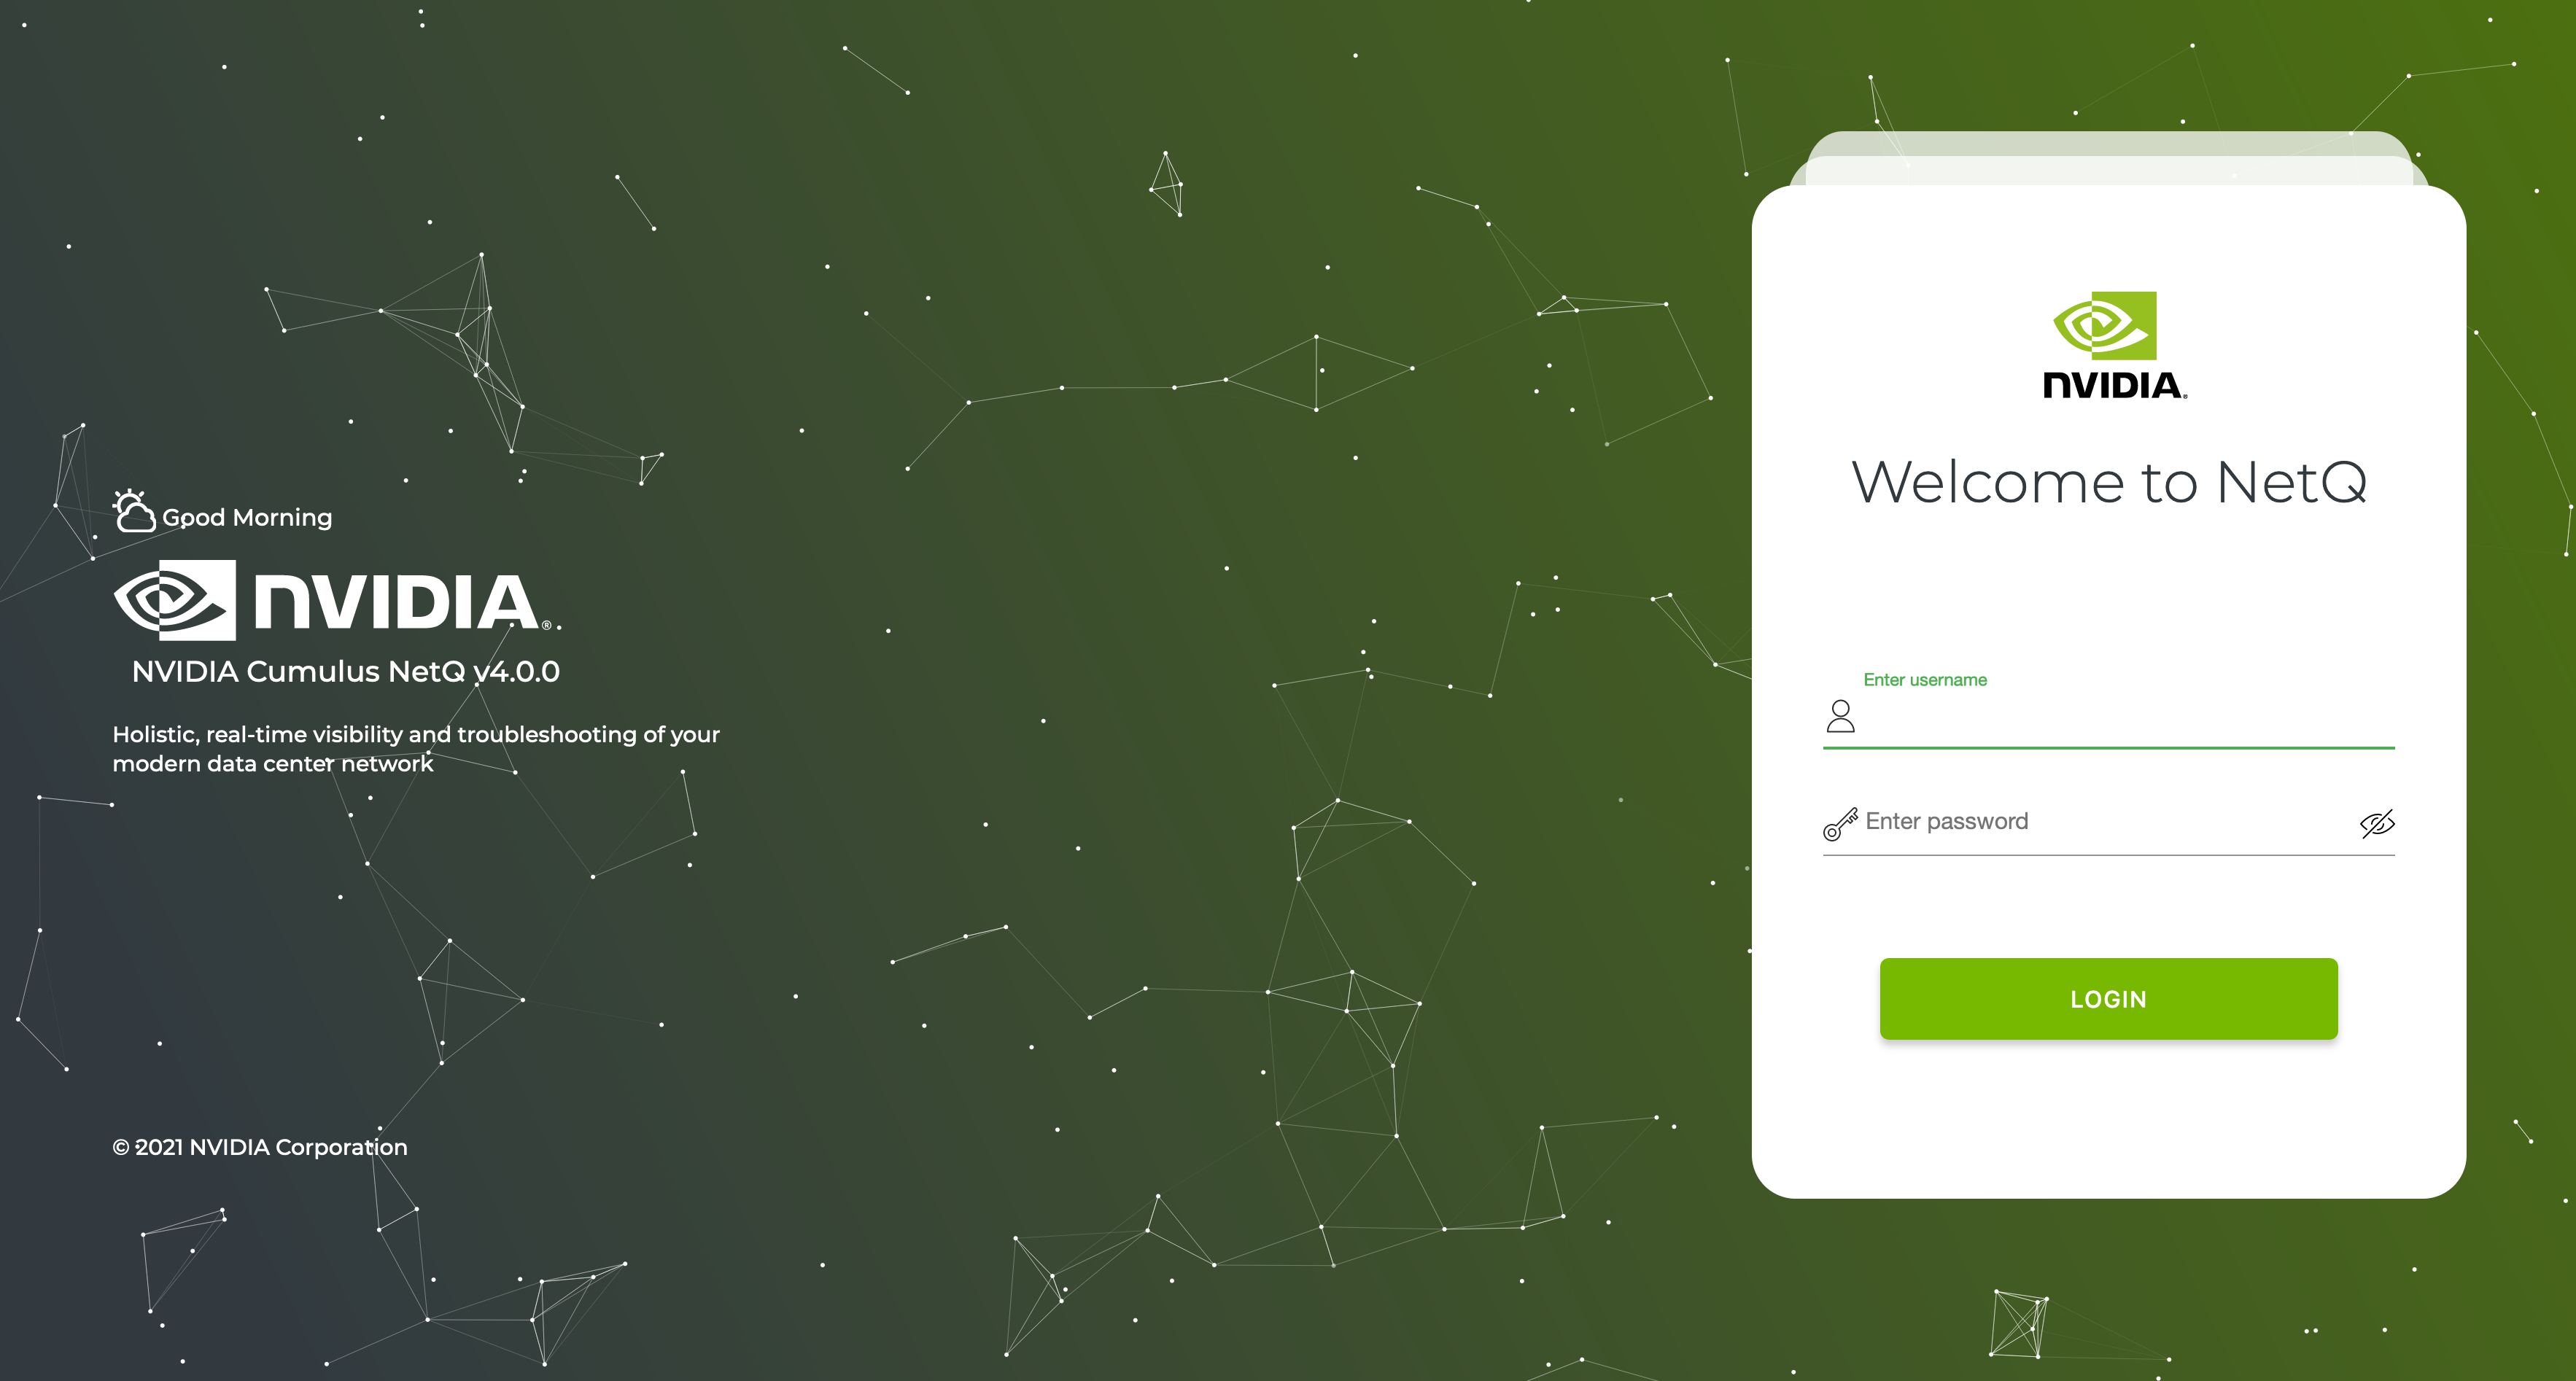
To log in to the UI:
Open a new Chrome browser window or tab.
Enter the following URL into the address bar:
NetQ On-premises Appliance or VM: https://<hostname-or-ipaddress>:443
NetQ Cloud: Use credentials created during setup. You should receive an email from NVIDIA titled NetQ Access Link.
Enter your username.
Enter your password.
Enter a new password.
Enter the new password again to confirm it.
Click Update and Accept after reading the Terms of Use.
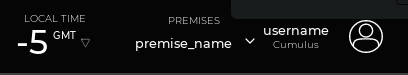
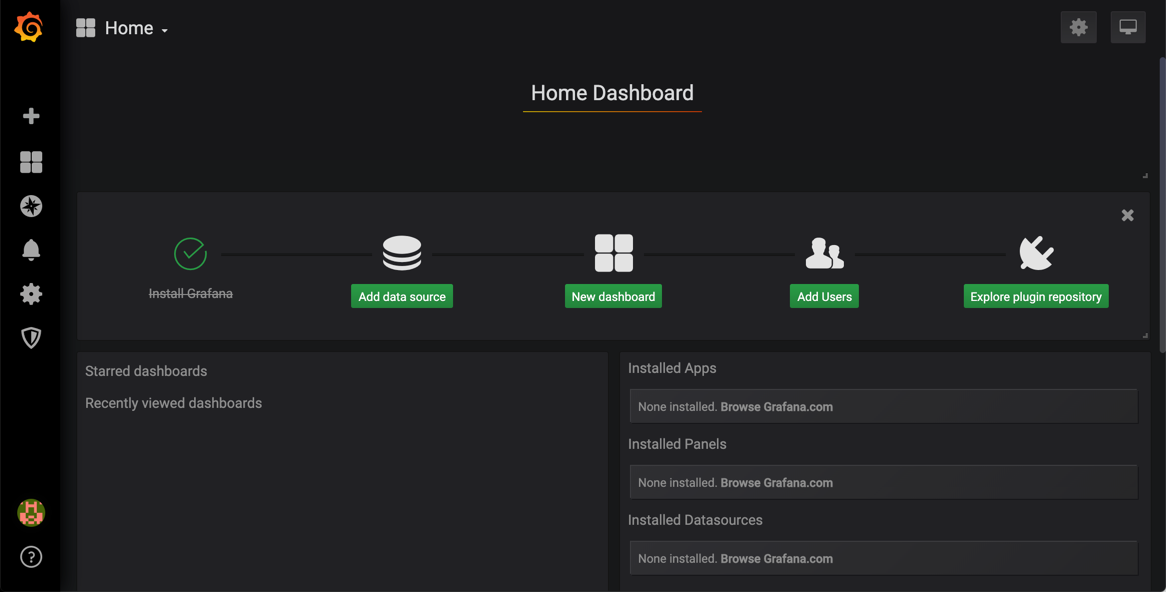
The default NetQ Workbench opens, with your username shown in the upper right corner of the application.
Select Create Password from the email received from NVIDIA titled *NetQ Access Link."
Enter a new password.
Enter the new password again to confirm it.
Log in using your email address and created password.
Click to agree and accept the Terms of Use after reading them.
The default NetQ Workbench opens, with your username and premise shown in the upper right corner of the application.
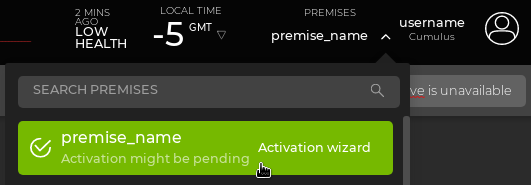
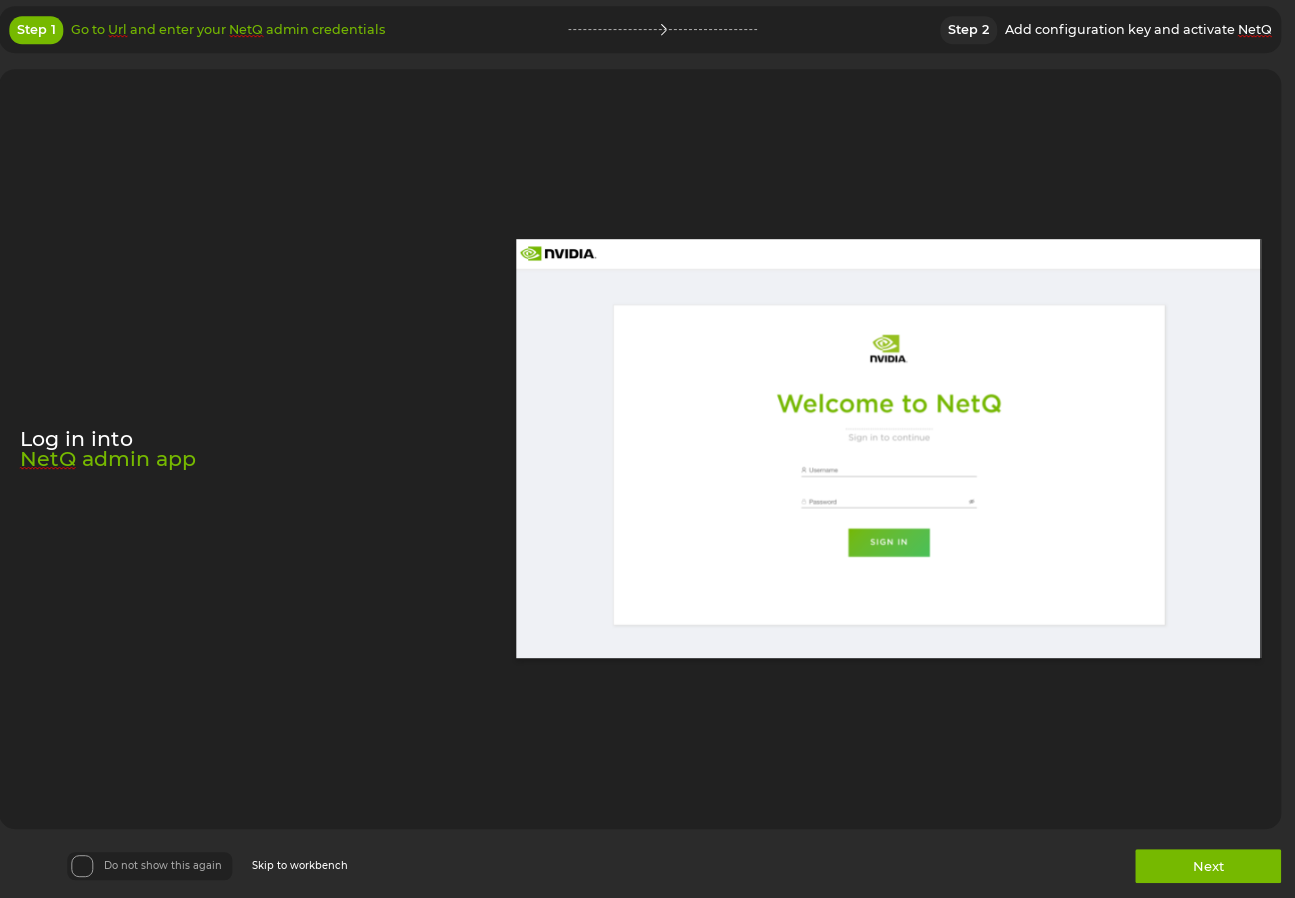
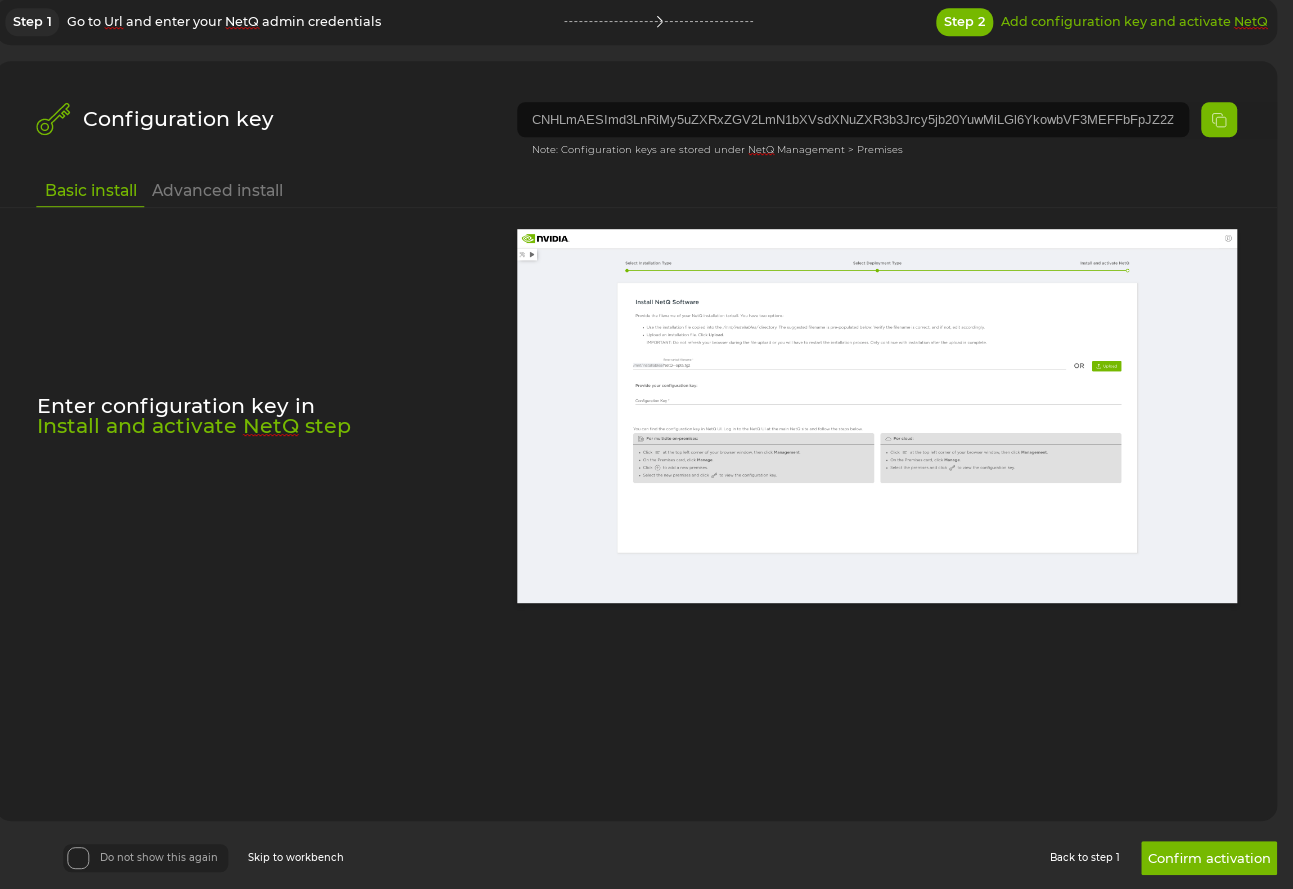
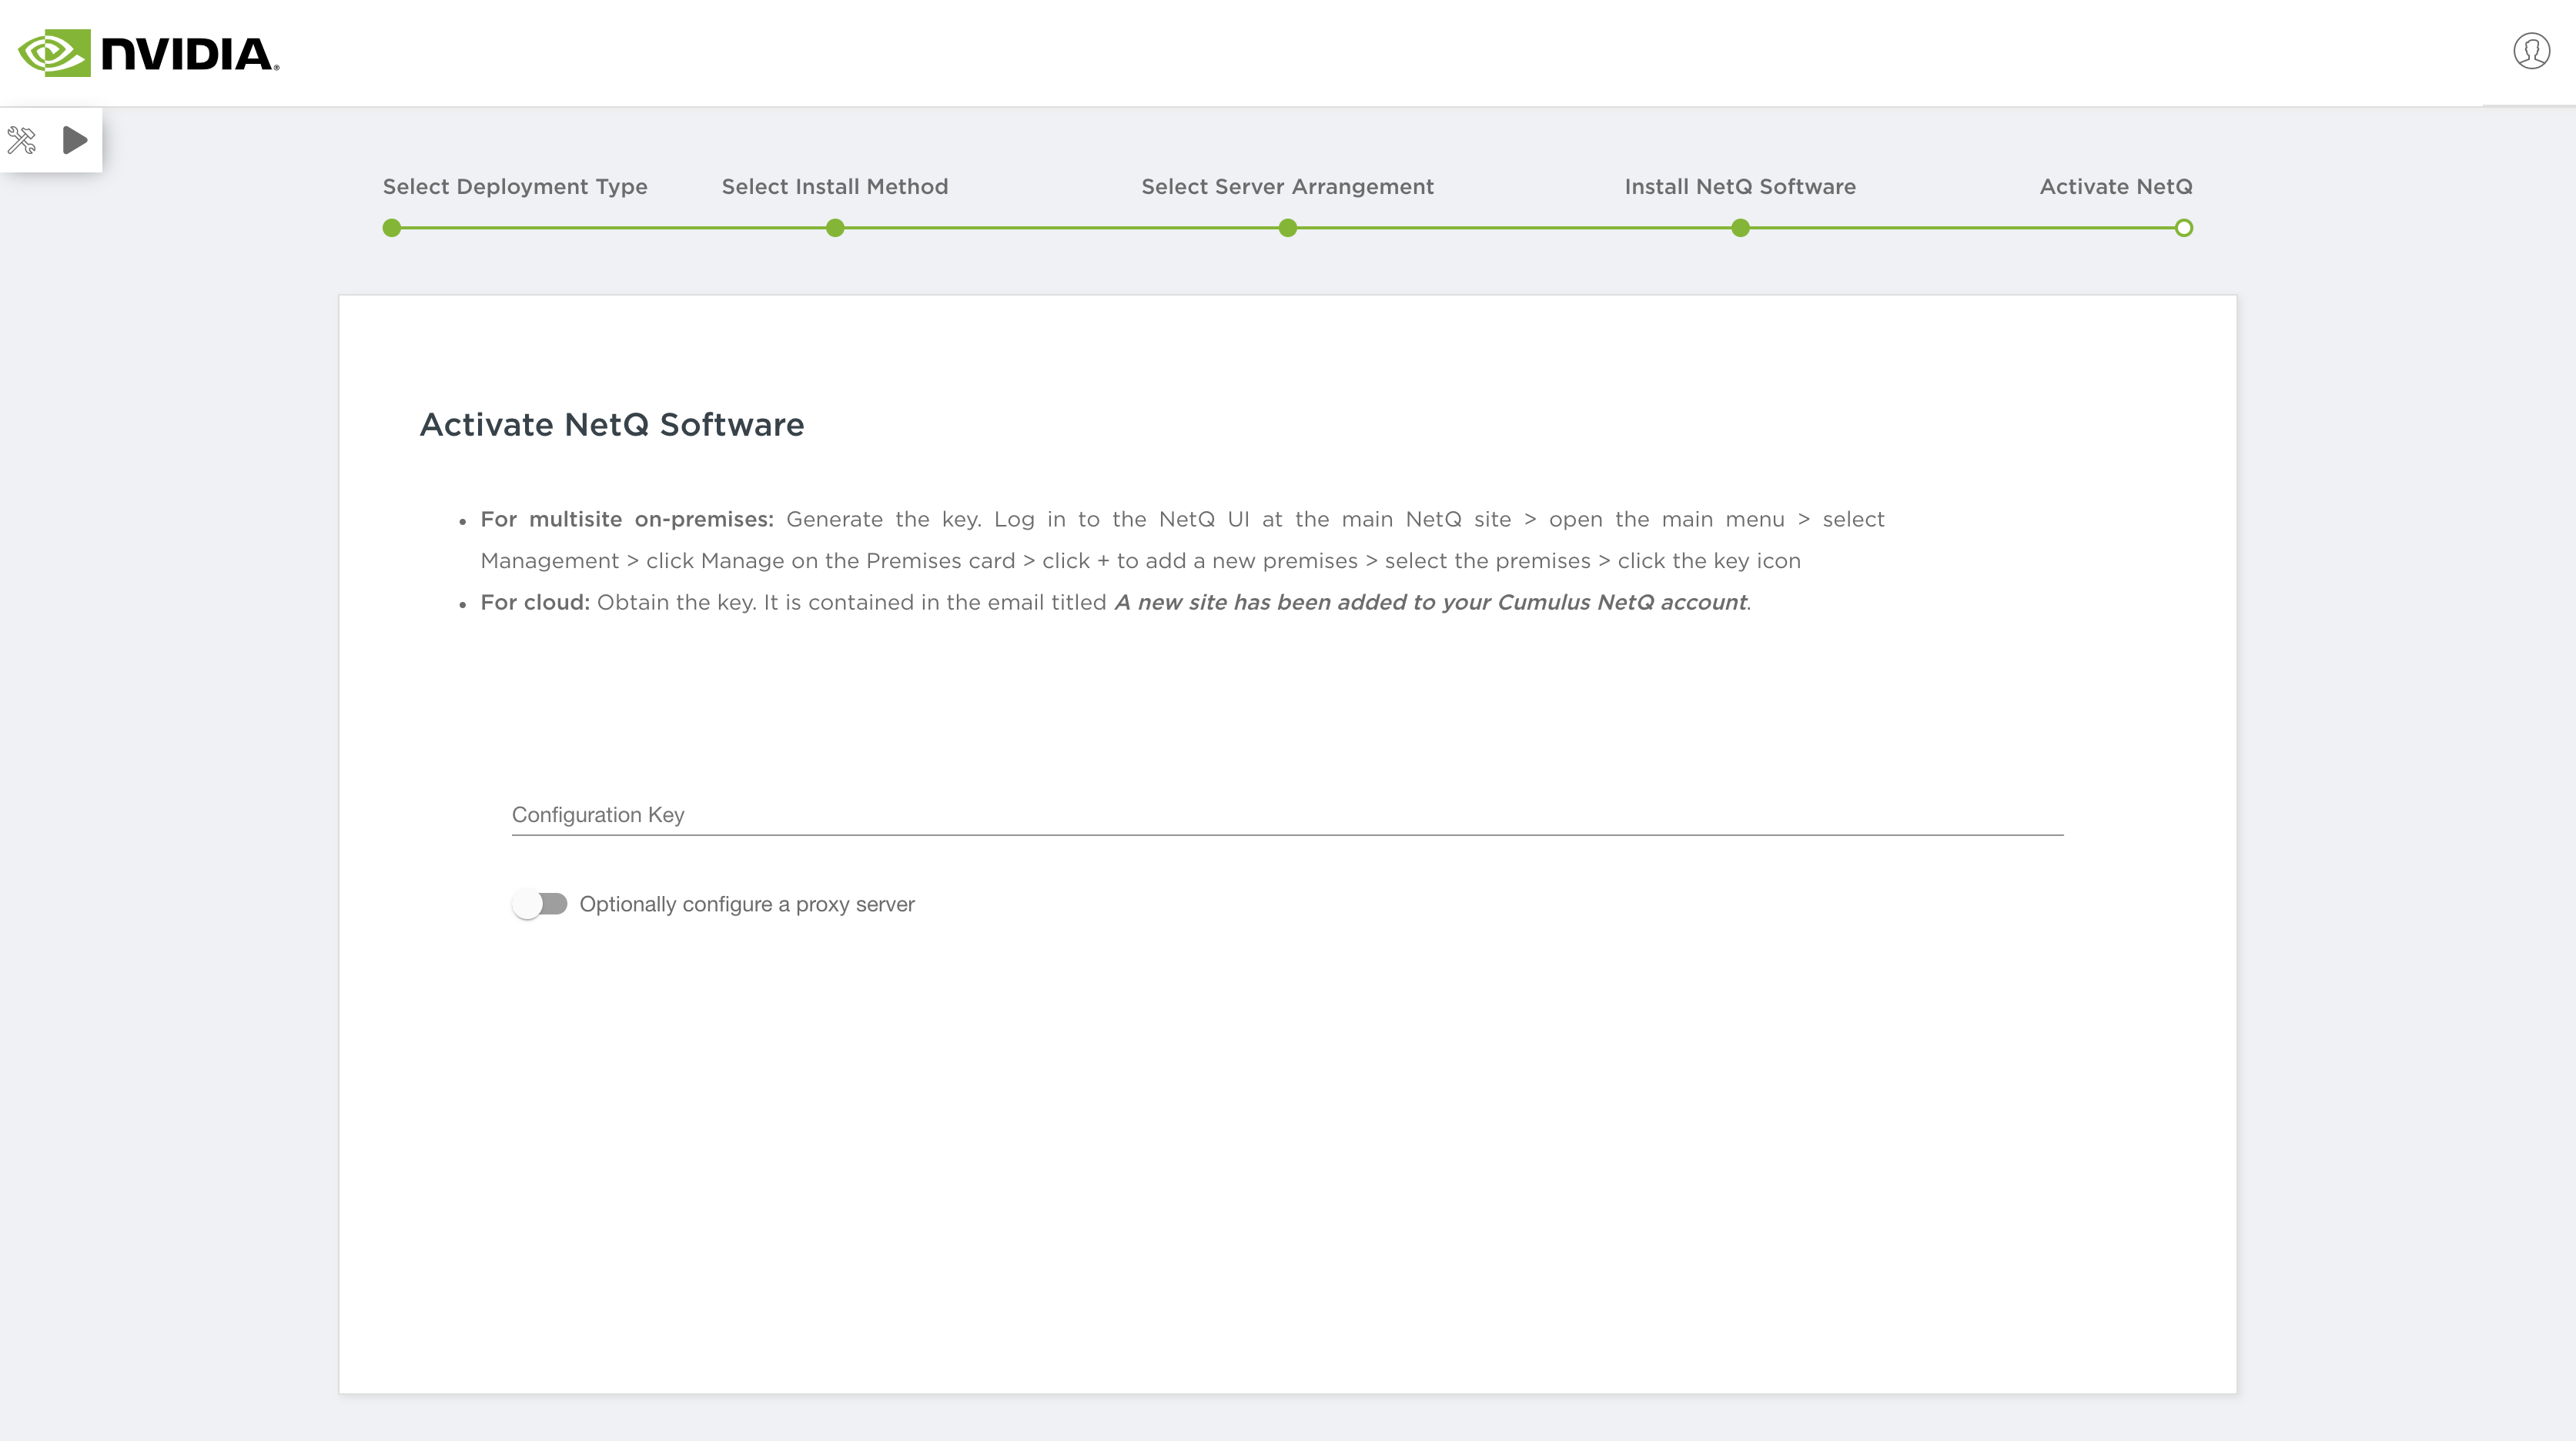
Click on the premise and select Activate Wizard
Click through the activation wizard and follow the instructions to obtain the activation key used during installation through the Admin UI.
Enter your username.
Enter your password.
The user-specified home workbench is displayed. If a home workbench is not specified, then the Cumulus Default workbench is displayed.
Any workbench can be set as the home workbench. Click (User Settings), click Profiles and Preferences, then on the Workbenches card click to the left of the workbench name you want to be your home workbench.
Reset a Forgotten Password
For cloud deployments, you can reset your password if it has been forgotten.
Enter an email address where you want instructions to be sent for resetting the password.
Click Send Reset Email, or click Cancel to return to login page.
Log in to the email account where you sent the reset message. Look for a message with a subject of NetQ Password Reset Link from netq-sre@cumulusnetworks.com.
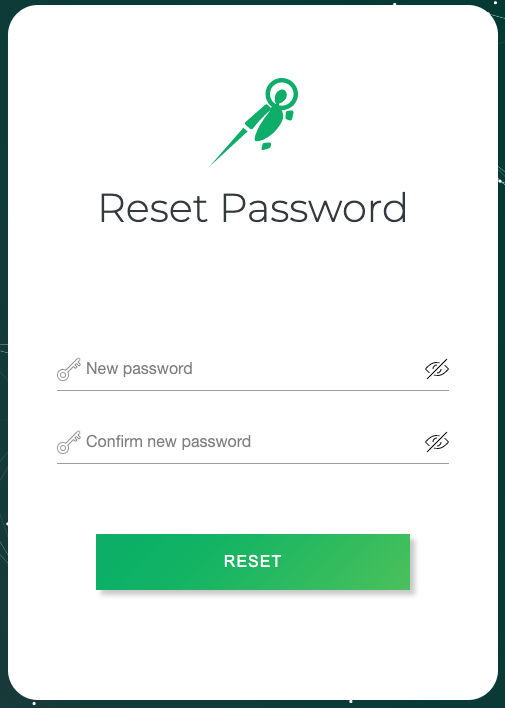
Click on the link provided to open the Reset Password dialog.
Enter a new password.
Enter the new password again to confirm it.
Click Reset.
A confirmation message is shown on successful reset.
Click Login to access NetQ with your username and new password.
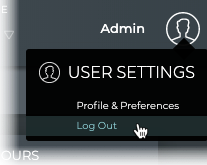
Log Out of NetQ
To log out of the NetQ UI:
Click at the top right of the application.
Select Log Out.
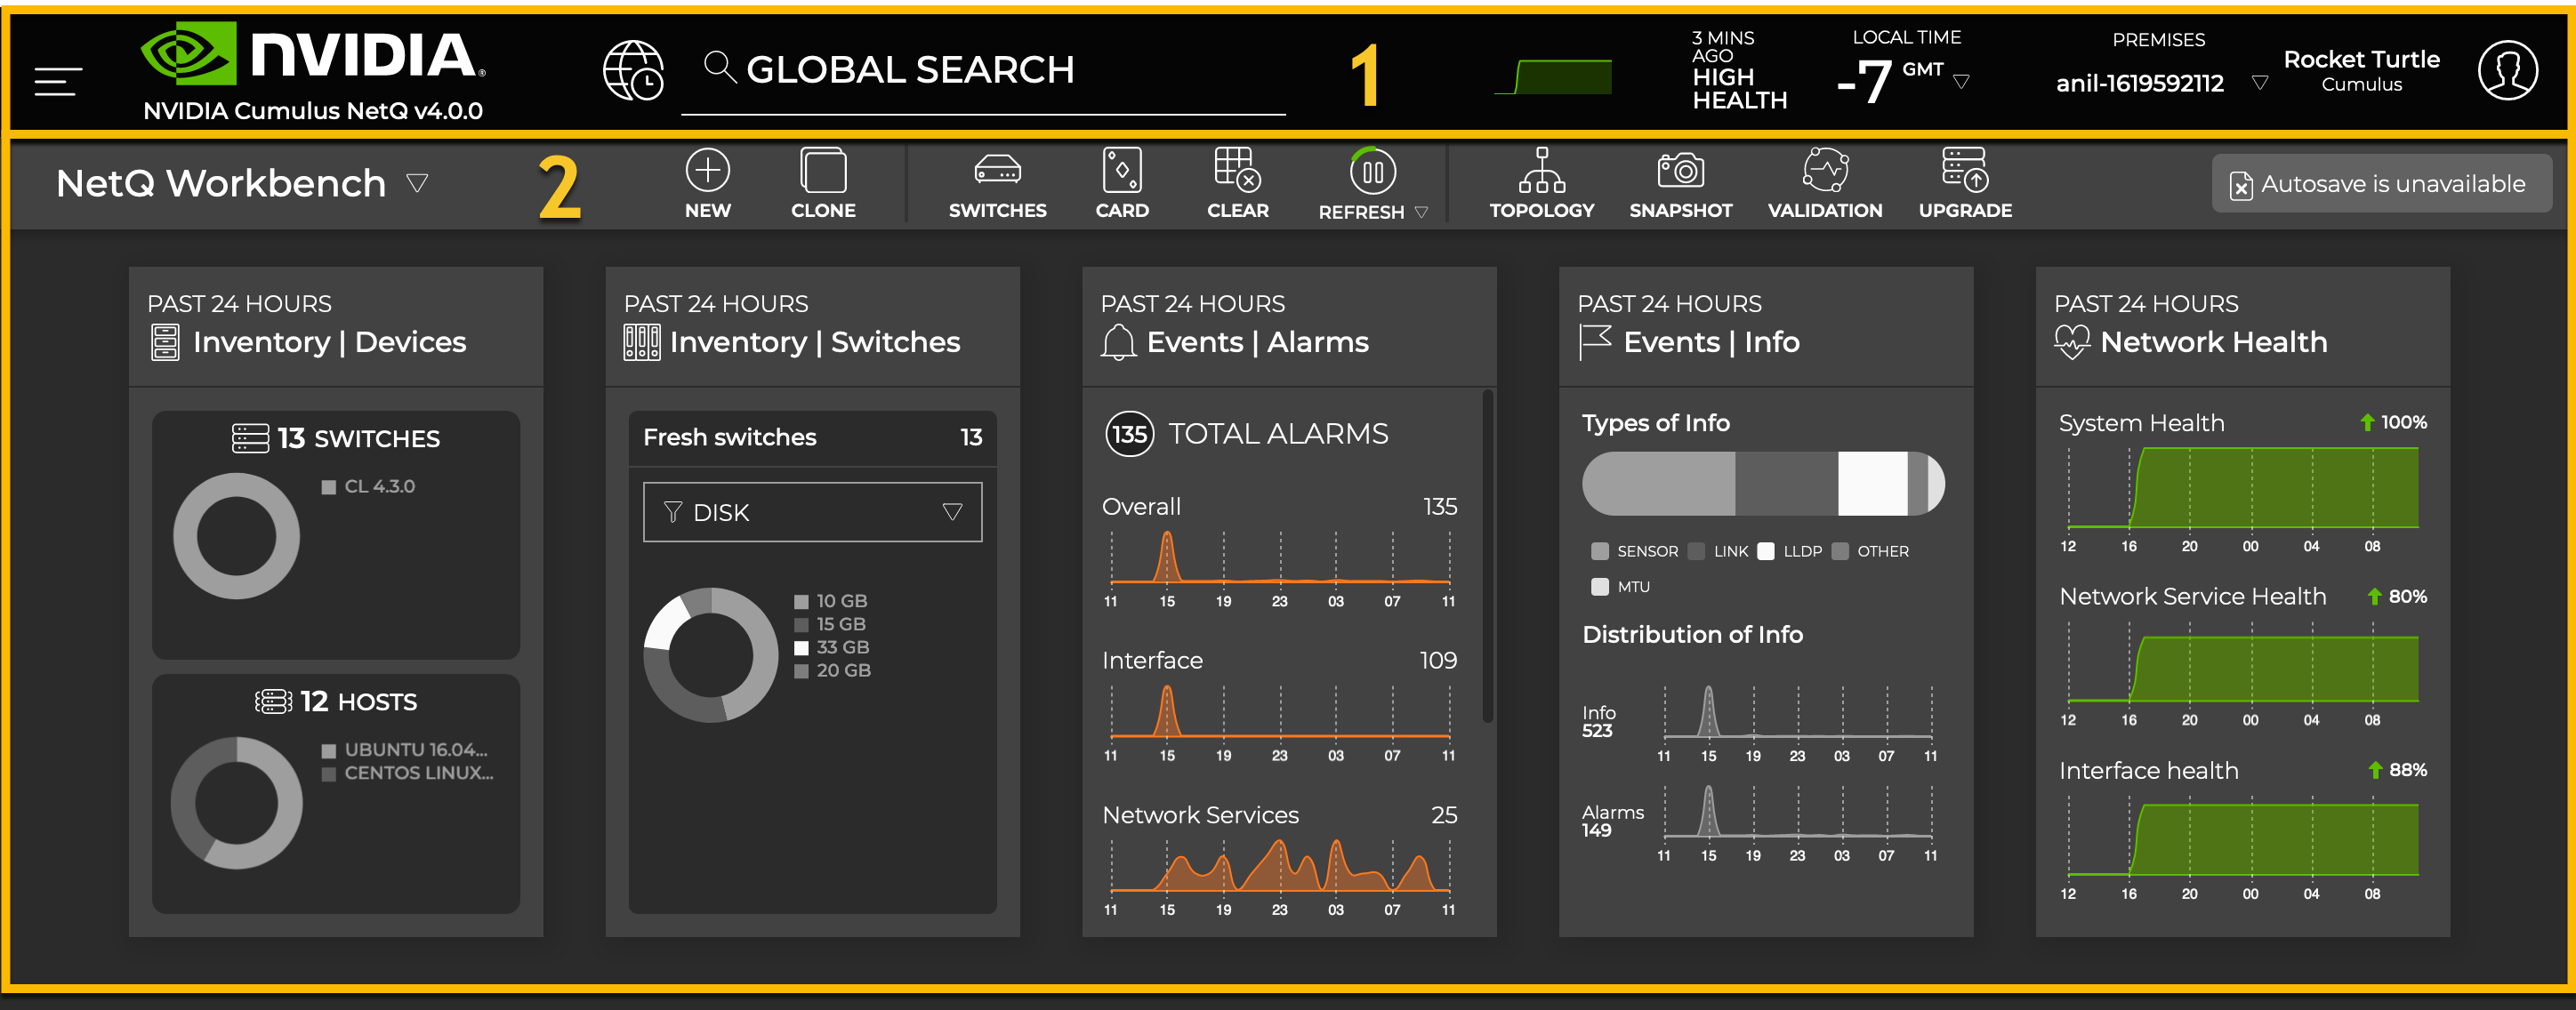
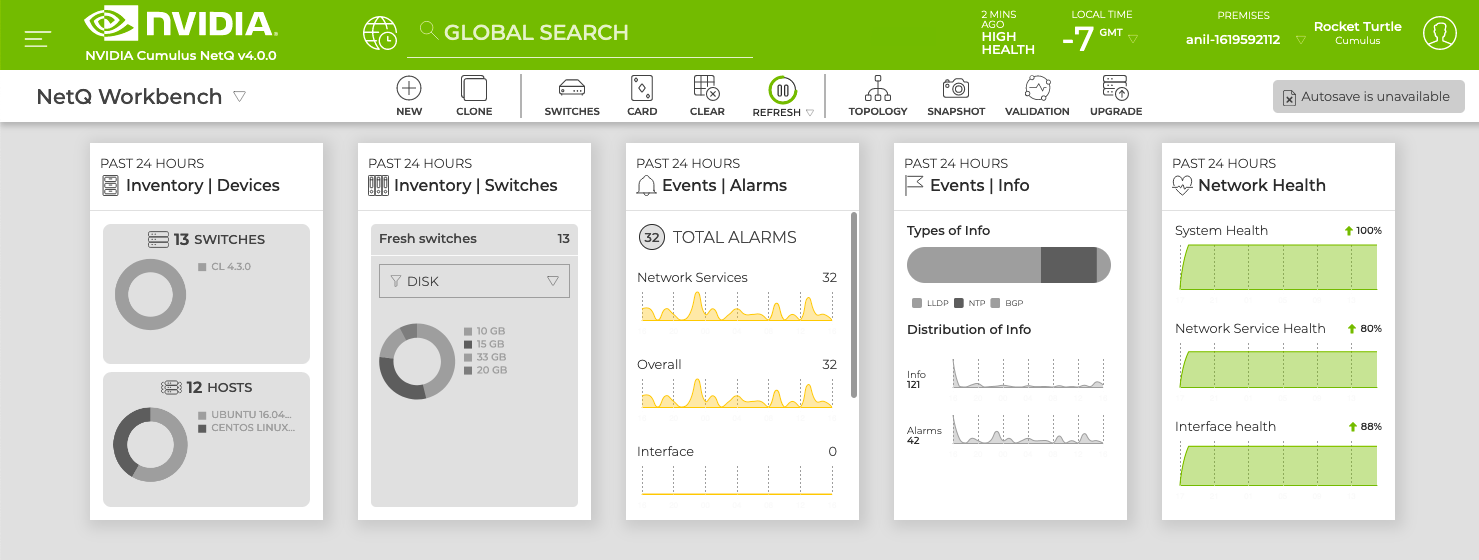
Application Layout
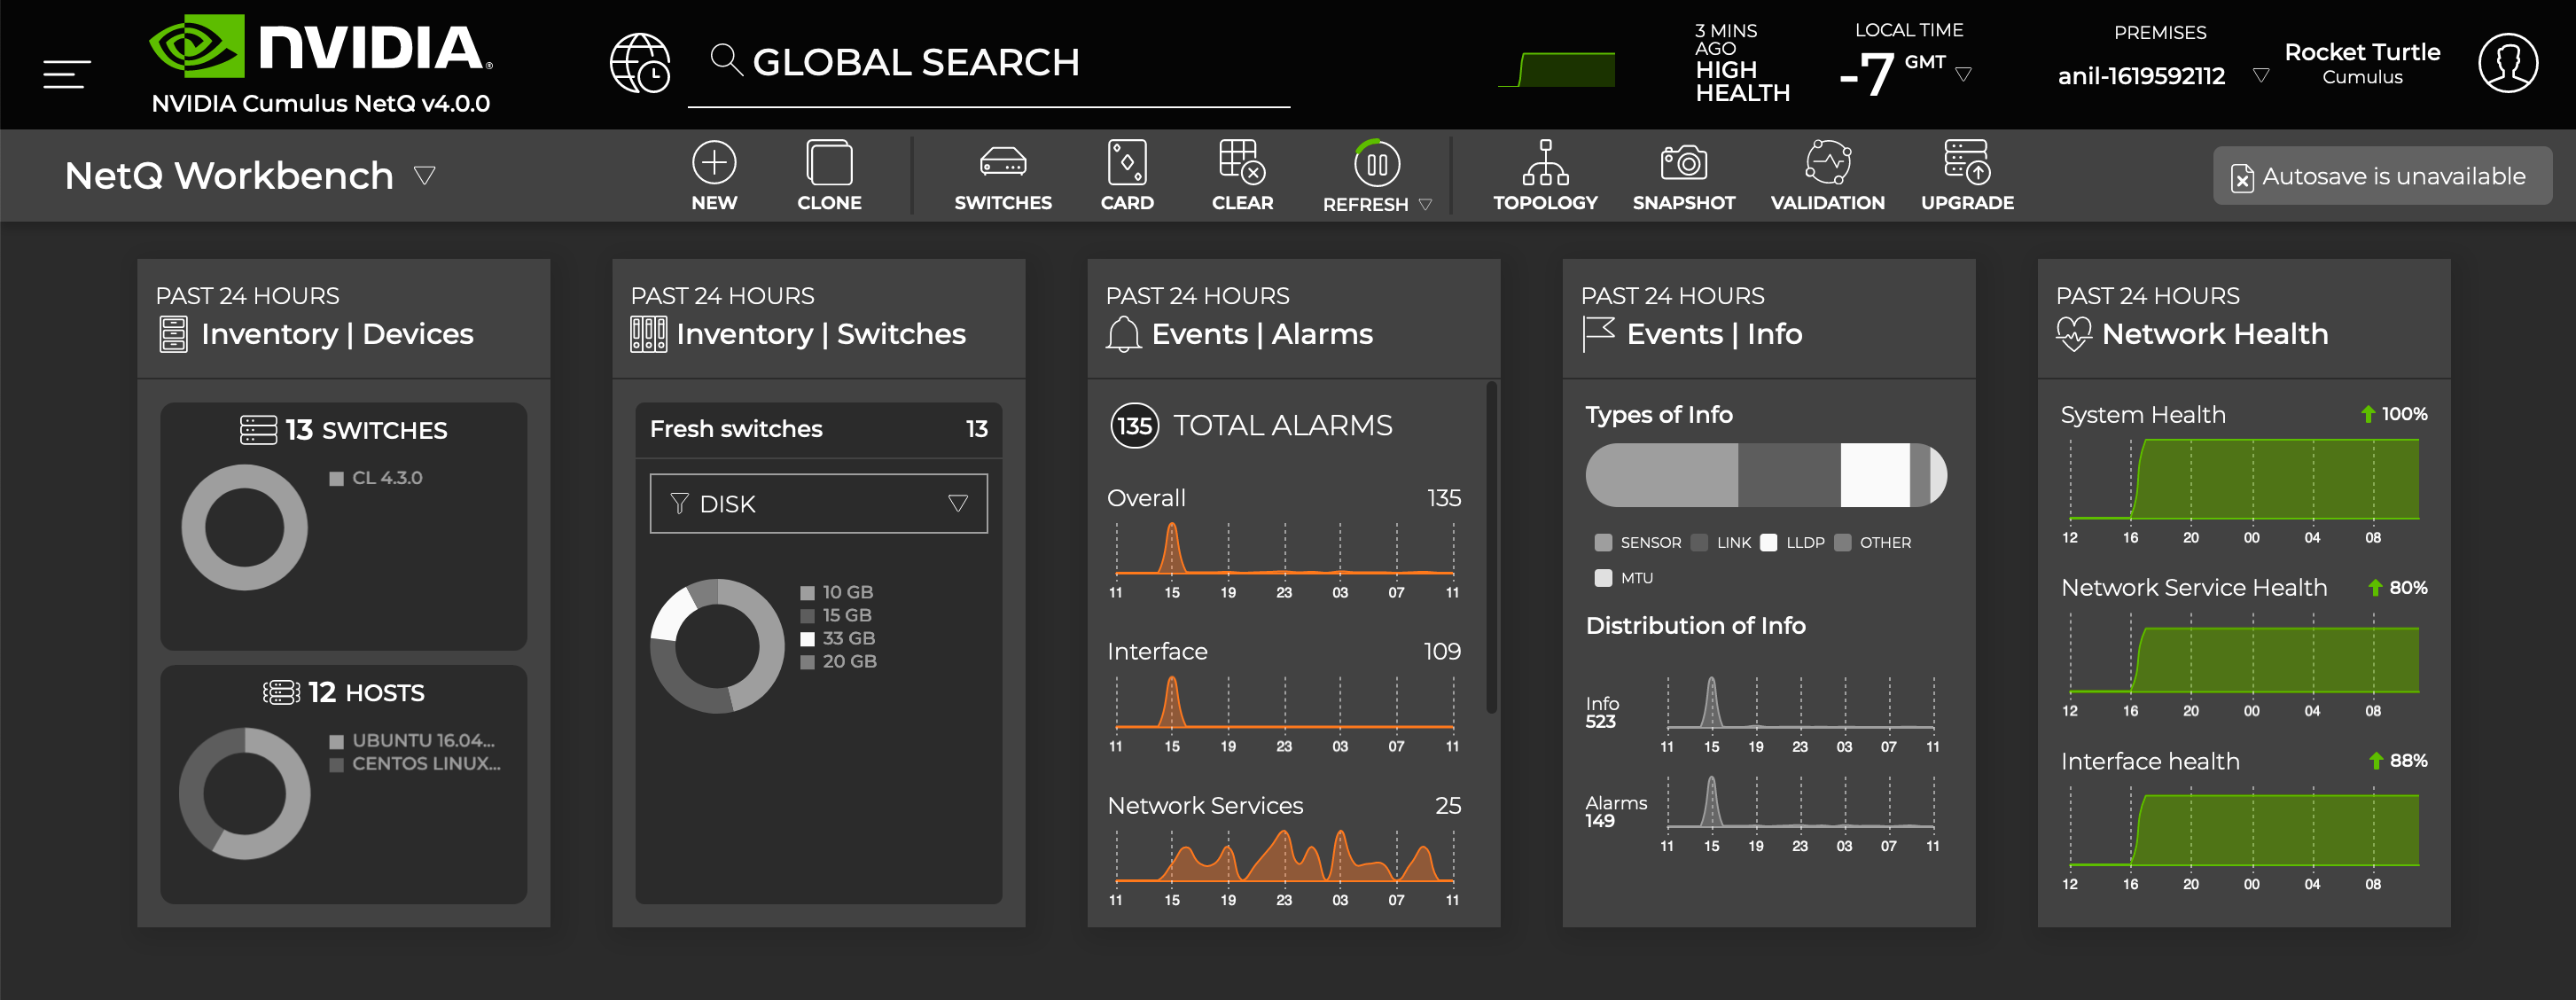
The NetQ UI contains two main areas:
Application Header (1): Contains the main menu, NetQ version, recent actions history, search capabilities, quick health status chart, local time zone, premises list, and user account information.
Workbench (2): Contains a task bar and content cards (with status and configuration information about your network and its various components).
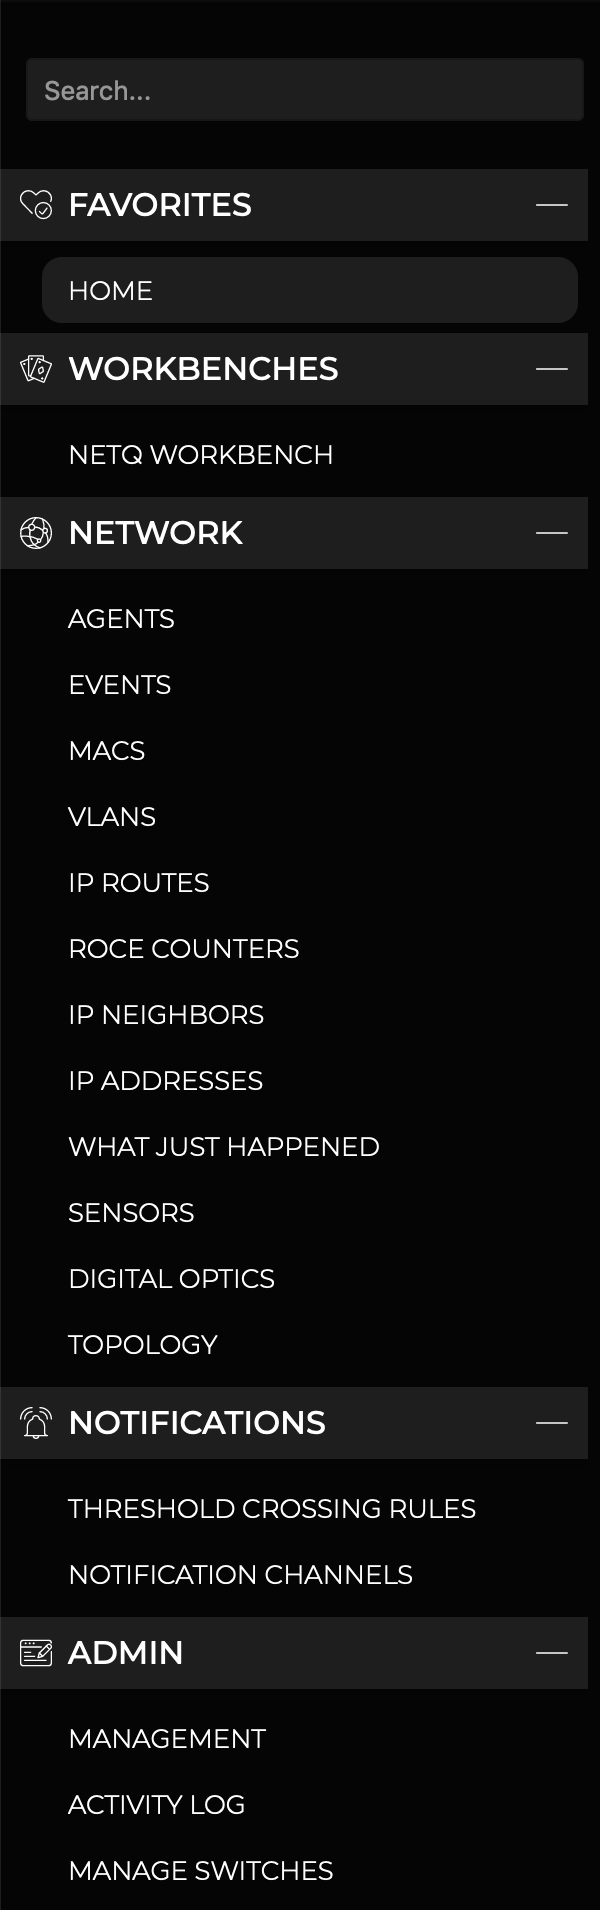
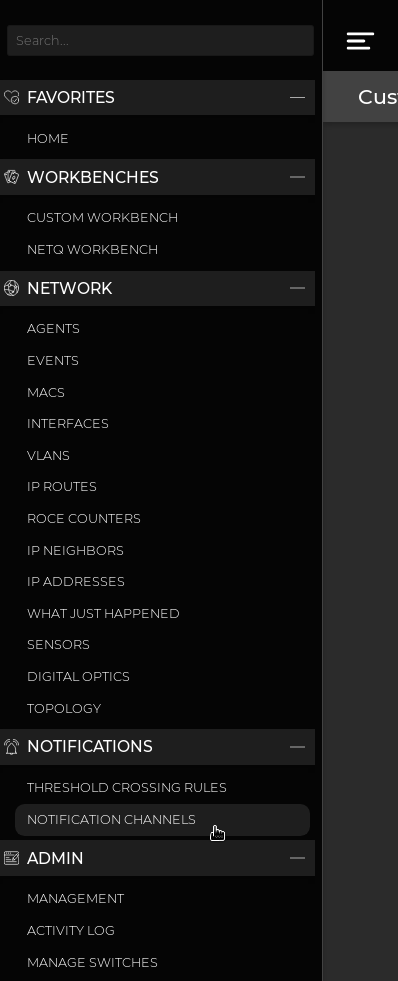
Main Menu
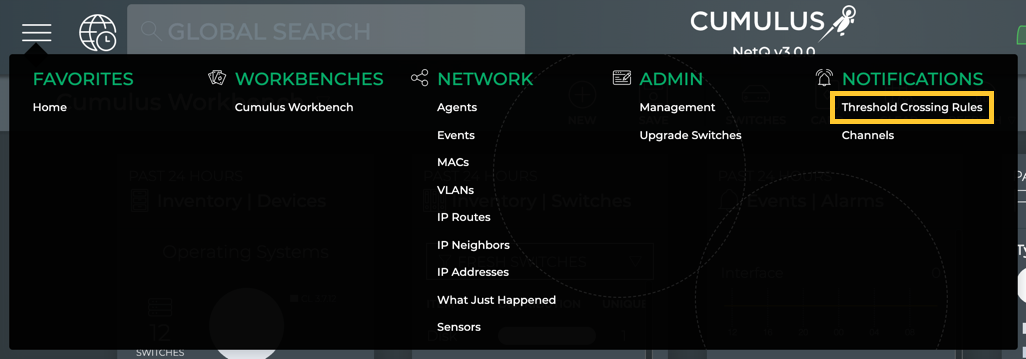
Found in the application header, click to open the main menu which provides navigation to:
Header
Menu
Search: a search bar to quickly find an item on the main menu
Favorites: contains link to the user-defined favorite workbenches; Home points to the NetQ Workbench until reset by a user
Workbenches: contains links to all workbenches
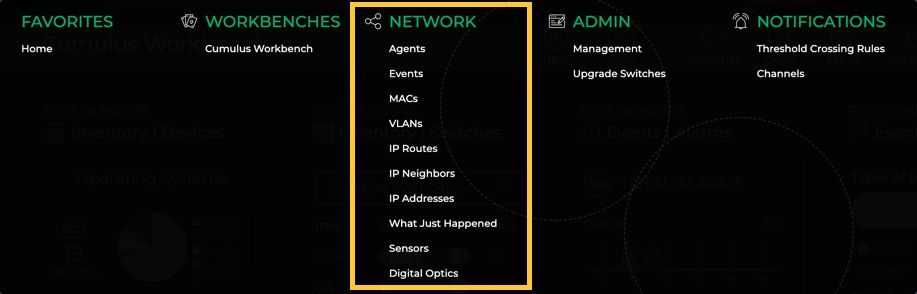
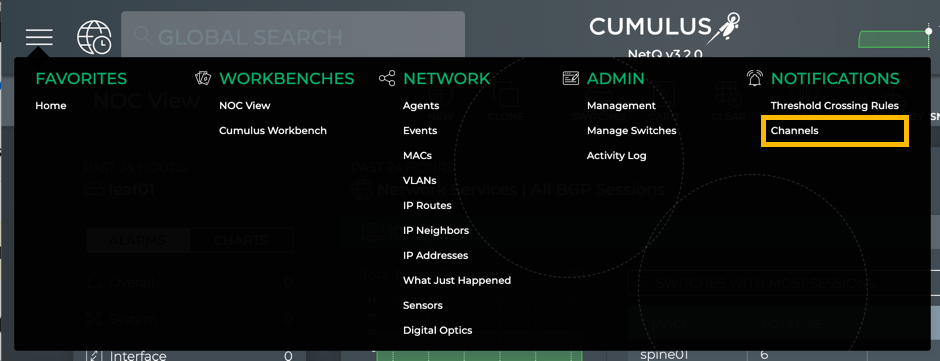
Network: contains links to tabular data about various network elements and the What Just Happened feature
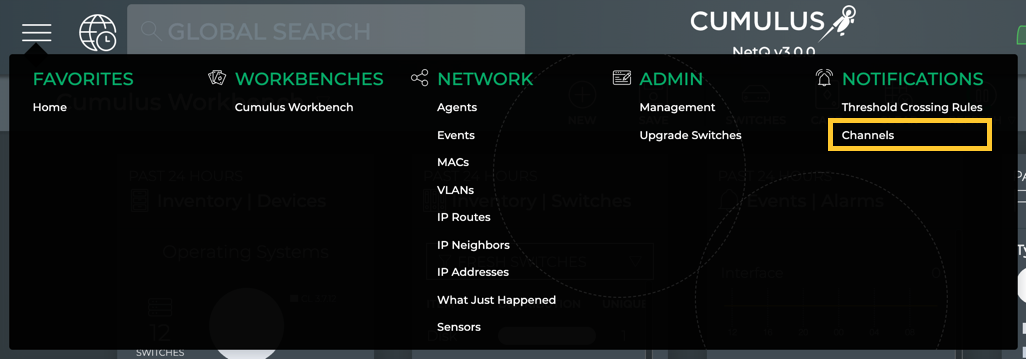
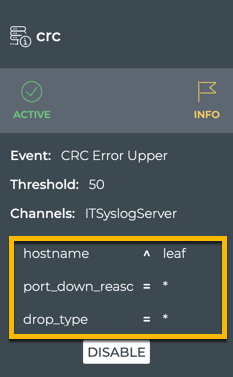
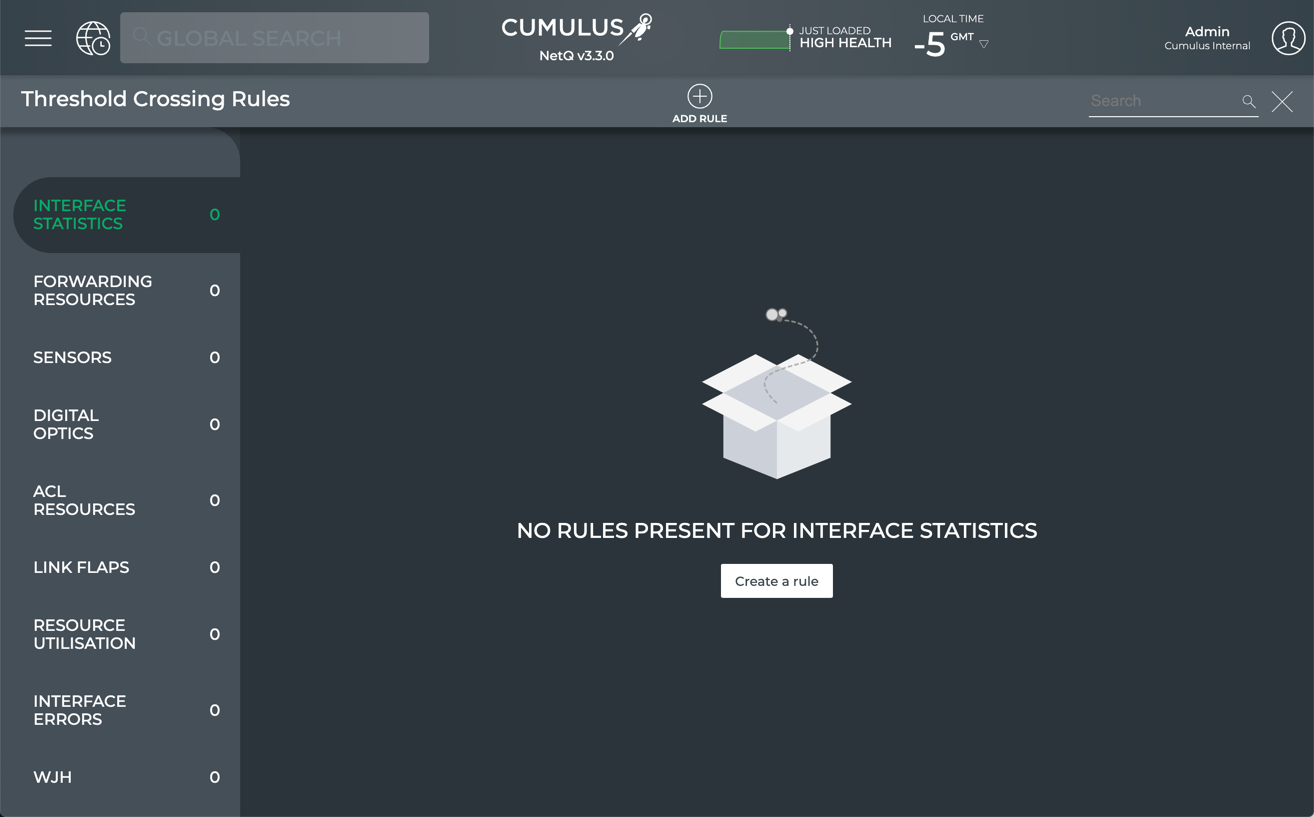
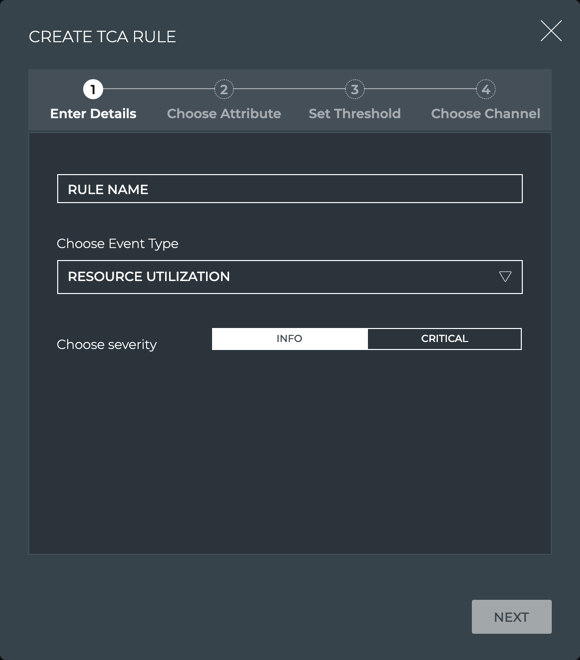
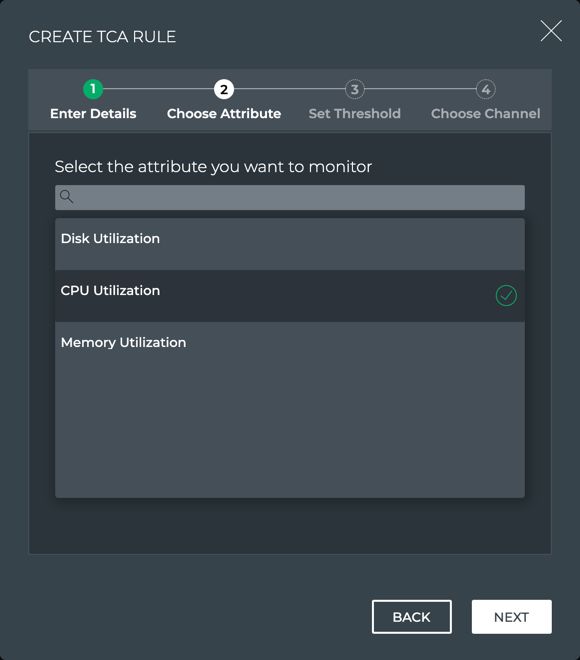
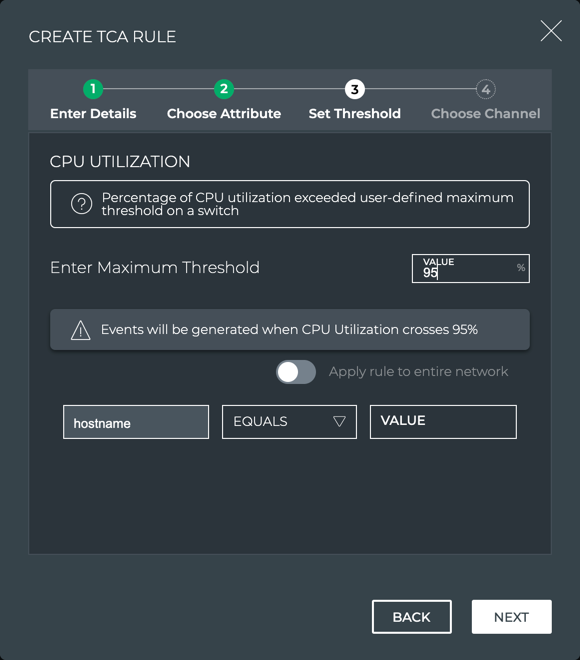
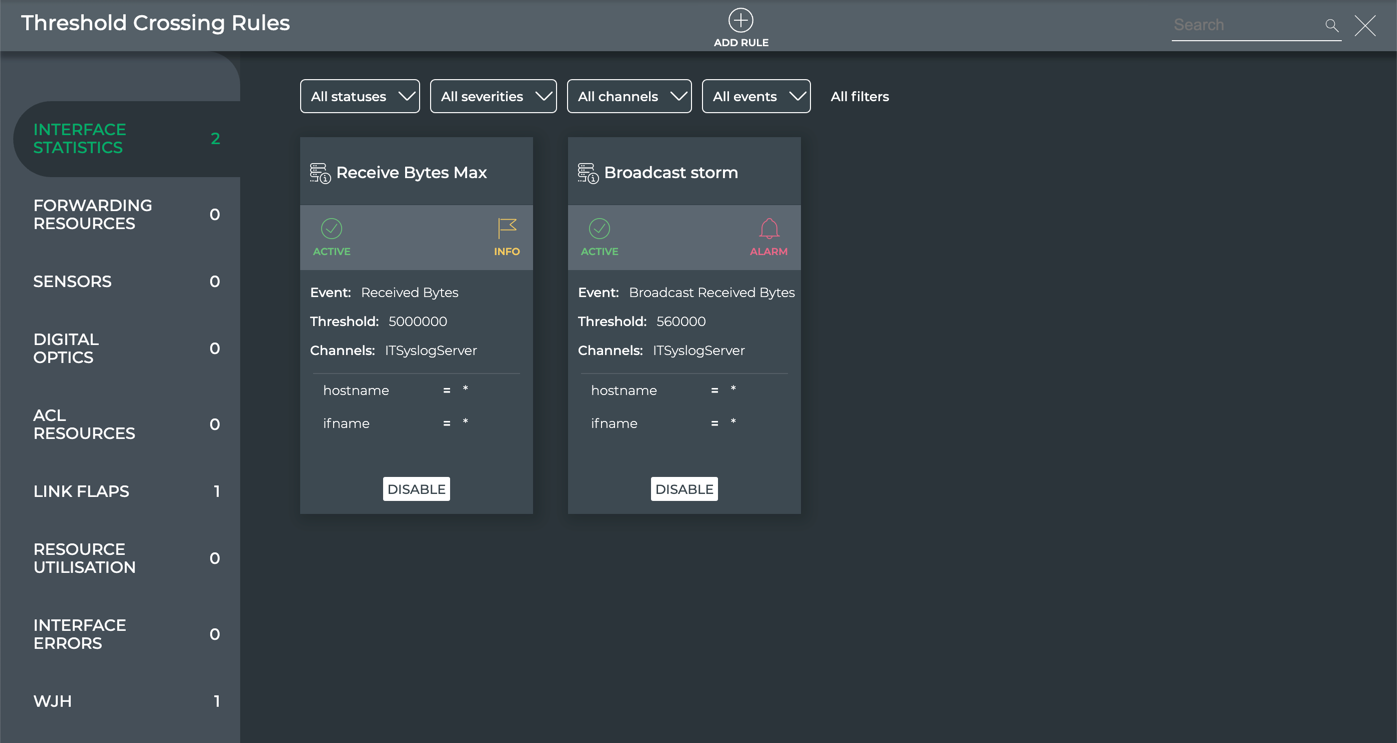
Notifications: contains link to threshold-based event rules and notification channel specifications
Admin: contains links to application management and lifecycle management features (only visible to users with Admin access role)
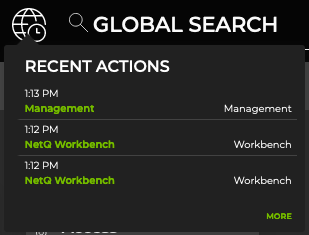
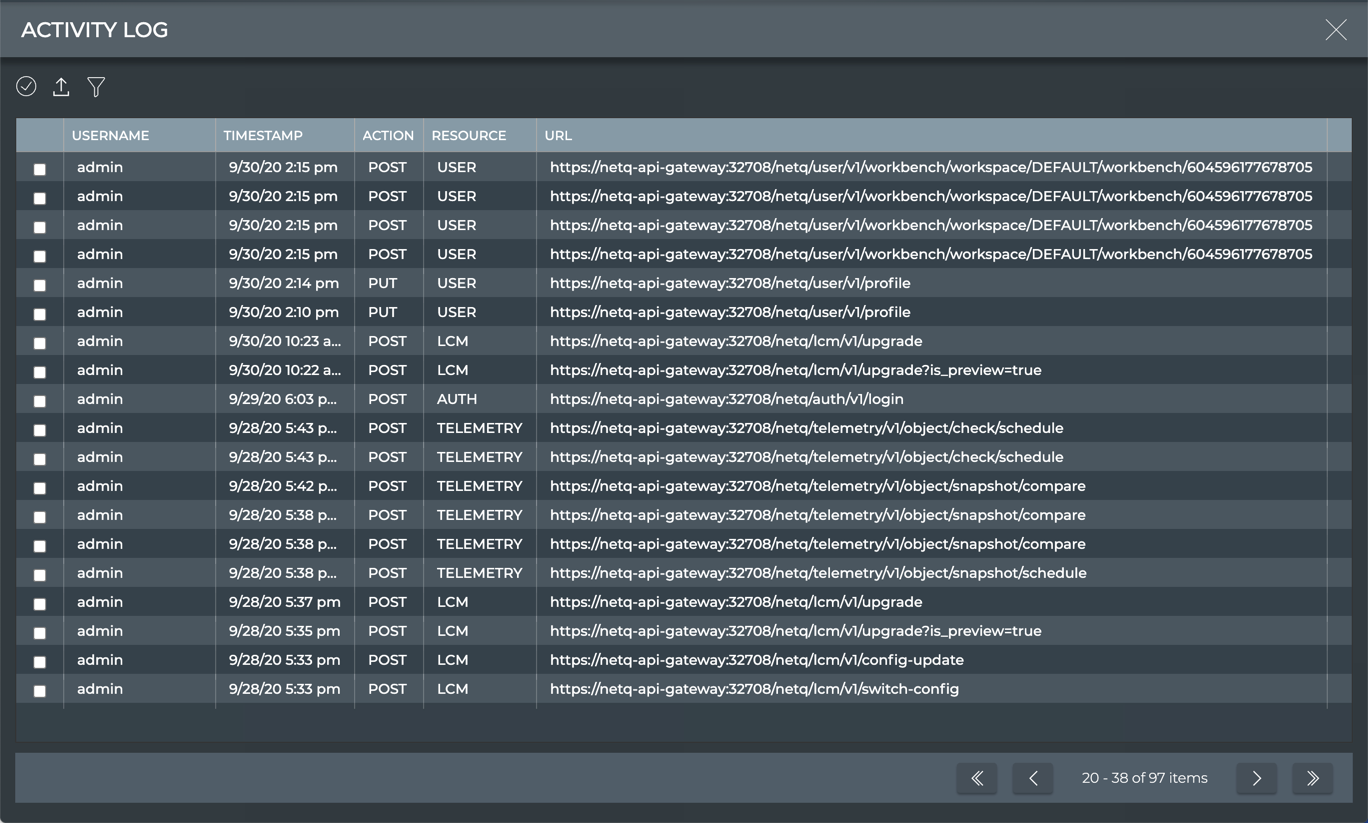
Recent Actions
Found in the header, Recent Actions keeps track of every action you take on your workbench and then saves each action with a timestamp. This enables you to go back to a previous state or repeat an action.
To open Recent Actions, click . Click on any of the actions to perform that action again.
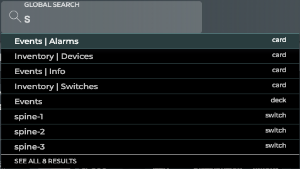
Search
The Global Search field in the UI header enables you to search for devices and cards. It behaves like most searches and can help you quickly find device information. For more detail on creating and running searches, refer to Create and Run Searches.
NVIDIA Logo
Clicking the NVIDIA logo takes you to your favorite workbench. For details about specifying your favorite workbench, refer to Set User Preferences.
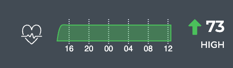
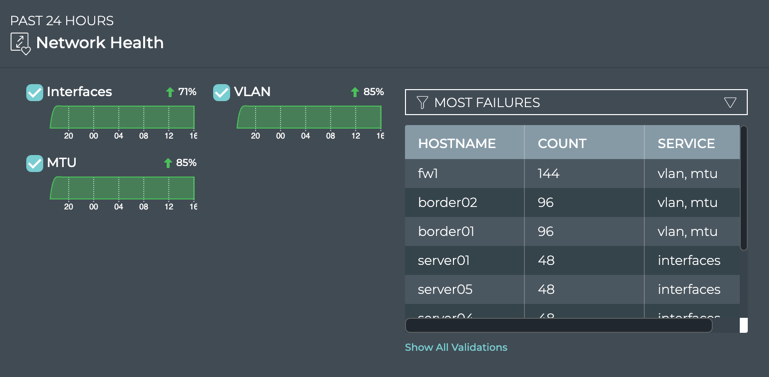
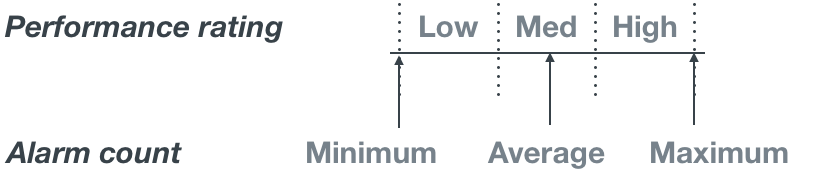
Quick Network Health View
Found in the header, the graph and performance rating provide a view into the health of your network at a glance.
On initial start up of the application, it can take up to an hour to reach an accurate health indication as some processes only run every 30 minutes.
Workbenches
A workbench is comprised of a given set of cards. A pre-configured default workbench, NetQ Workbench, is available to get you started. It contains Device Inventory, Switch Inventory, Alarm and Info Events, and Network Health cards. On initial login, this workbench opens. You can create your own workbenches and add or remove cards to meet your particular needs. For more detail about managing your data using workbenches, refer to Focus Your Monitoring Using Workbenches.
Cards
Cards present information about your network for monitoring and troubleshooting. This is where you can expect to spend most of your time. Each card describes a particular aspect of the network. Cards are available in multiple sizes, from small to full screen. The level of the content on a card varies in accordance with the size of the card, with the highest level of information on the smallest card to the most detailed information on the full-screen view. Cards are collected onto a workbench where you see all of the data relevant to a task or set of tasks. You can add and remove cards from a workbench, move between cards and card sizes, and make copies of cards to show different levels of data at the same time. For details about working with cards, refer to Access Data with Cards.
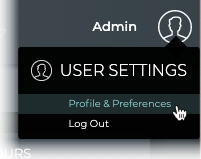
User Settings
Each user can customize the NetQ application display, time zone and date format; change their account password; and manage their workbenches. This is all performed from User Settings > Profile & Preferences. For details, refer to Set User Preferences.
Format Cues
Color is used to indicate links, options, and status within the UI.
Item
Color
Hover on item
Green, gray or blue
Clickable item
Black
Selected item
Green
Highlighted item
Green
Link
Green or white
Good/Successful results
Green
Result with critical severity event
Pink
Result with high severity event
Red
Result with medium severity event
Orange
Result with low severity event
Yellow
Create and Run Searches
The Global Search field in the UI header enables you to search for devices or cards. You can create new searches or run existing searches.
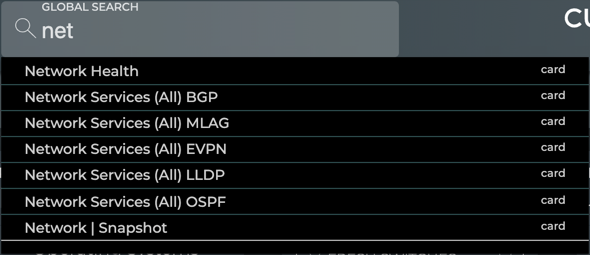
Create a Search
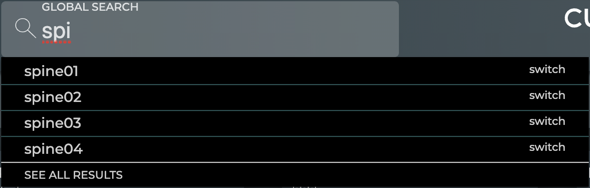
As with most search fields, you begin by entering the criteria in the search field. As you type, items that match the search criteria appear in the search history dropdown along with the last time the search ran. Wildcards are not allowed, but this predictive matching eliminates the need for them. By default, the most recent searches appear. If you perform more searches, you can access them. This provides a quicker search by reducing entry specifics and suggesting recent searches. Selecting a suggested search from the list provides a preview of the search results to the right.
To create a new search:
Click in the Global Search field.
Enter your search criteria.
Click the device hostname or card workflow in the search list to open the associated information.
If you have more matches than fit in the window, click the See All # Results link to view all found matches. The count represents the number of devices found. It does not include cards found.
Focus Your Monitoring Using Workbenches
Workbenches are an integral structure of the NetQ UI. They are where you collect and view the data that is important to you.
Two types of workbenches are available:
Default: Provided by NVIDIA for use as they exist; you cannot save changes you make to these workbenches
Custom: Created by users when default workbenches need some adjustments to better meet your needs or you want a completely different collection of cards; changes made to these workbenches are saved automatically
Both types of workbenches display a set of cards. Default workbenches are public (available for viewing by all users), whereas custom workbenches are private (only viewable by the user who created them).
Default Workbenches
In this release, only one default workbench — the NetQ Workbench — is available to get you started. It contains Device Inventory, Switch Inventory, Alarm and Info Events, and Network Health cards, giving you a high-level view of how your network is operating.
On initial login, the NetQ Workbench opens. On subsequent logins, the last workbench you used opens.
Custom Workbenches
Users with either administrative or user roles can create and save as many custom workbenches as suits their needs. For example, a user might create a workbench that:
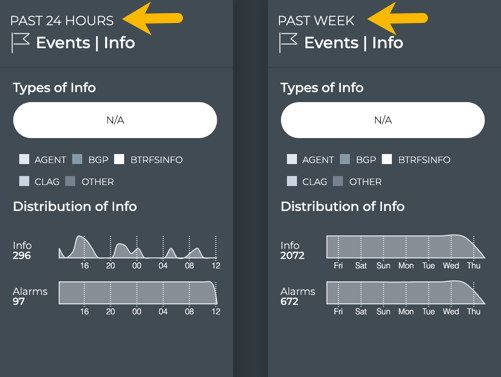
Shows all of the selected cards for the past week and one that shows all of the selected cards for the past 24 hours
Only has data about your virtual overlays; EVPN plus events cards
Has selected switches that you are troubleshooting
Focused on application or user account management
And so forth.
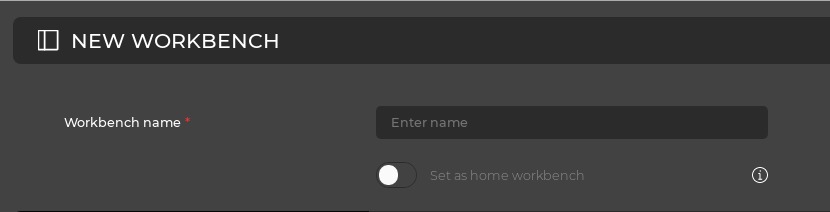
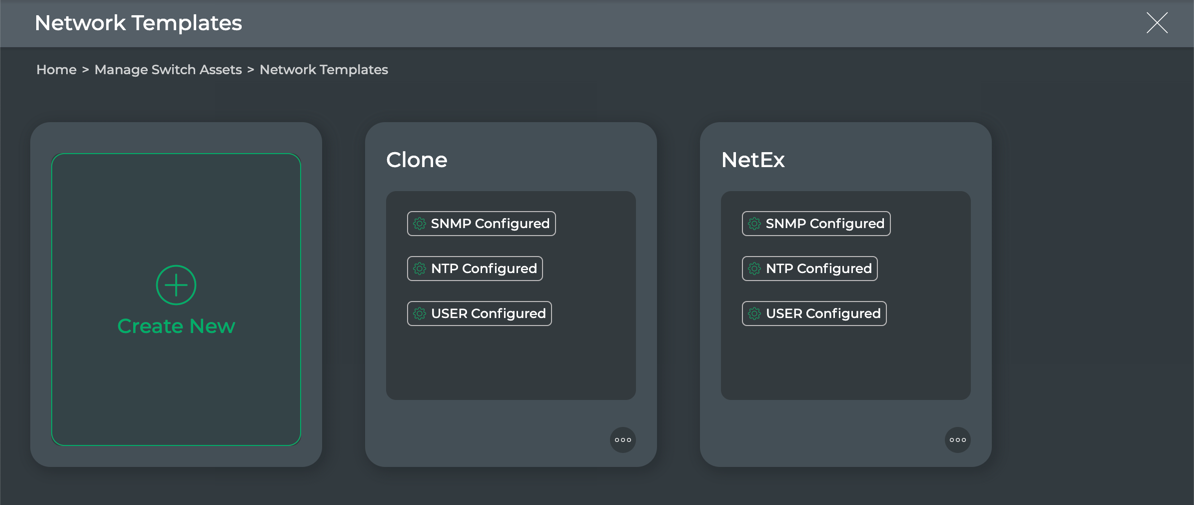
Create a Workbench
To create a workbench:
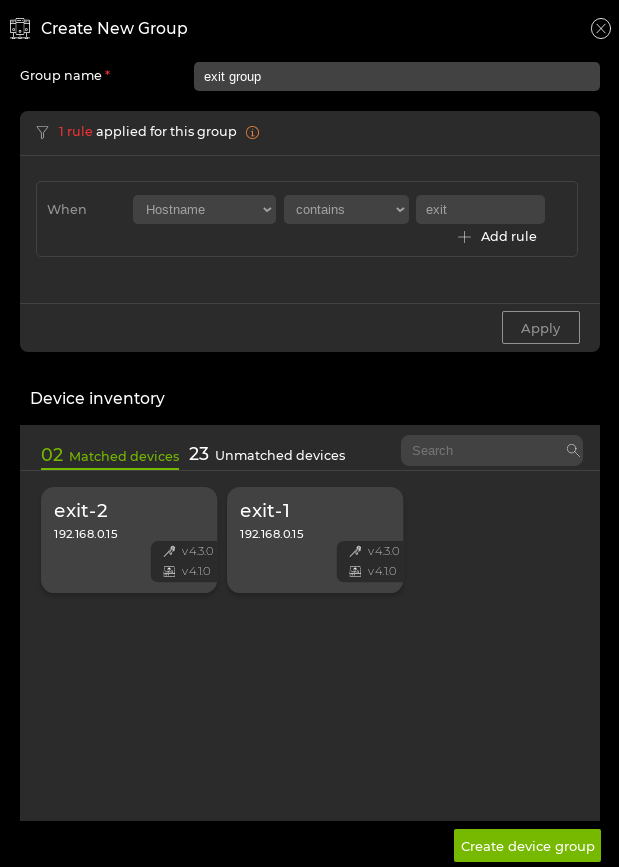
Click in the workbench header.
Enter a name for the workbench.
Click “Set as home workbench” if you would like to set this as your new default home workbench.
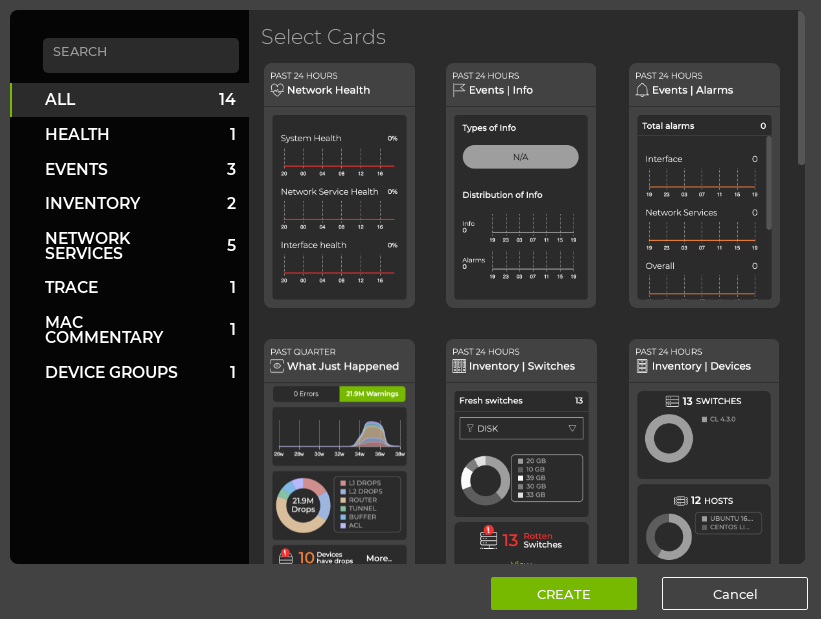
Select the cards you would like to display on your new workbench by clicking on the desired cards:
Click Create to create your new workbench.
Refer to Access Data with Cards for information about interacting with cards on your workbenches.
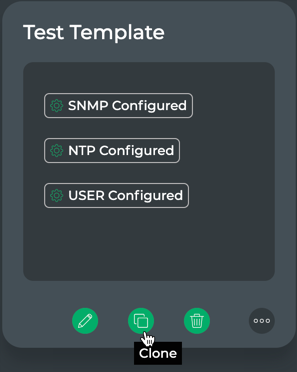
Clone a Workbench
To create a duplicate clone based on an existing workbench:
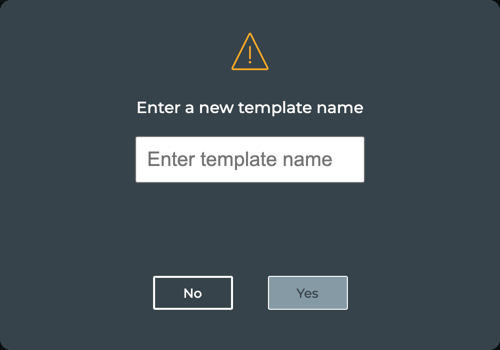
Click in the workbench header.
Set a name for the cloned workbench.
Click “set as home workbench” if you would like to set this as your new default home workbench.
Click Clone to clone the workbench.
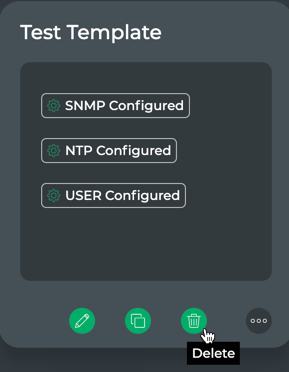
Remove a Workbench
Once you have created a number of custom workbenches, you might find that you no longer need some of them. As an administrative user, you can remove any workbench, except for the default NetQ Workbench. Users with a user role can only remove workbenches they have created.
To remove a workbench:
Click in the application header to open the User Settings options.
Click Profile & Preferences.
Locate the Workbenches card.
Hover over the workbench you want to remove, and click Delete.
Open an Existing Workbench
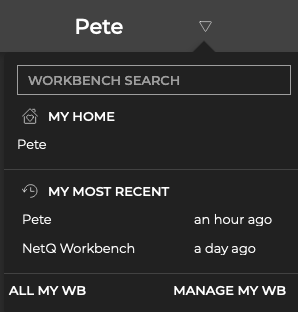
There are several options for opening workbenches:
Open through the Workbench header
Click next to the current workbench name and locate the workbench
Under My Home, click the name of your favorite workbench
Under My Most Recent, click the workbench if in list
Search by workbench name
Click All My WB to open all workbenches and select it from the list
Open through the main menu
Click (main menu) and select the workbench from the Favorites or NetQ columns
Open through the NVIDIA logo
Click the logo in the header to open your favorite workbench
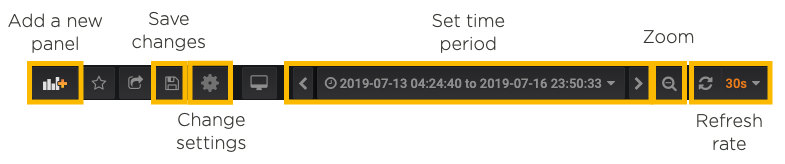
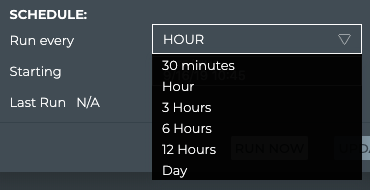
Manage Auto-refresh for Your Workbenches
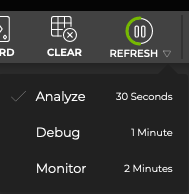
You can specify how often to update the data displayed on your workbenches. Three refresh rates are available:
Analyze: updates every 30 seconds
Debug: updates every minute
Monitor: updates every two (2) minutes
By default, auto-refresh is enabled and configured to update every 30 seconds.
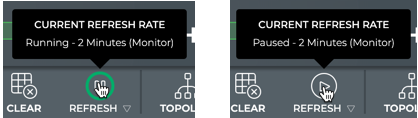
Disable/Enable Auto-refresh
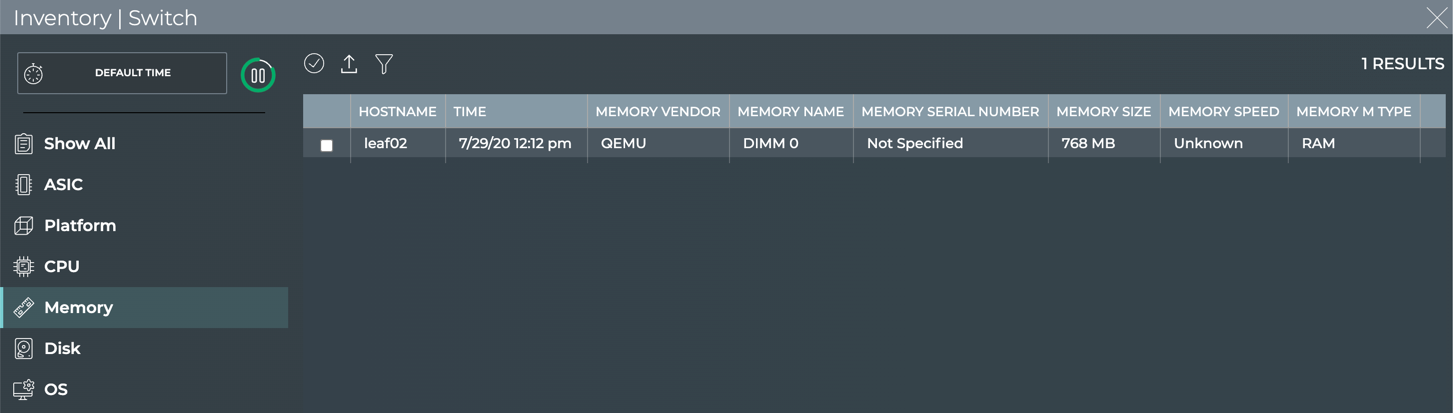
To disable or pause auto-refresh of your workbenches, click the Refresh icon. This toggles between the two states, Running and Paused, where indicates it is currently disabled and indicates it is currently enabled.
While having the workbenches update regularly is good most of the time, you might find that you want to pause the auto-refresh feature when you are troubleshooting and you do not want the data to change on a given set of cards temporarily. In this case, you can disable the auto-refresh and then enable it again when you are finished.
View Current Settings
To view the current auto-refresh rate and operational status, hover over the Refresh icon on a workbench header, to open the tool tip as follows:
Change Settings
To modify the auto-refresh setting:
Click the Refresh icon.
Select the refresh rate you want. The refresh rate is applied immediately. A check mark is shown next to the current selection.
Manage Workbenches
To manage your workbenches as a group, either:
Click next to the current workbench name, then click Manage My WB.
Click , select Profiles & Preferences.
Both of these open the Profiles & Preferences page. Look for the Workbenches card and refer to Manage Your Workbenches for more information.
Access Data with Cards
Cards present information about your network for monitoring and troubleshooting. This is where you can expect to spend most of your time. Each card describes a particular aspect of the network. Cards are available in multiple sizes, from small to full screen. The level of the content on a card varies with the size of the card, with the highest level of information on the smallest card to the most detailed information on the full-screen card. Cards are collected onto a workbench where you see all the data relevant to a task or set of tasks. You can add and remove cards from a workbench, move between cards and card sizes, change the time period of the data shown on a card, and make copies of cards to show different levels of data at the same time.
Card Sizes
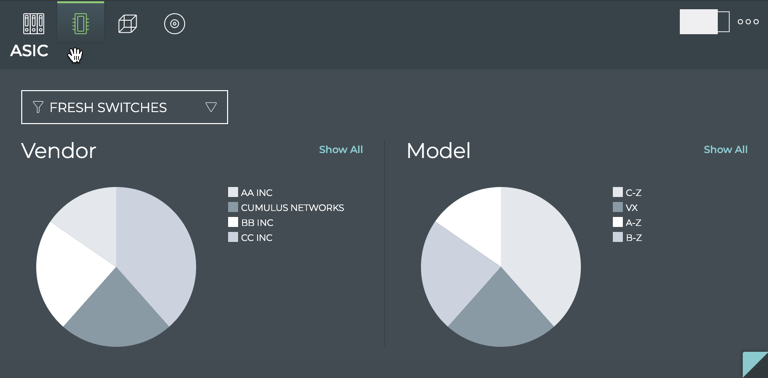
The various sizes of cards enable you to view your content at just the right level. For each aspect that you are monitoring there is typically a single card that presents increasing amounts of data over its four sizes. For example, a snapshot of your total inventory might be sufficient, but to monitor the distribution of hardware vendors might require a bit more space.
Card Size Summary
Card Size
Small
Medium
Large
Full Screen
Primary Purpose
Quick view of status, typically at the level of good or bad
Enable quick actions, run a validation or trace for example
View key performance parameters or statistics
Perform an action
Look for potential issues
View detailed performance and statistics
Perform actions
Compare and review related information
View all attributes for given network aspect
Free-form data analysis and visualization
Export data to third-party tools
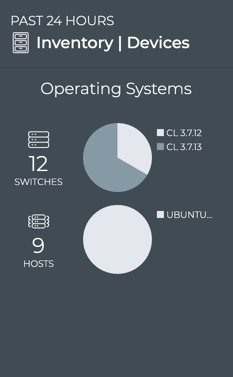
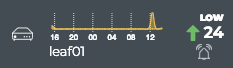
Small Cards
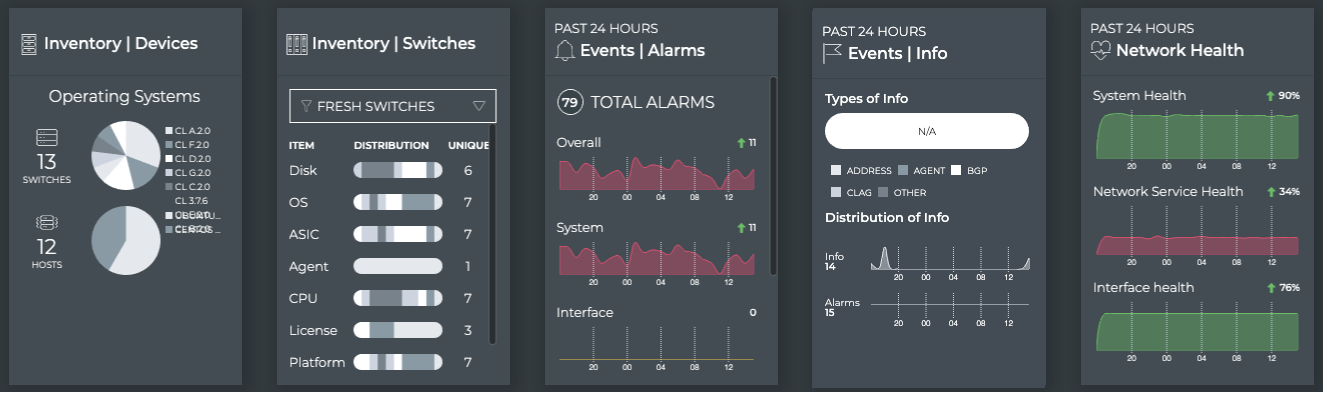
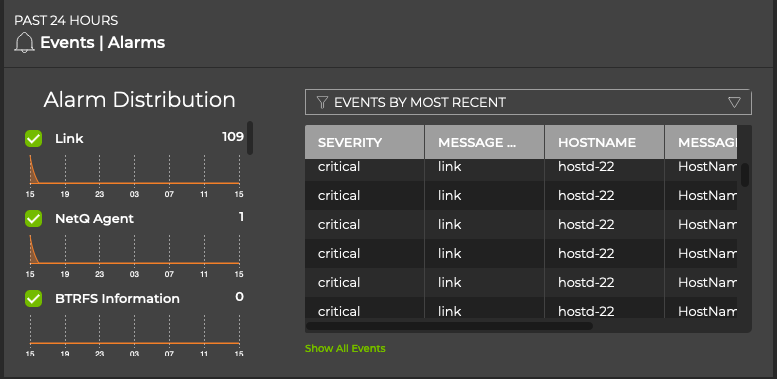
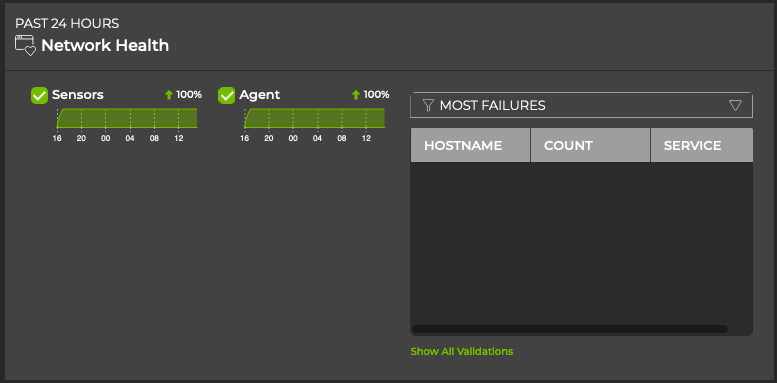
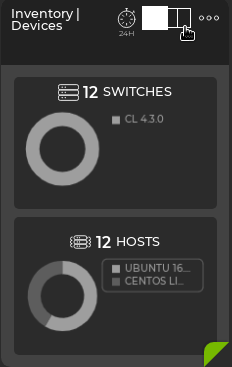
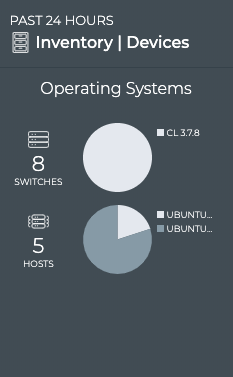
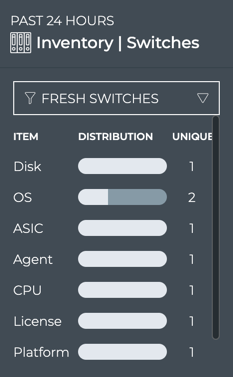
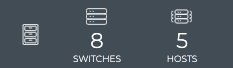
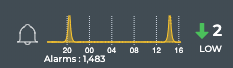
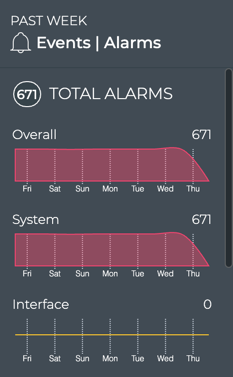
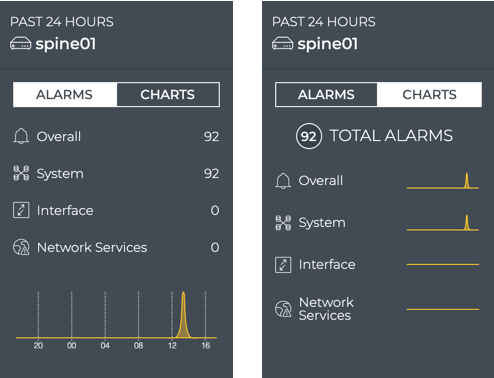
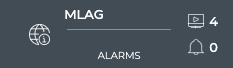
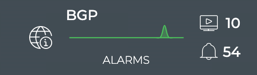
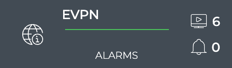
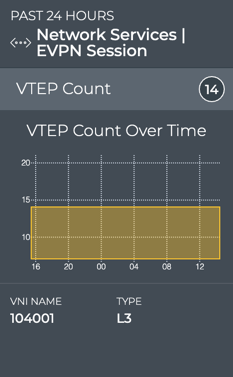
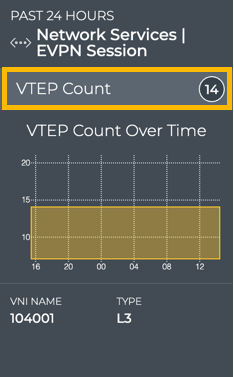
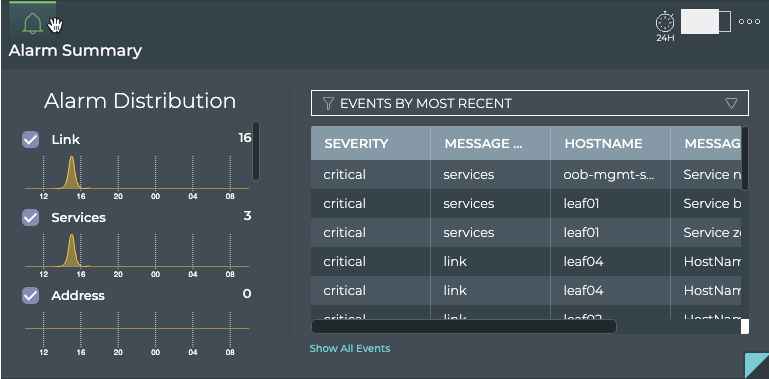
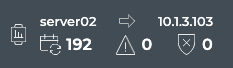
Small cards are most effective at providing a quick view of the performance or statistical value of a given aspect of your network. They commonly comprise an icon to identify the aspect being monitored, summary performance or statistics in the form of a graph and/or counts, and often an indication of any related events. Other content items might be present. Some examples include a Devices Inventory card, a Switch Inventory card, an Alarm Events card, an Info Events card, and a Network Health card, as shown here:
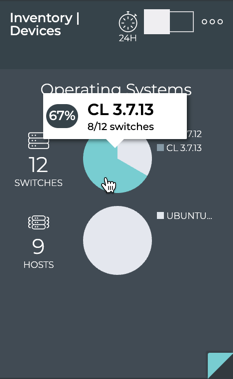
Medium Cards
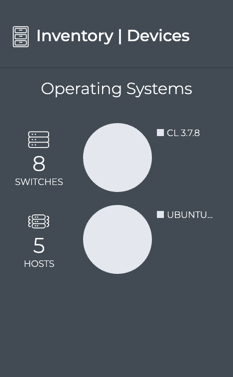
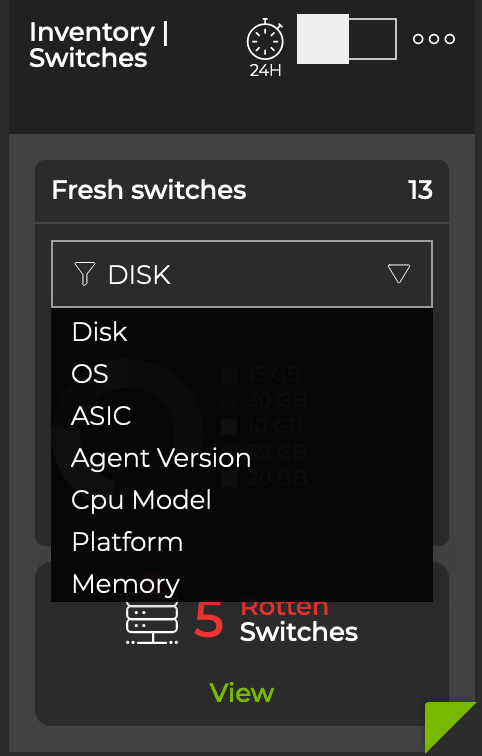
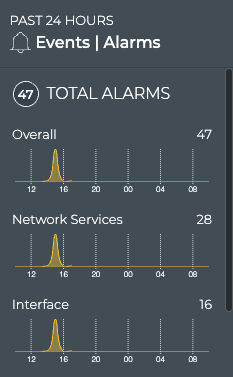
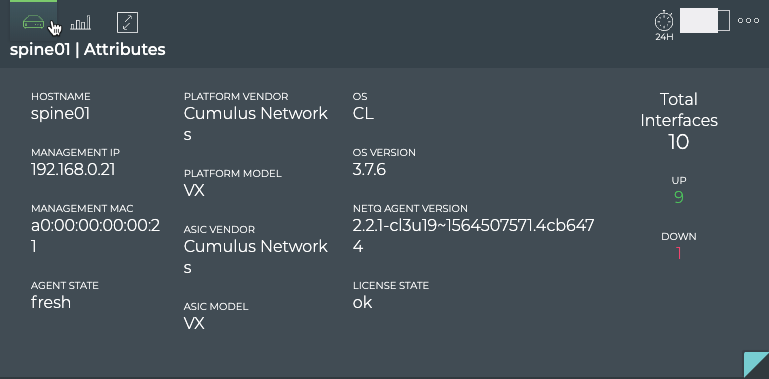
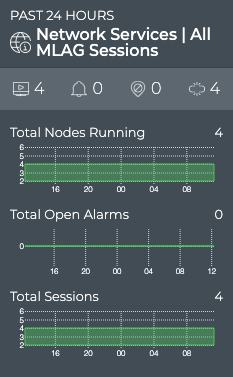
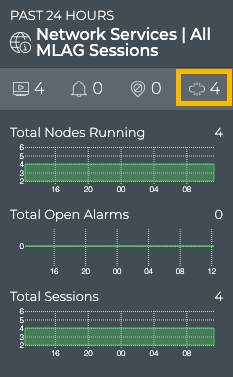
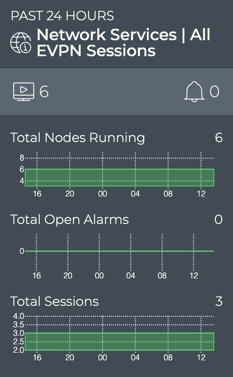
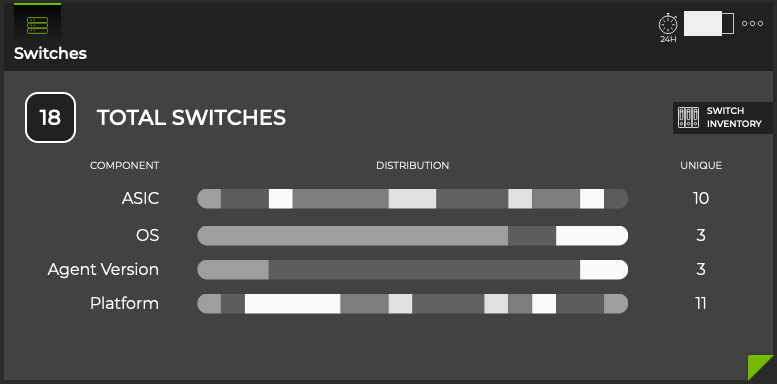
Medium cards are most effective at providing the key measurements for a given aspect of your network. They are commonly comprised of an icon to identify the aspect being monitored, one or more key measurements that make up the overall performance. Often additional information is also included, such as related events or components. Some examples include a Devices Inventory card, a Switch Inventory card, an Alarm Events card, an Info Events card, and a Network Health card, as shown here. Compare these with their related small- and large-sized cards.
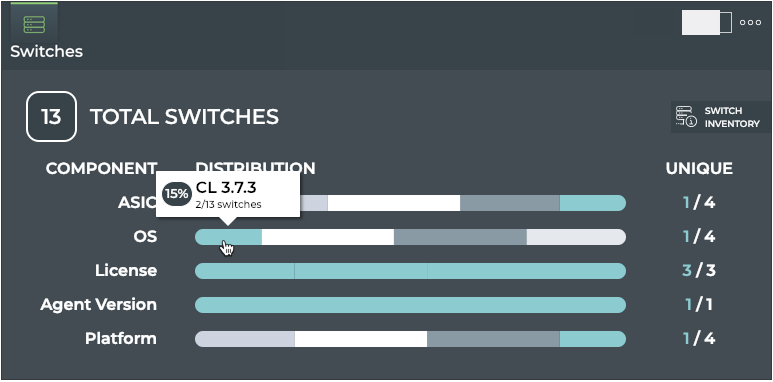
Large Cards
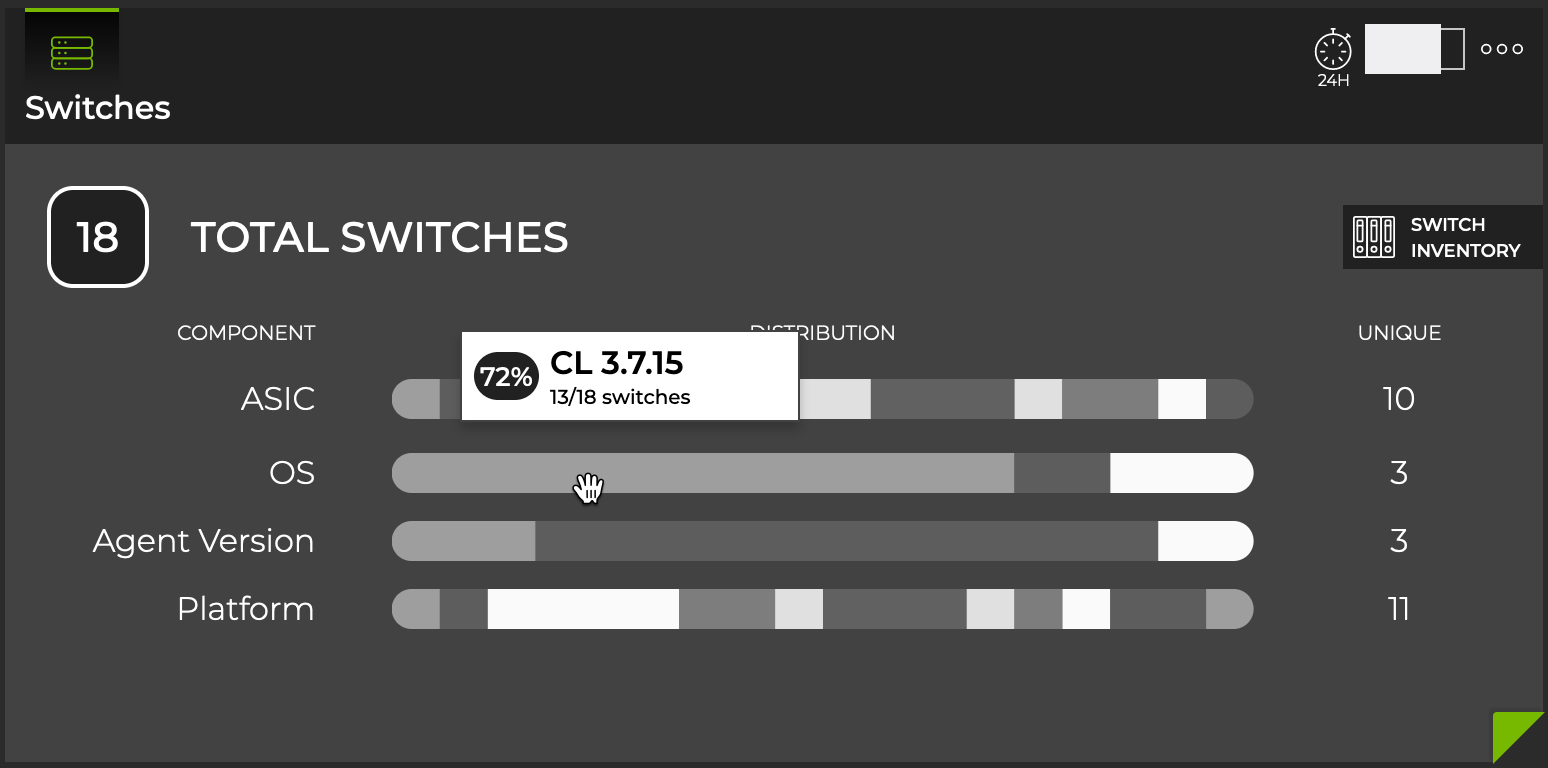
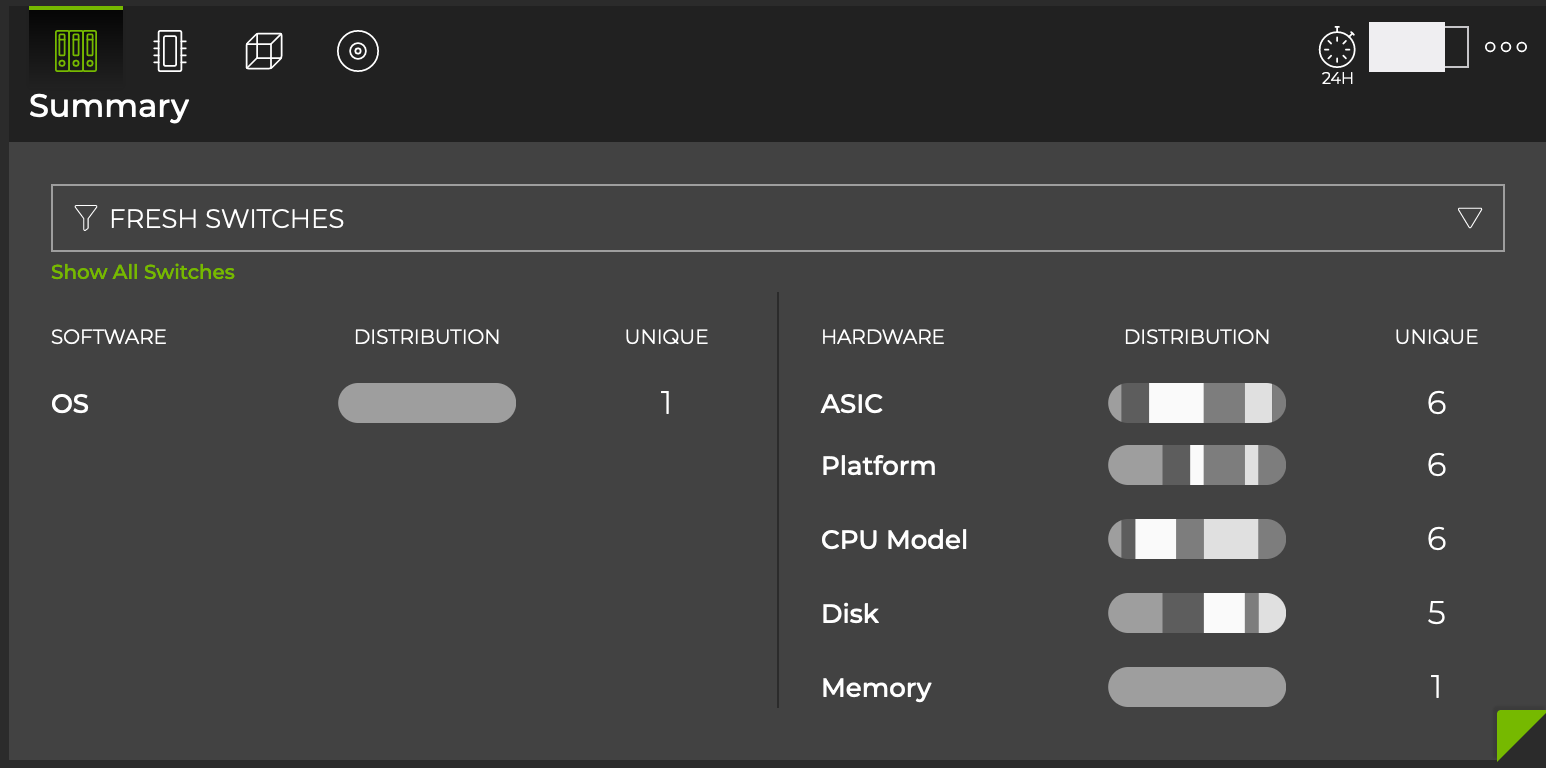
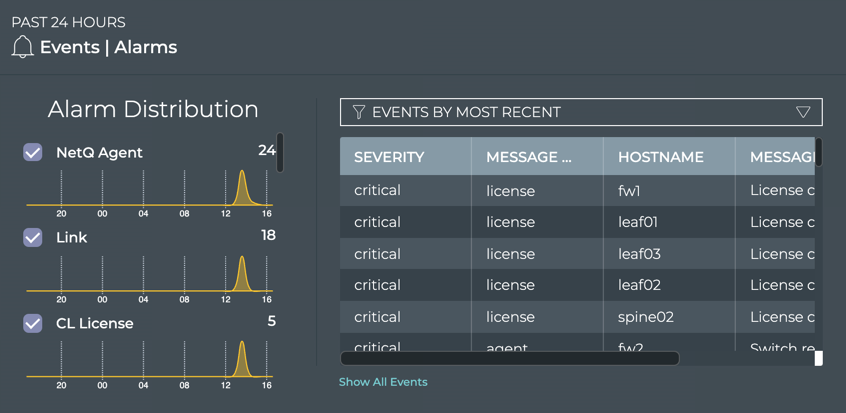
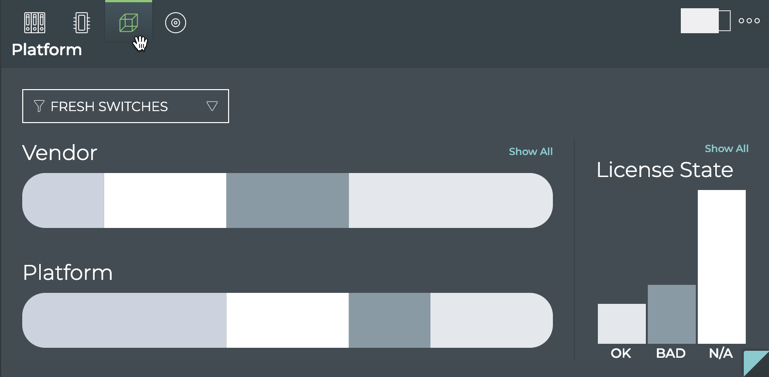
Large cards are most effective at providing the detailed information for monitoring specific components or functions of a given aspect of your network. These can aid in isolating and resolving existing issues or preventing potential issues. They are commonly comprised of detailed statistics and graphics. Some large cards also have tabs for additional detail about a given statistic or other related information. Some examples include a Devices Inventory card, an Alarm Events card, and a Network Health card, as shown here. Compare these with their related small- and medium-sized cards.
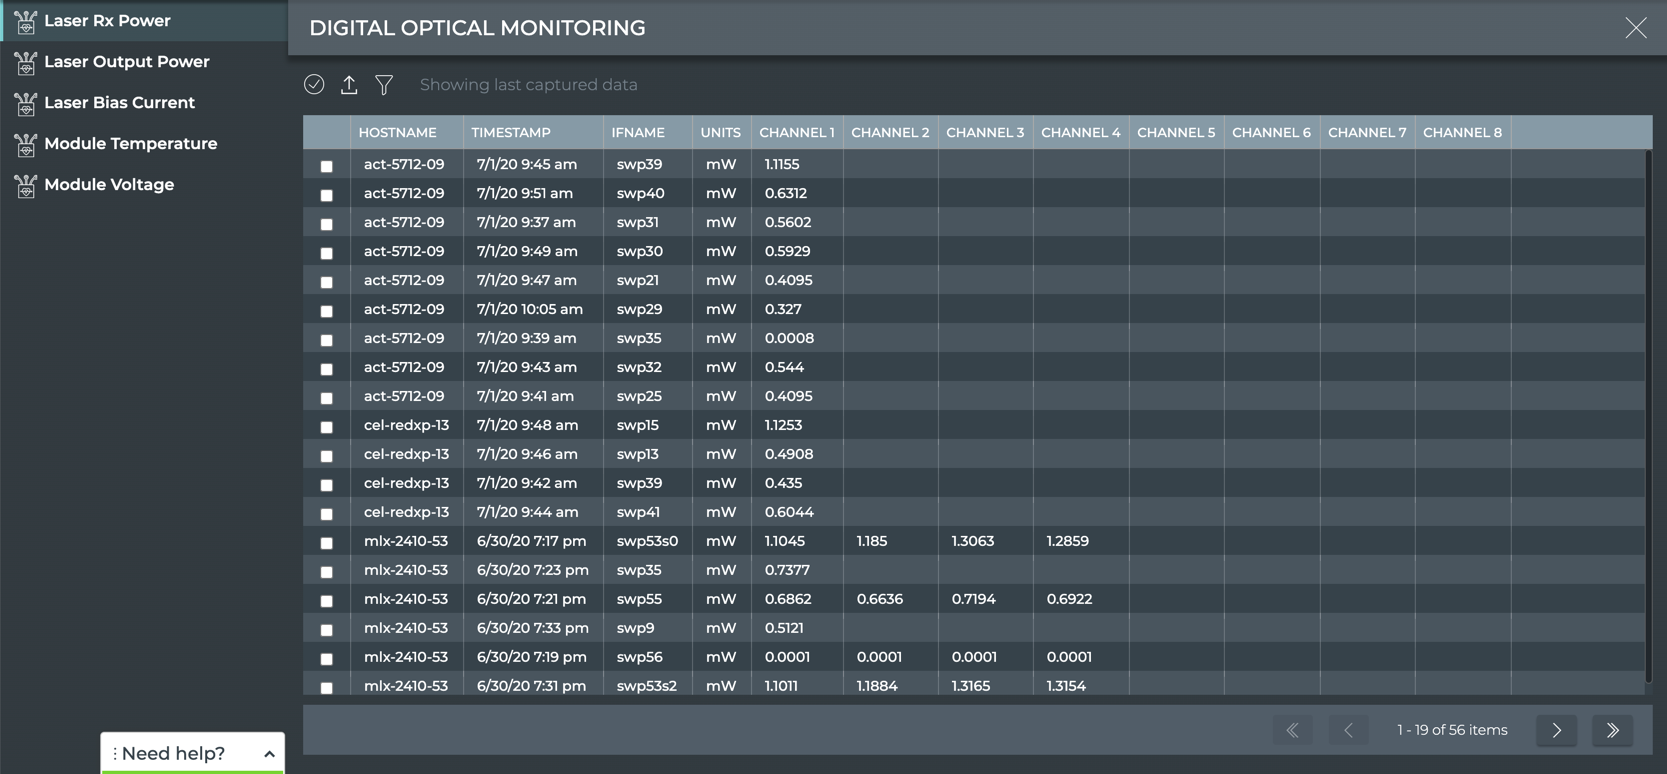
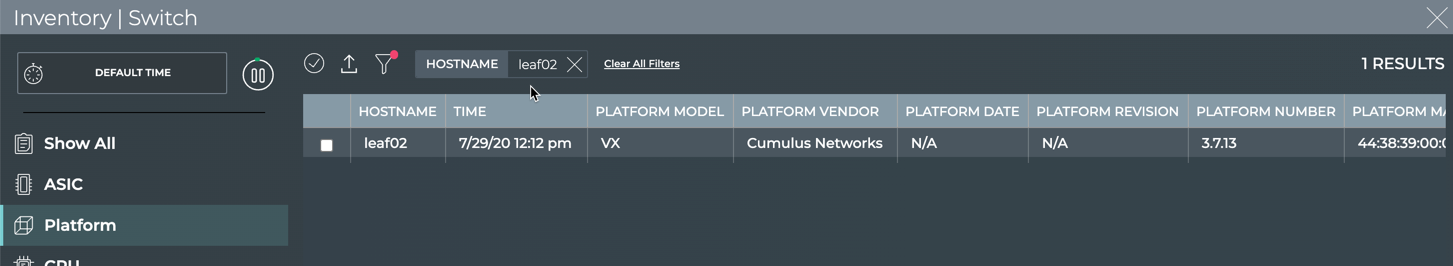
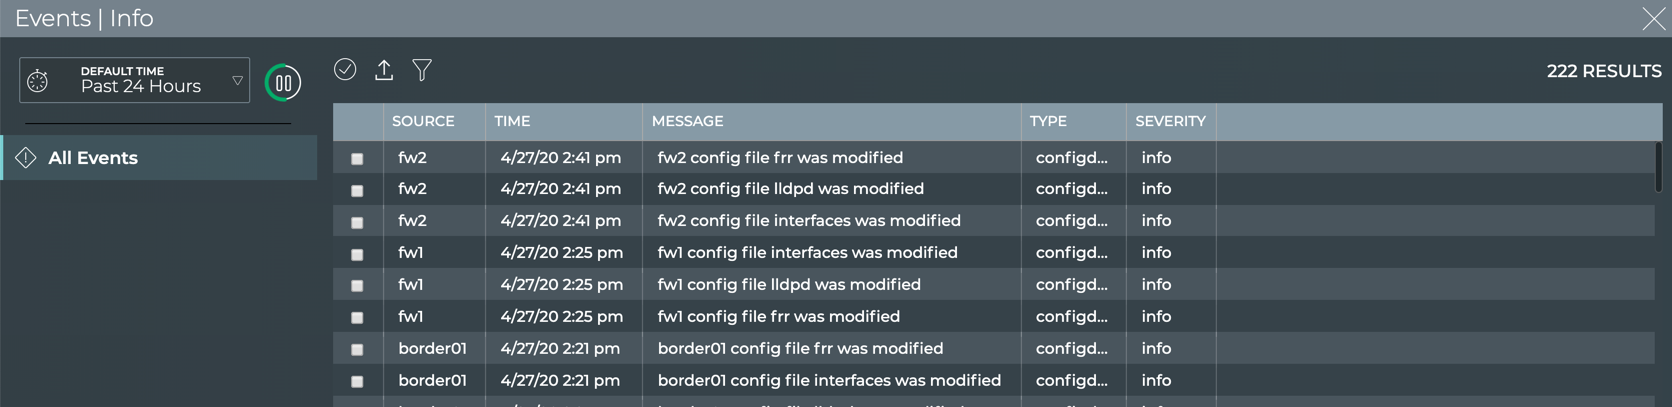
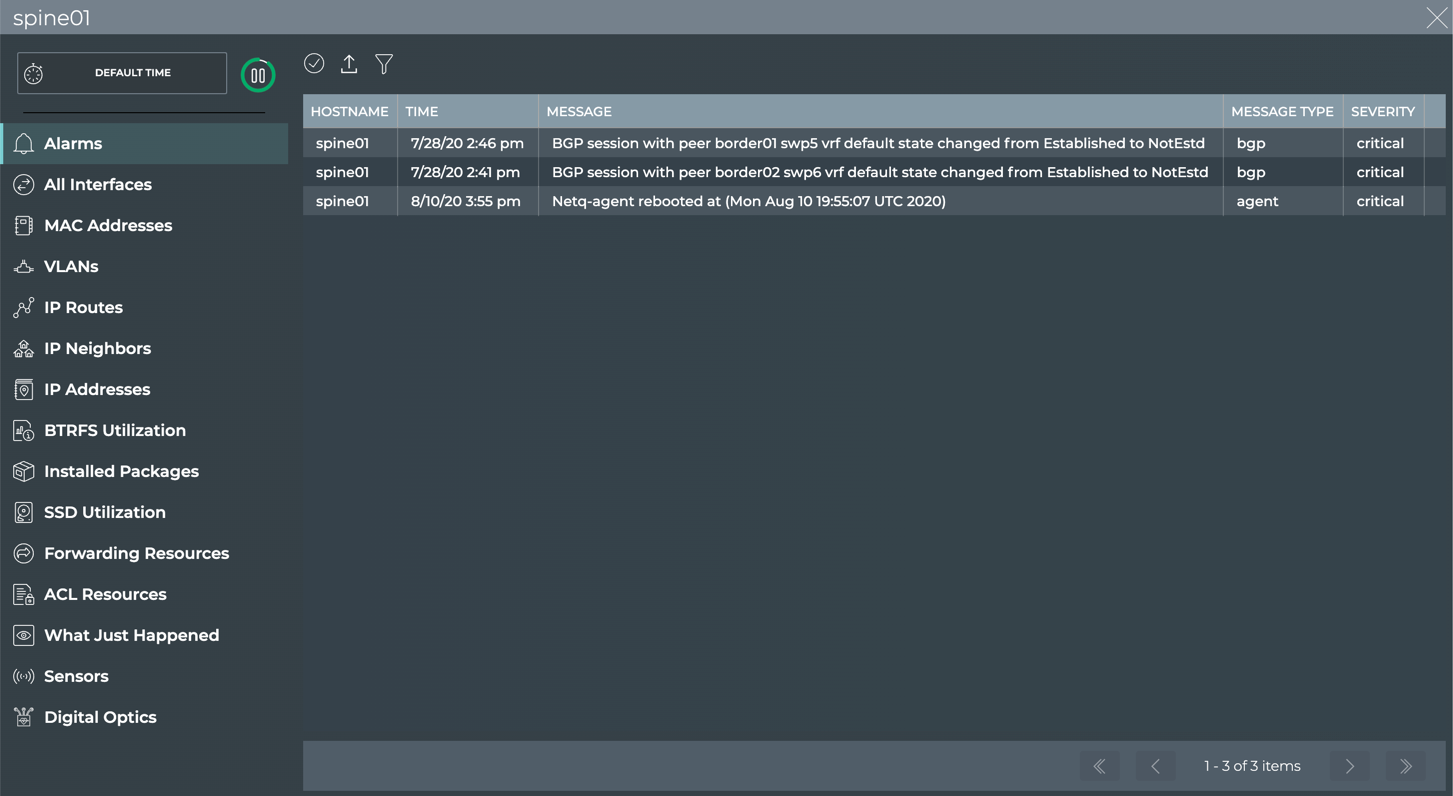
Full-Screen Cards
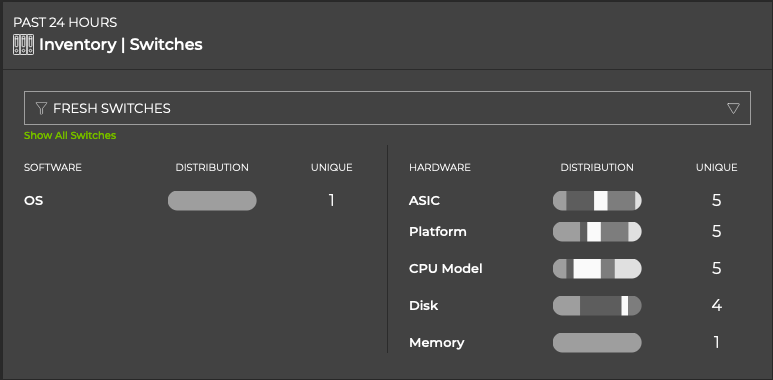
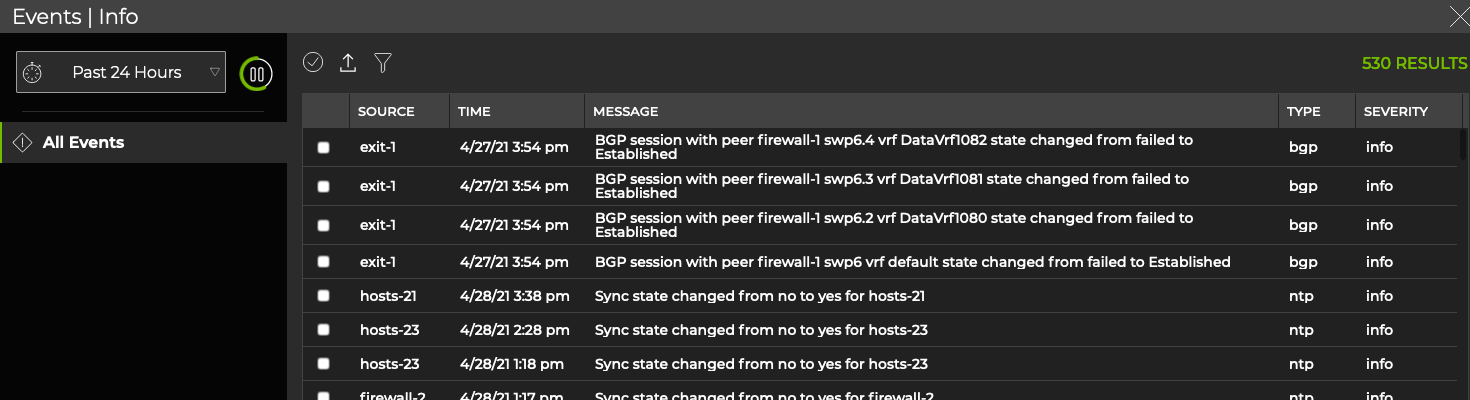
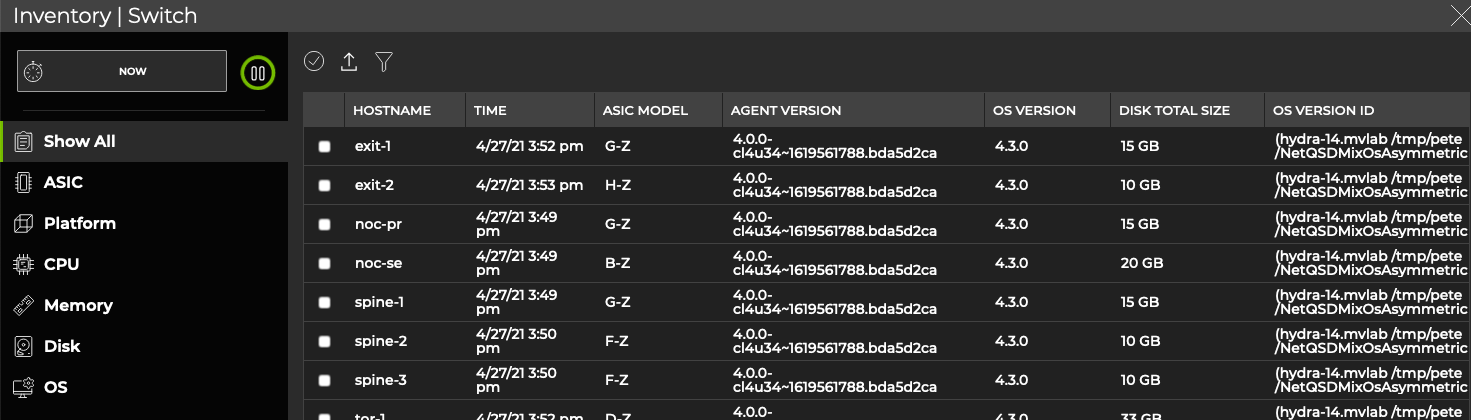
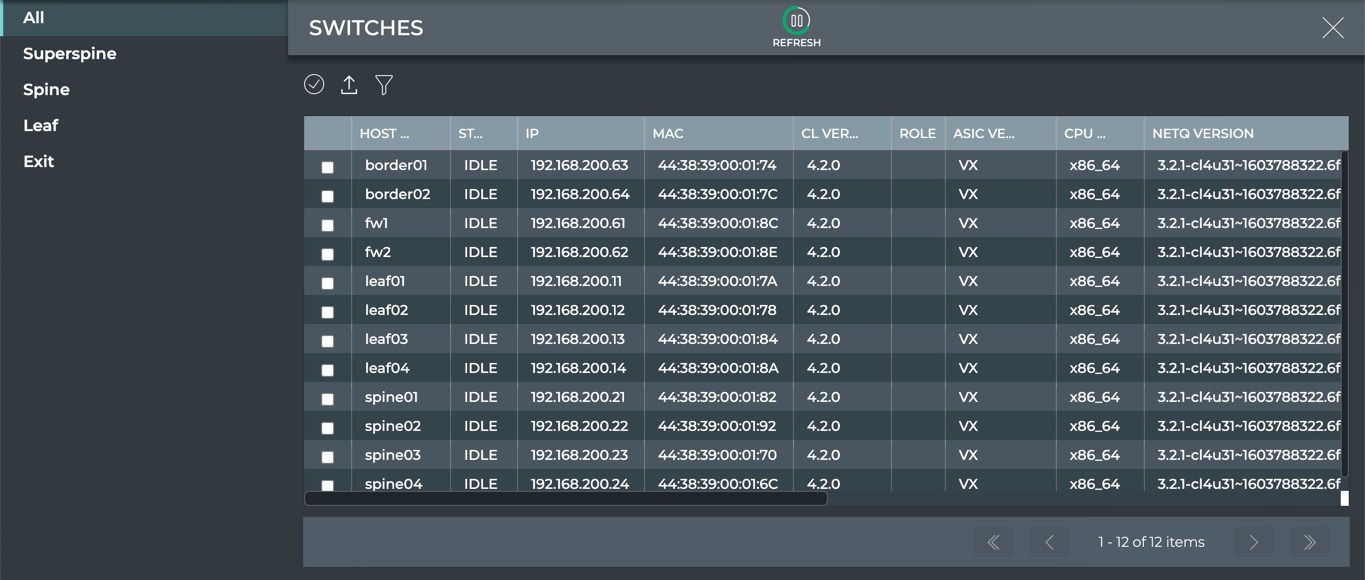
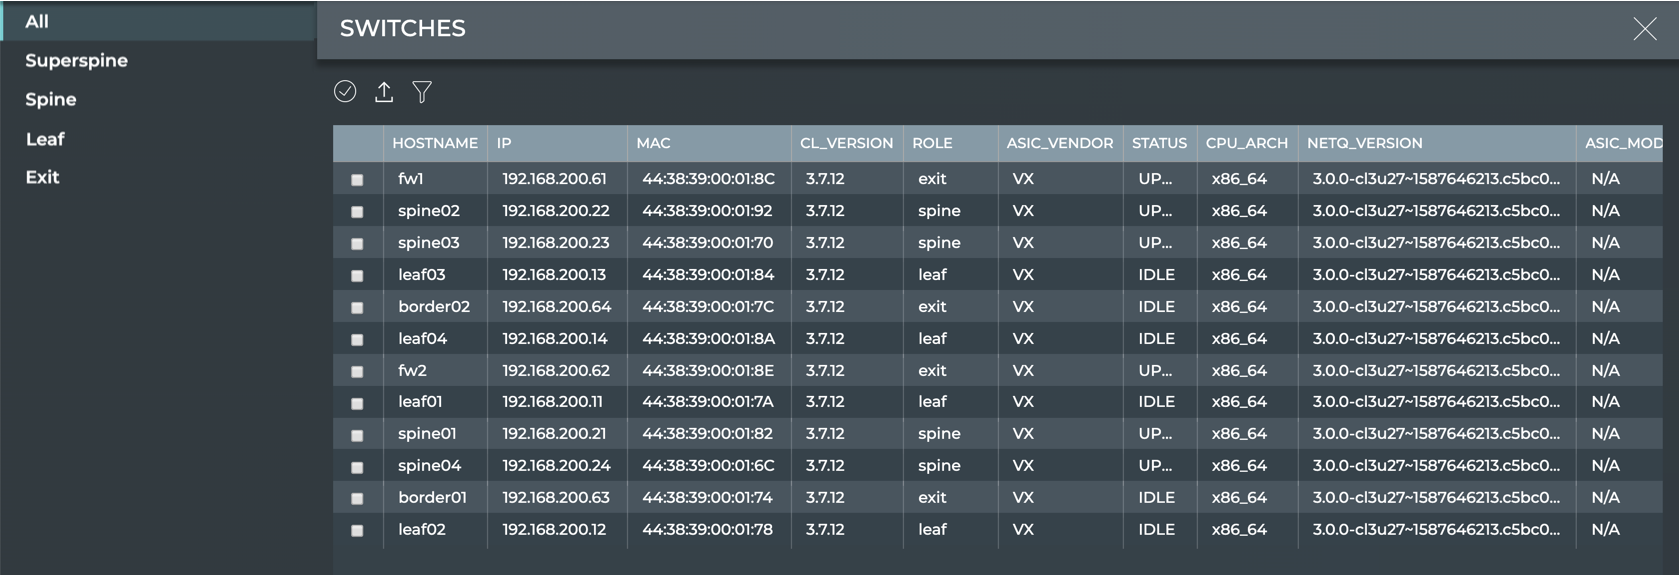
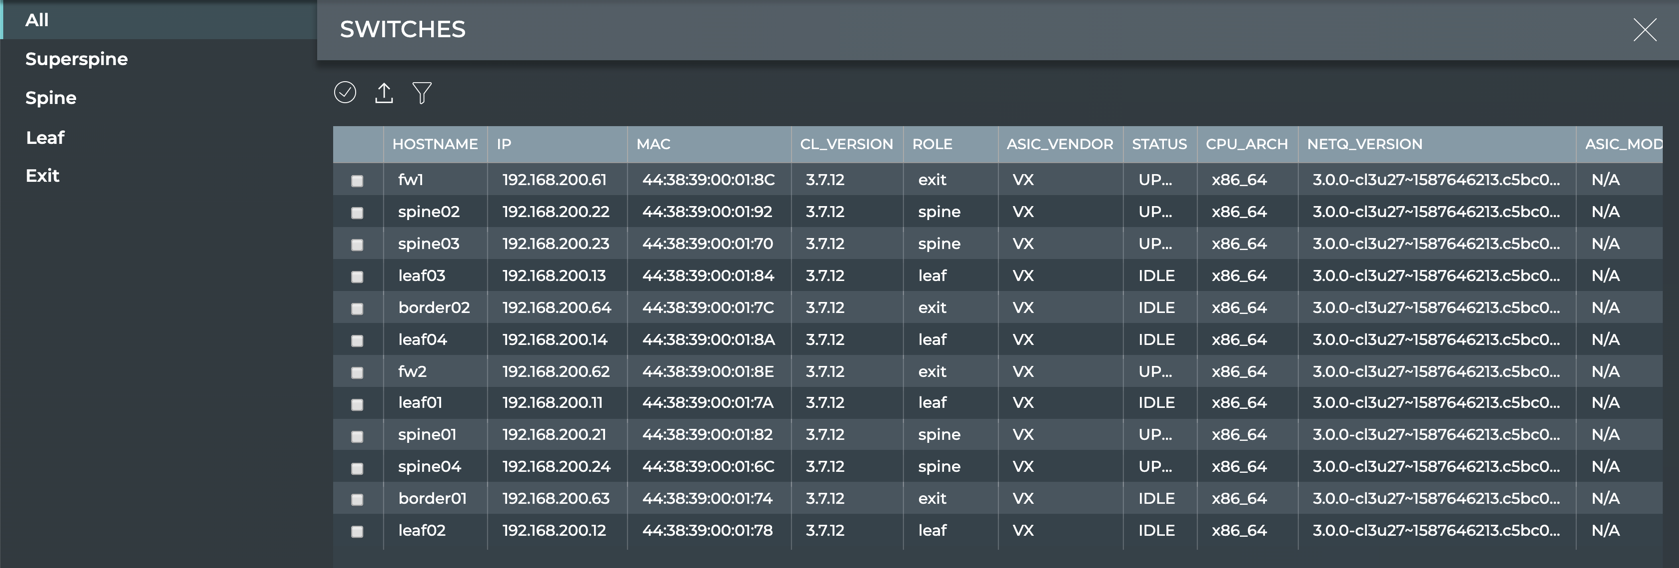
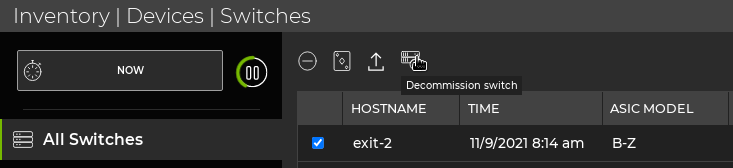
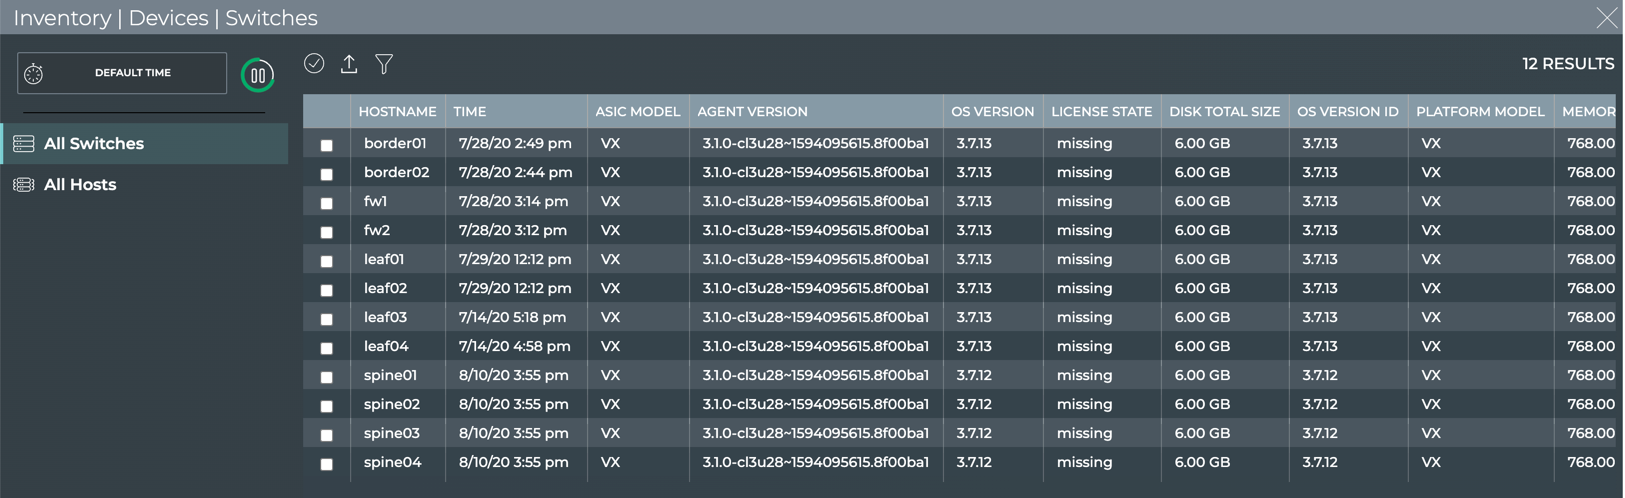
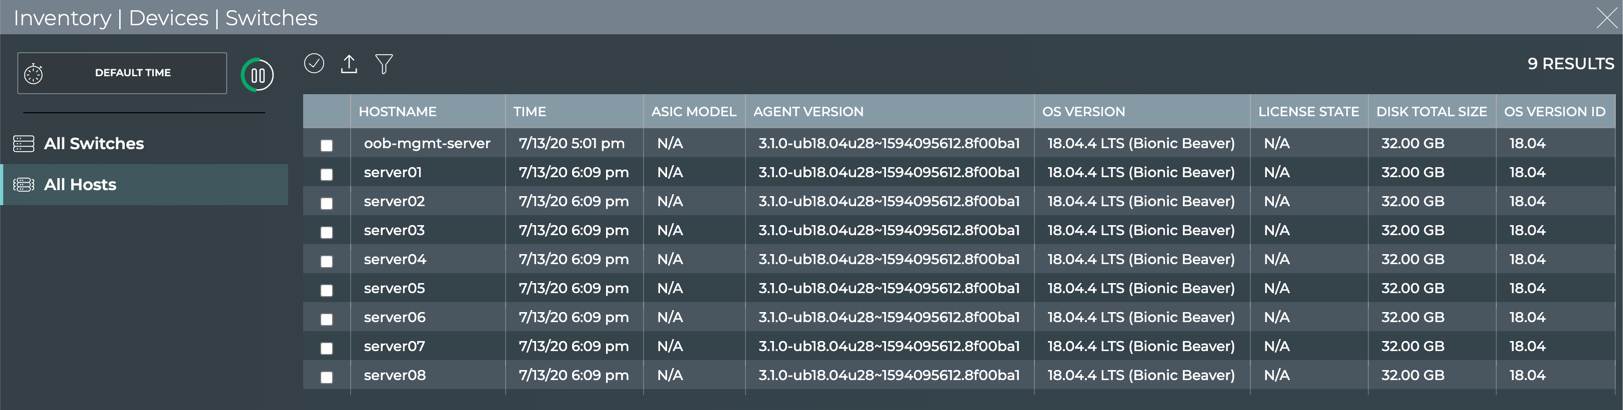
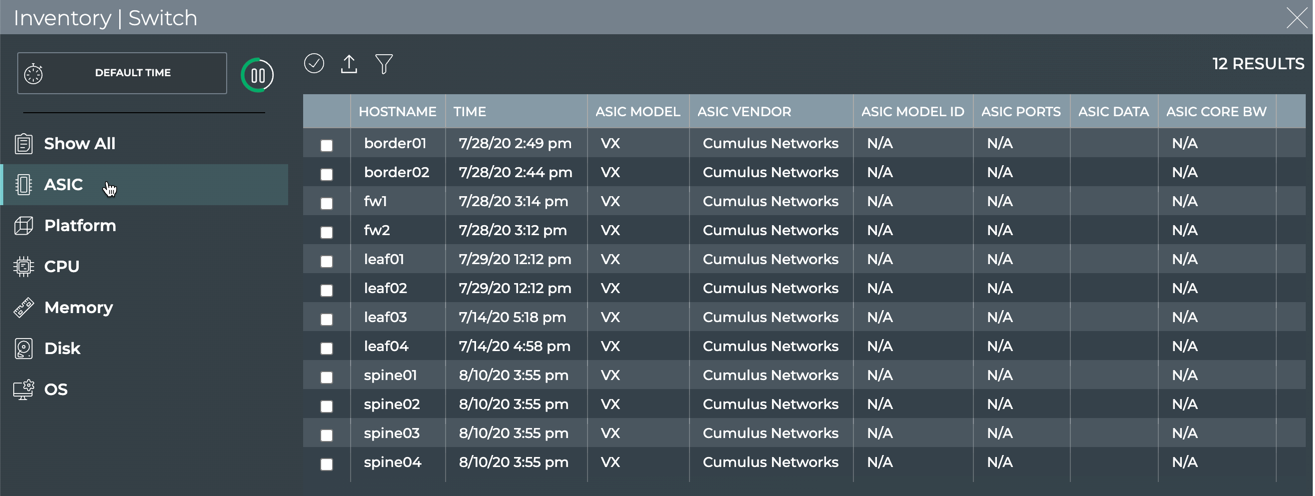
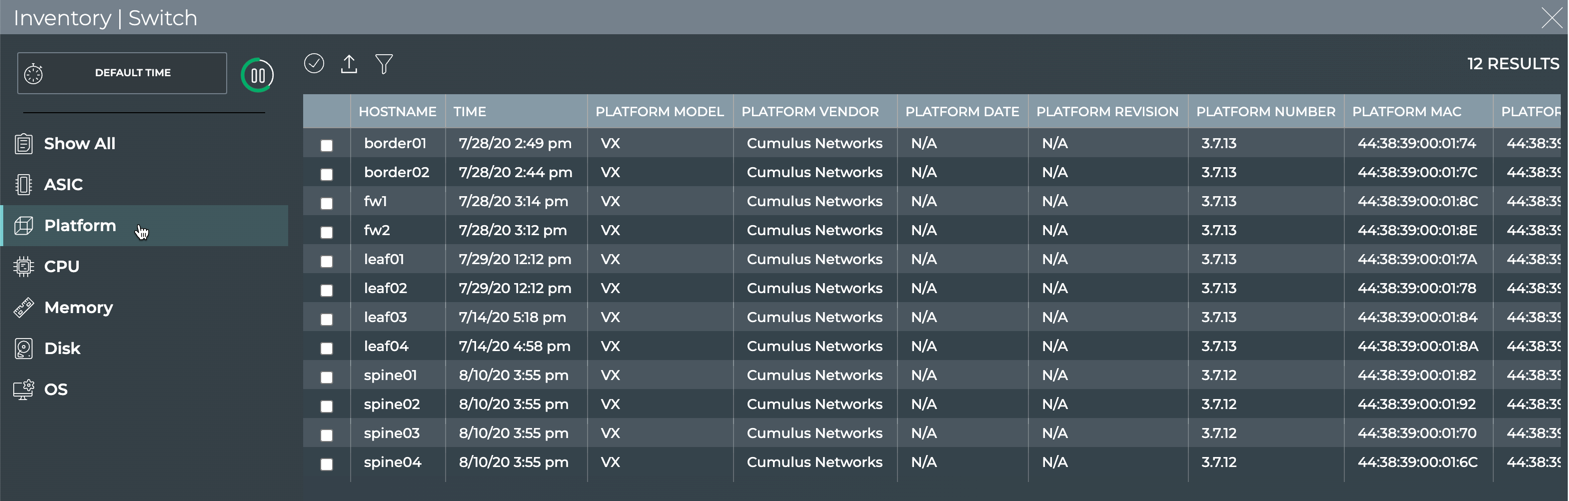
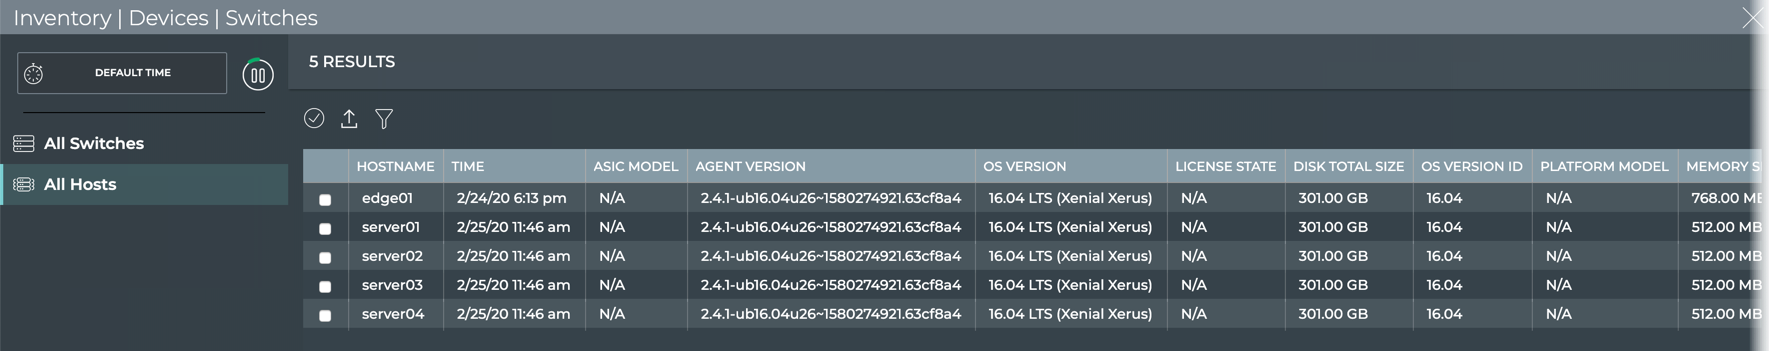
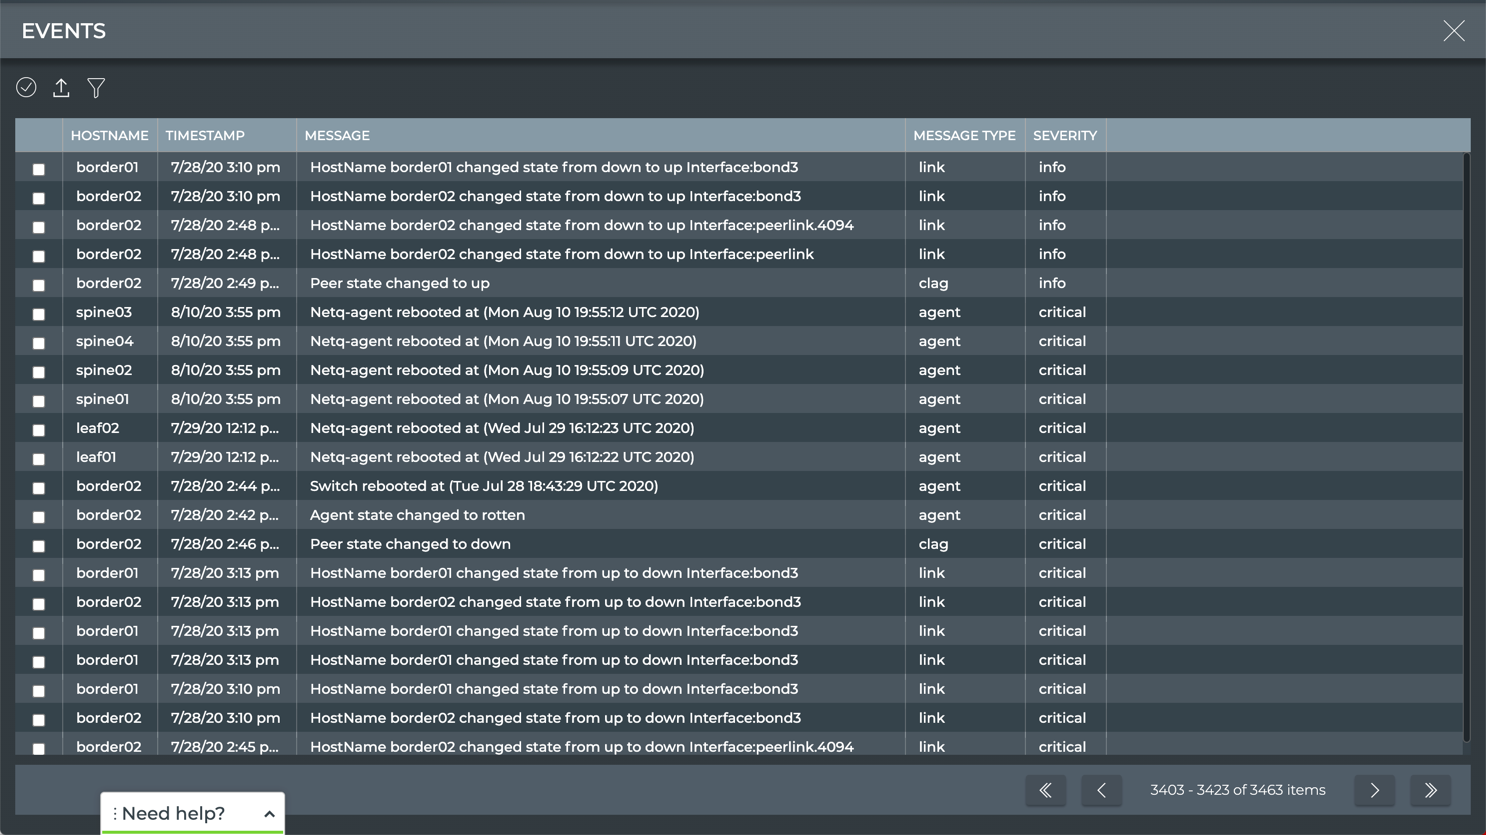
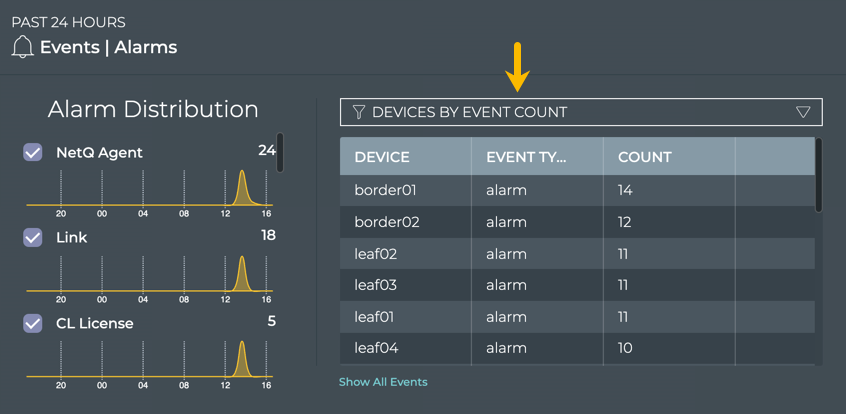
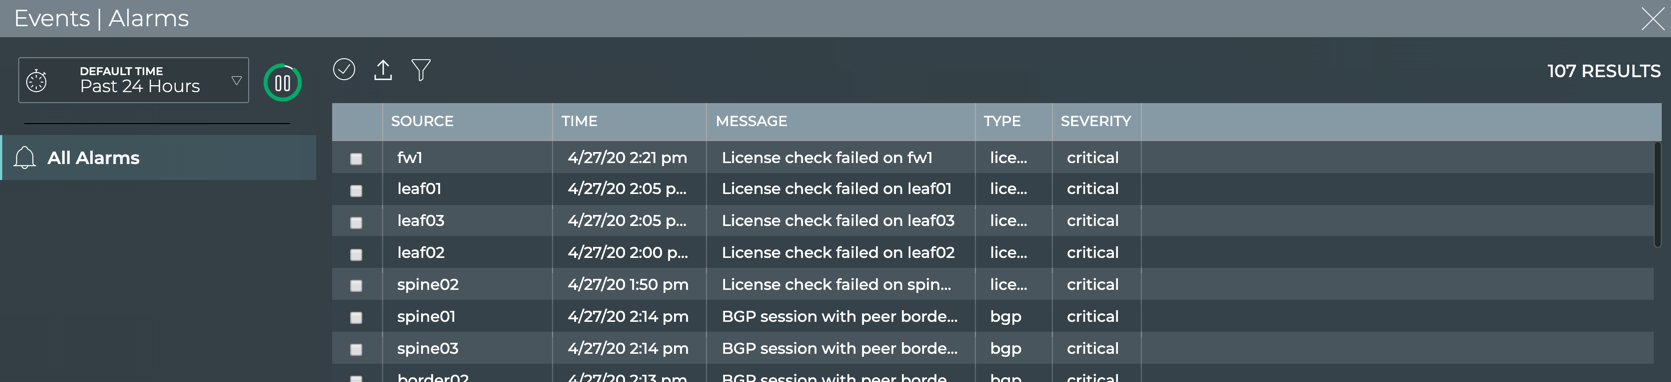
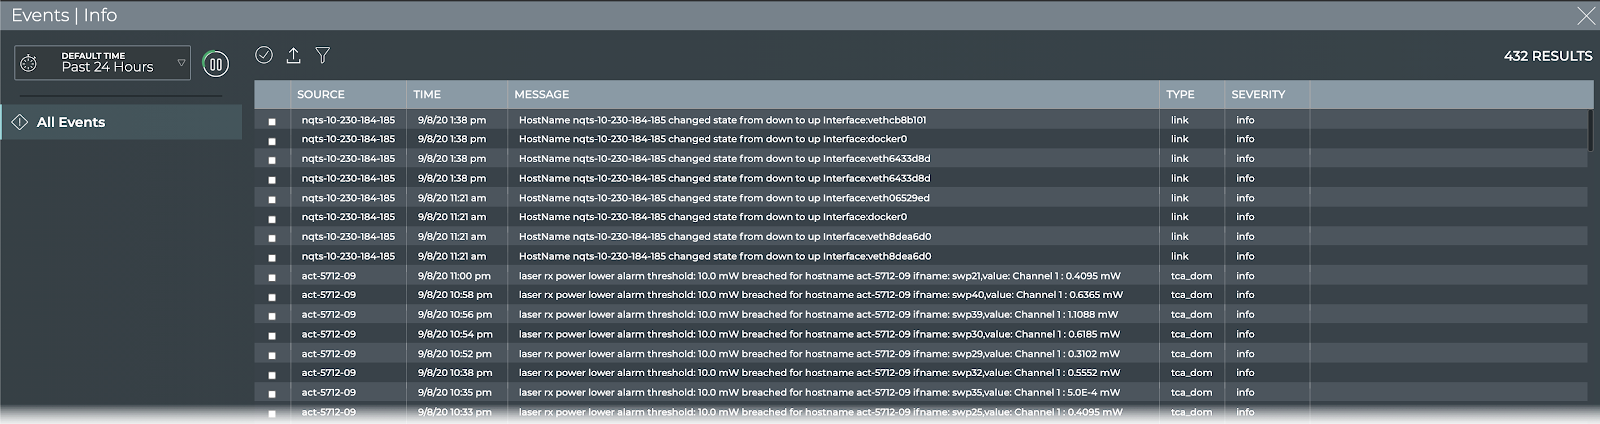
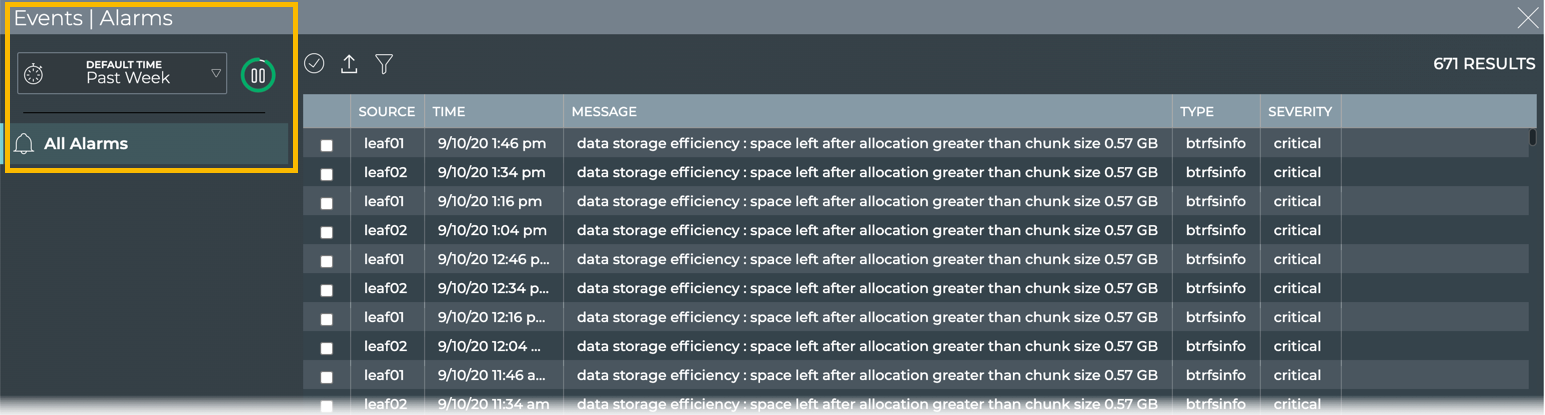
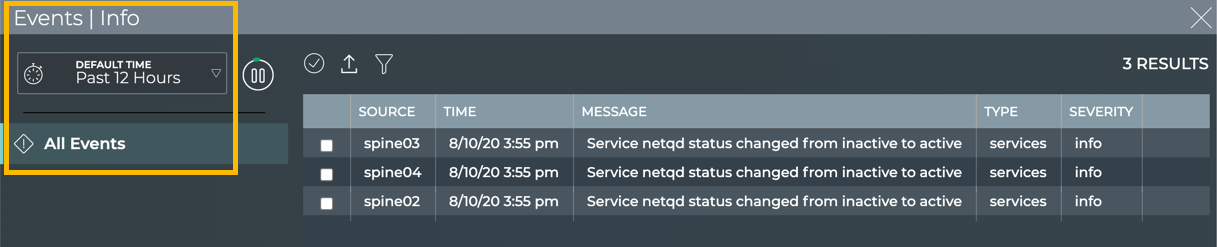
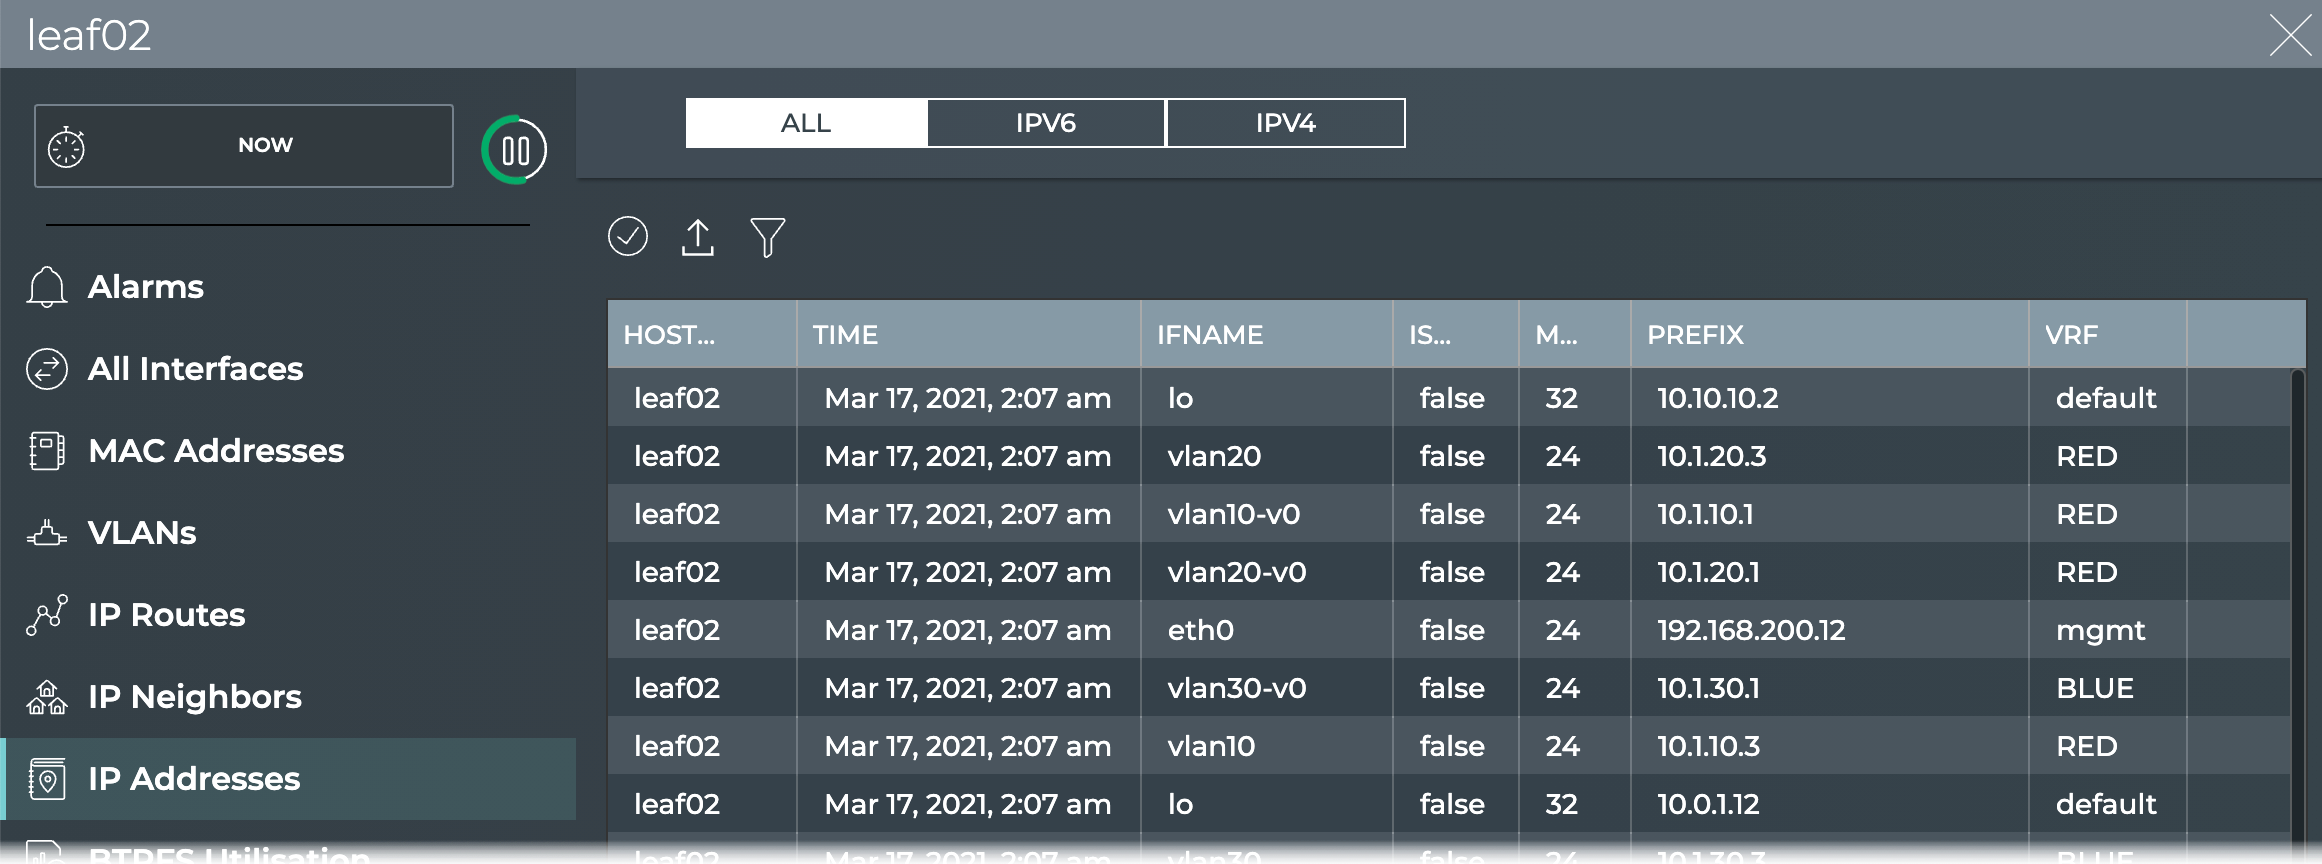
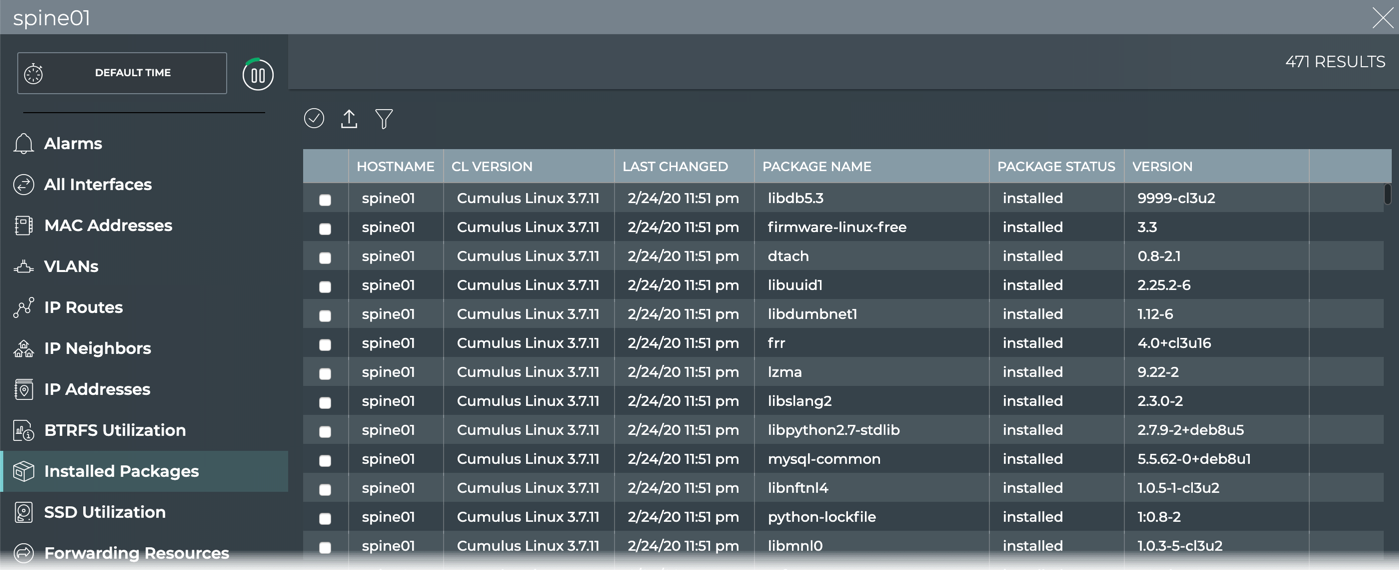
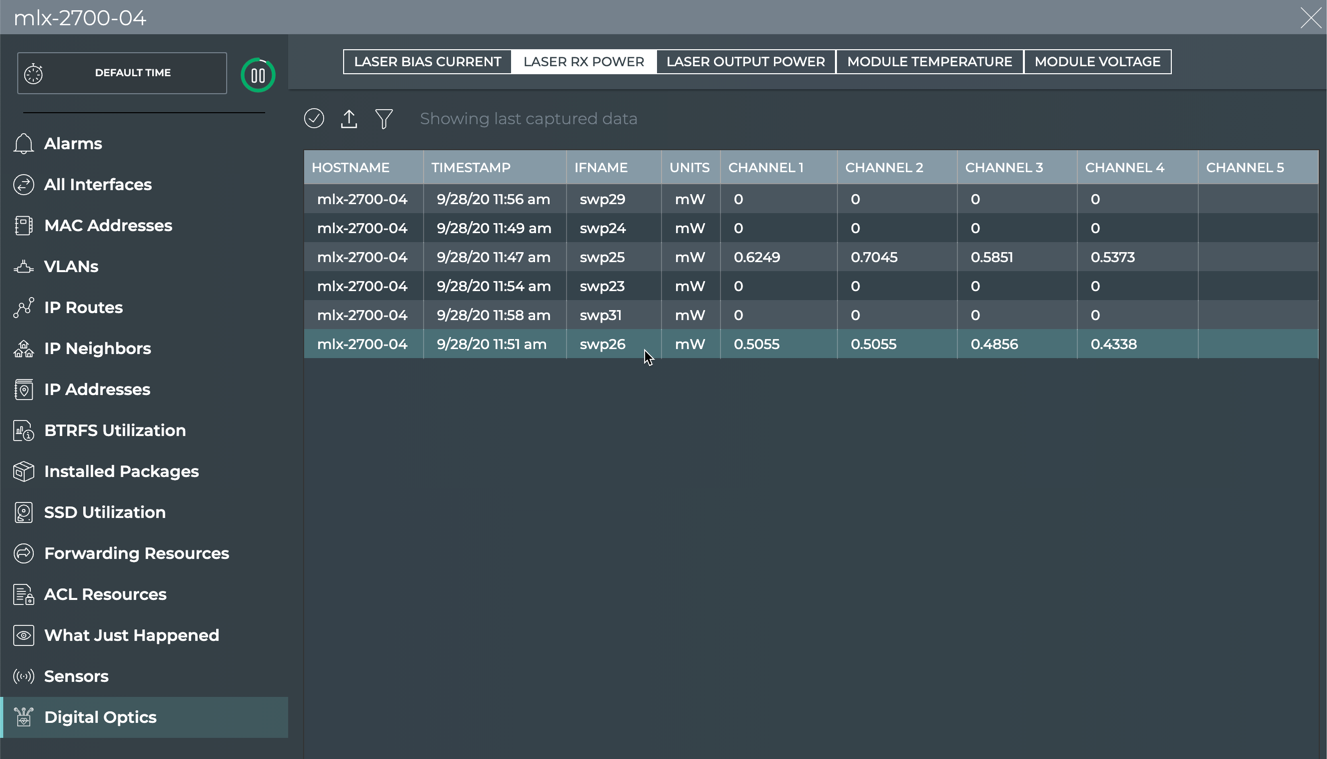
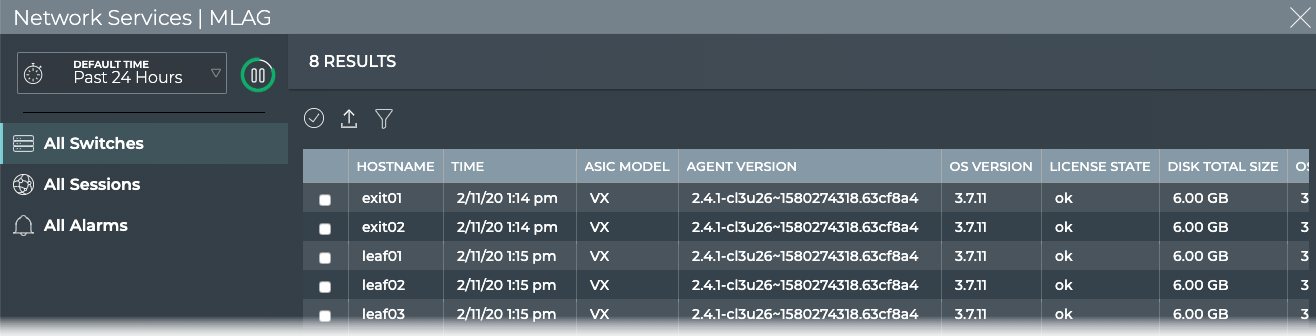
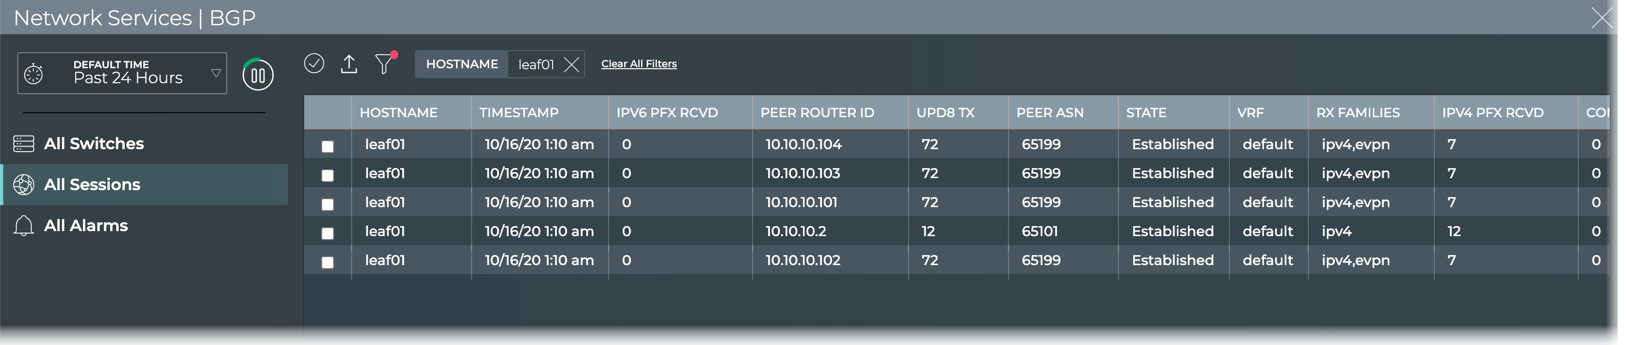
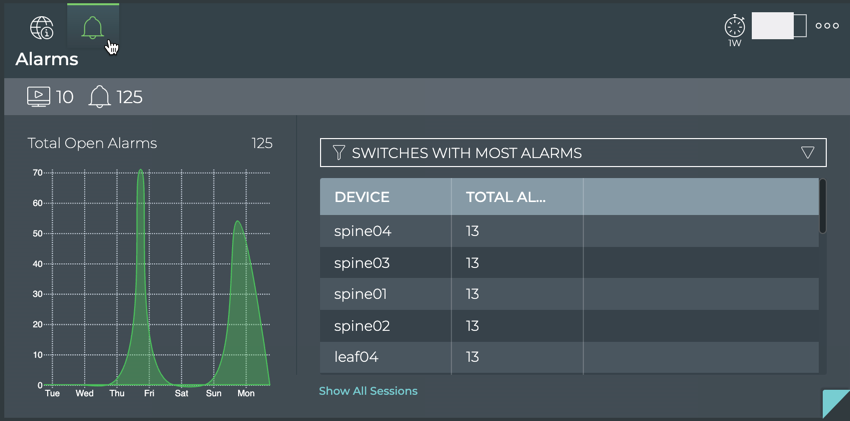
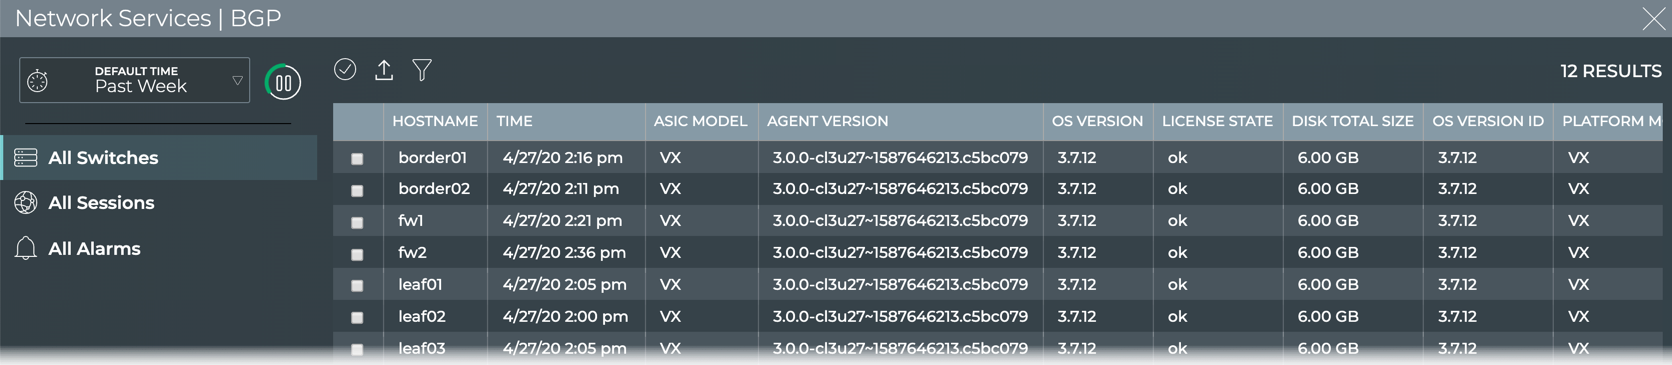
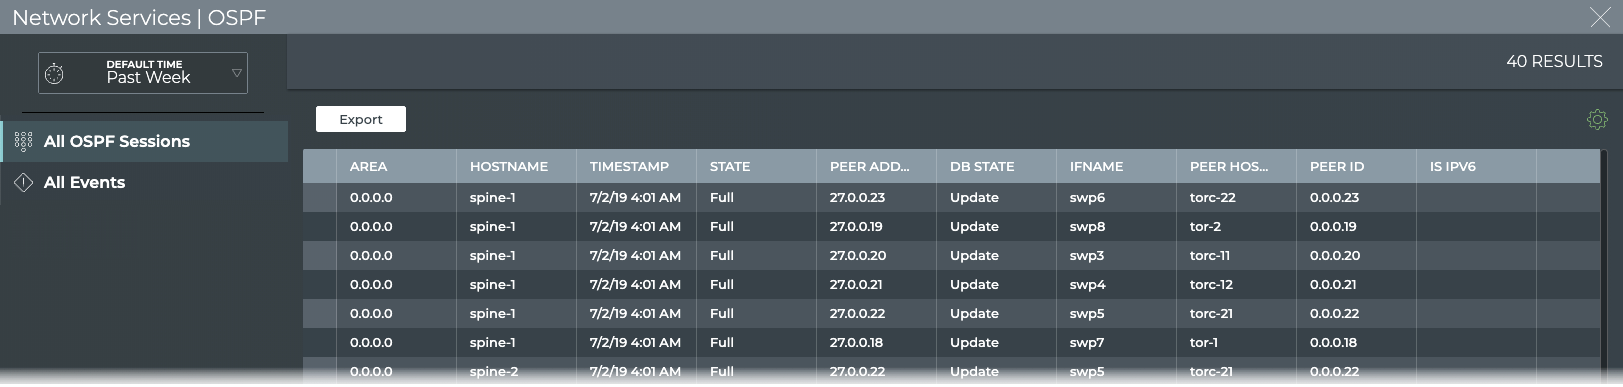
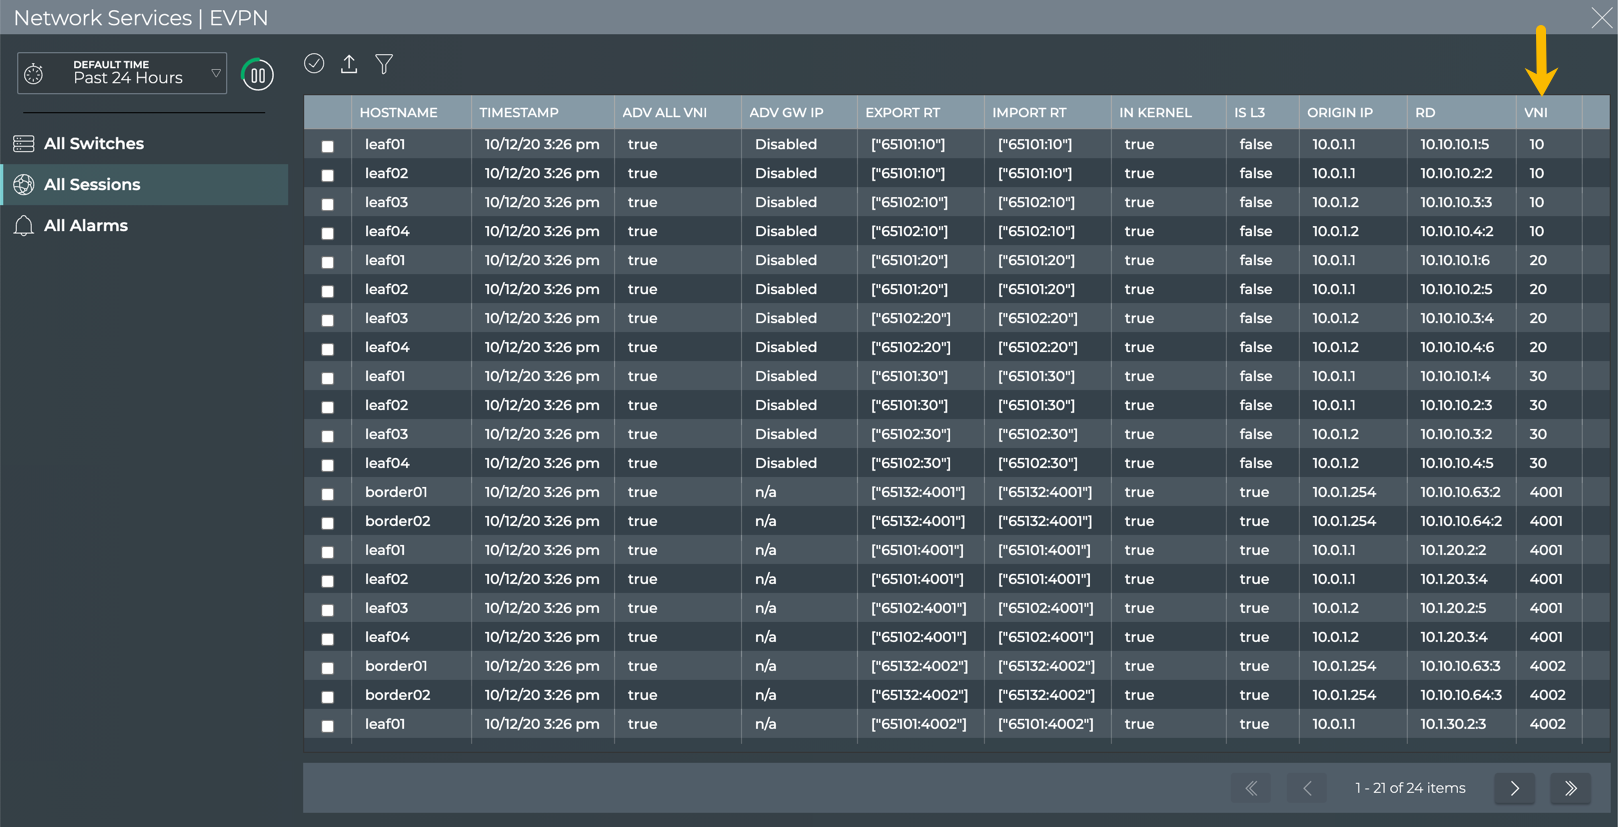
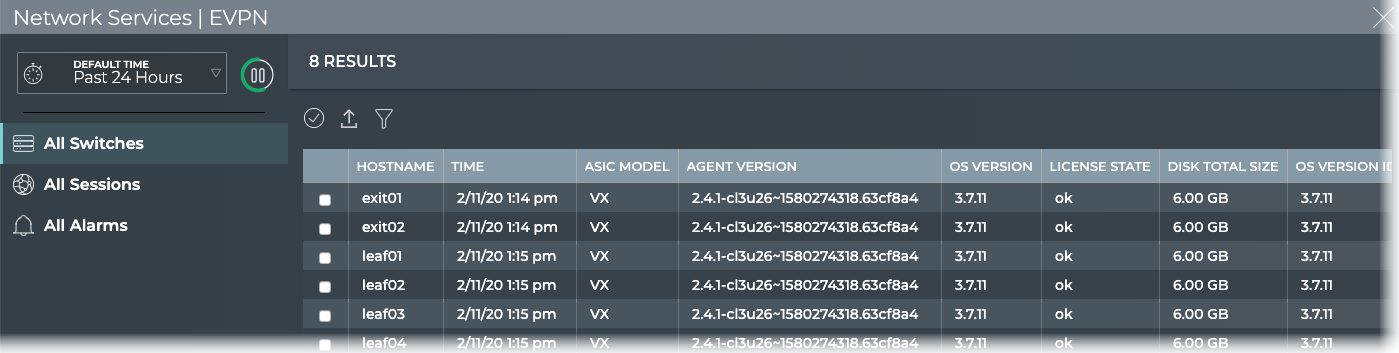
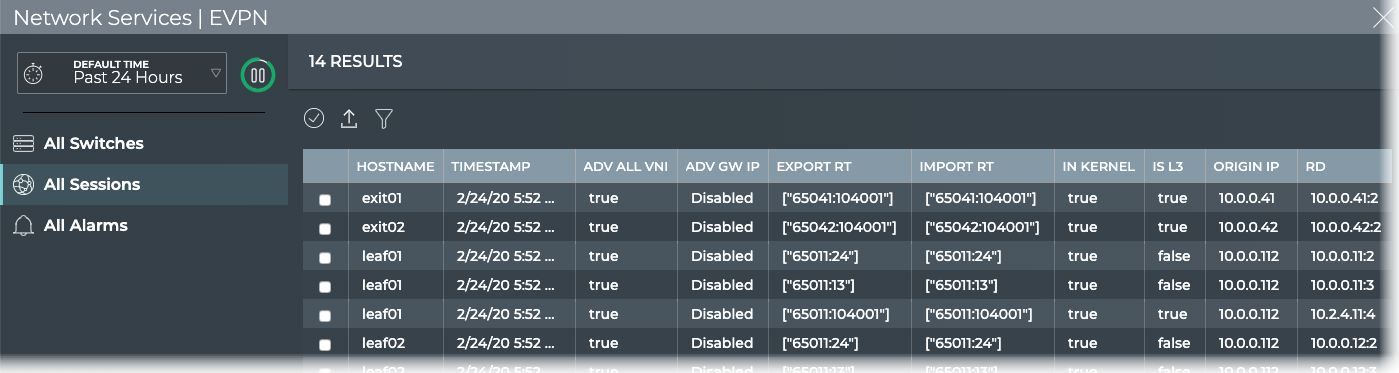
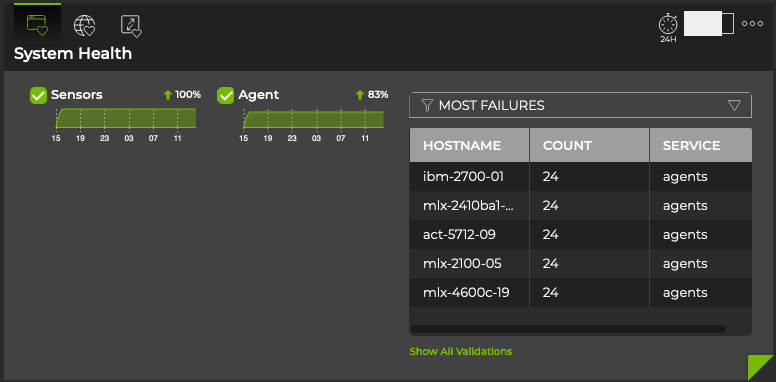
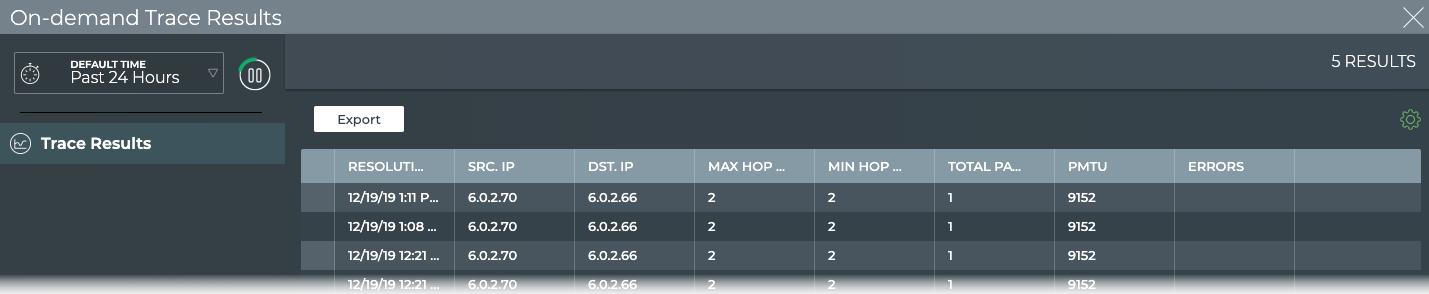
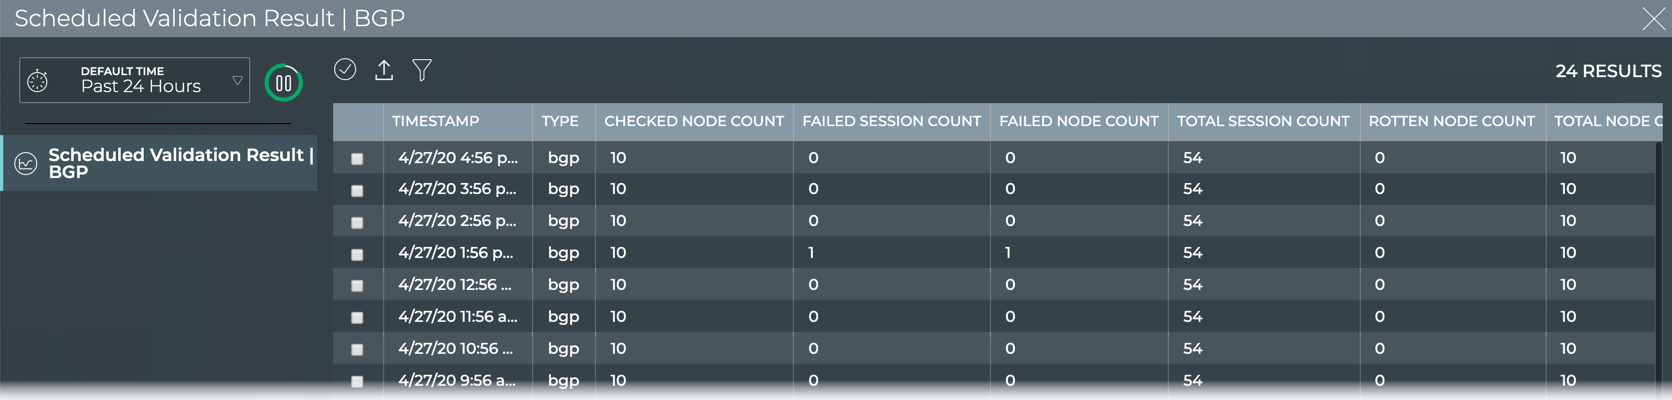
Full-screen cards are most effective for viewing all available data about an aspect of your network all in one place. When you cannot find what you need in the small, medium, or large cards, it is likely on the full-screen card. Most full-screen cards display data in a grid, or table; however, some contain visualizations. Some examples include All Events card and All Switches card, as shown here.
Card Workflows
The UI provides a number of card workflows. Card workflows focus on a particular aspect of your network and are a linked set of each size card — a small card, a medium card, one or more large cards, and one or more full screen cards. The following card workflows are available:
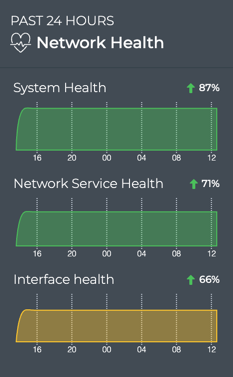
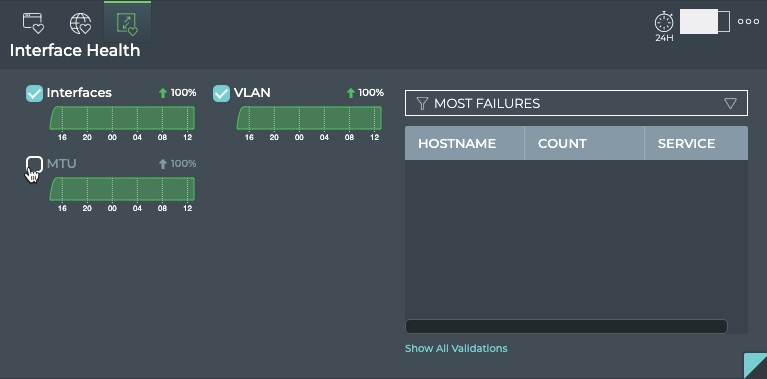
Network Health: networkwide view of network health
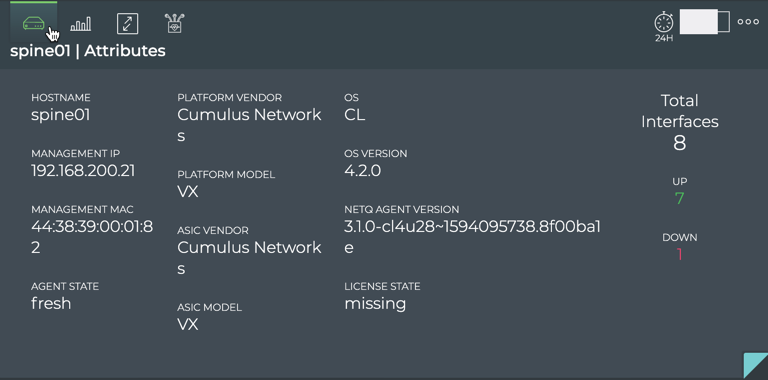
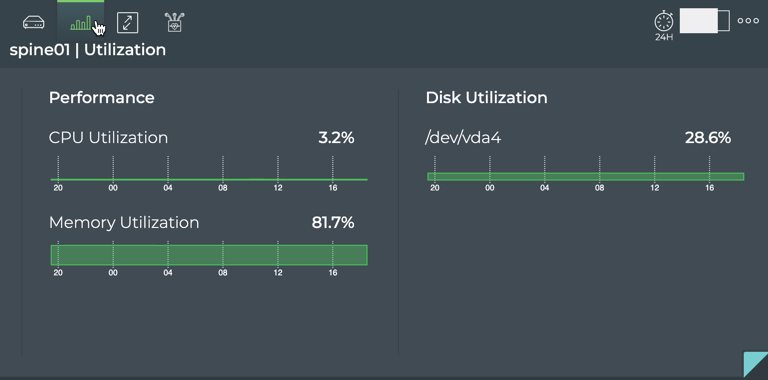
Devices|Switches: health of a given switch
Inventory|Devices: information about all switches and hosts in the network
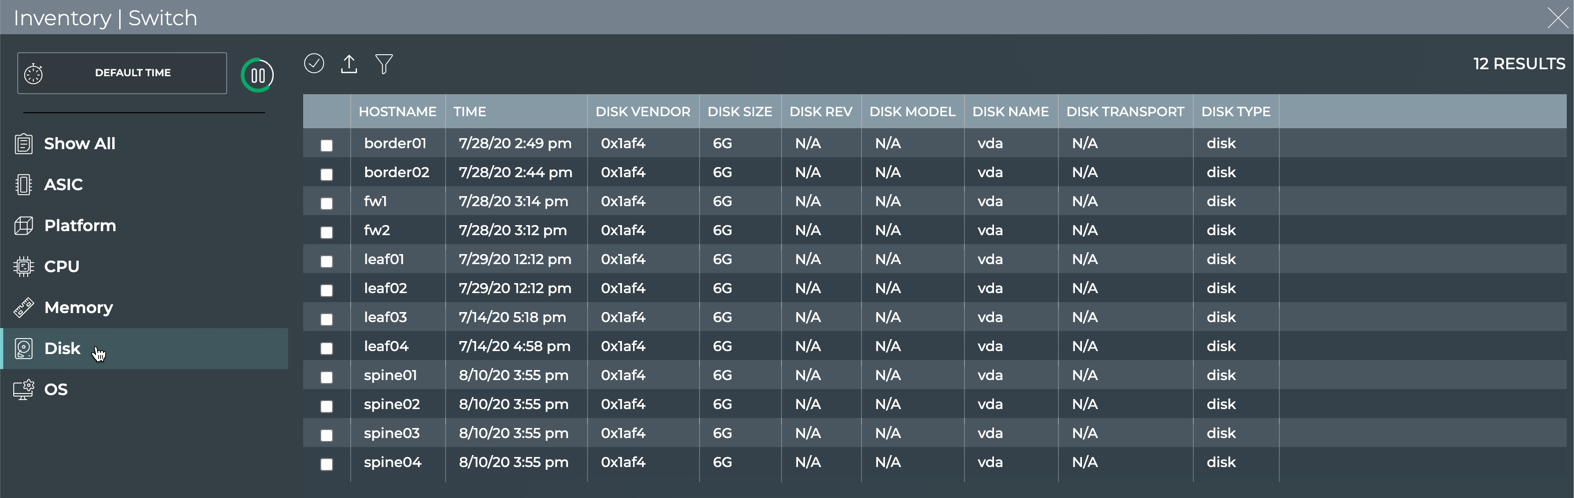
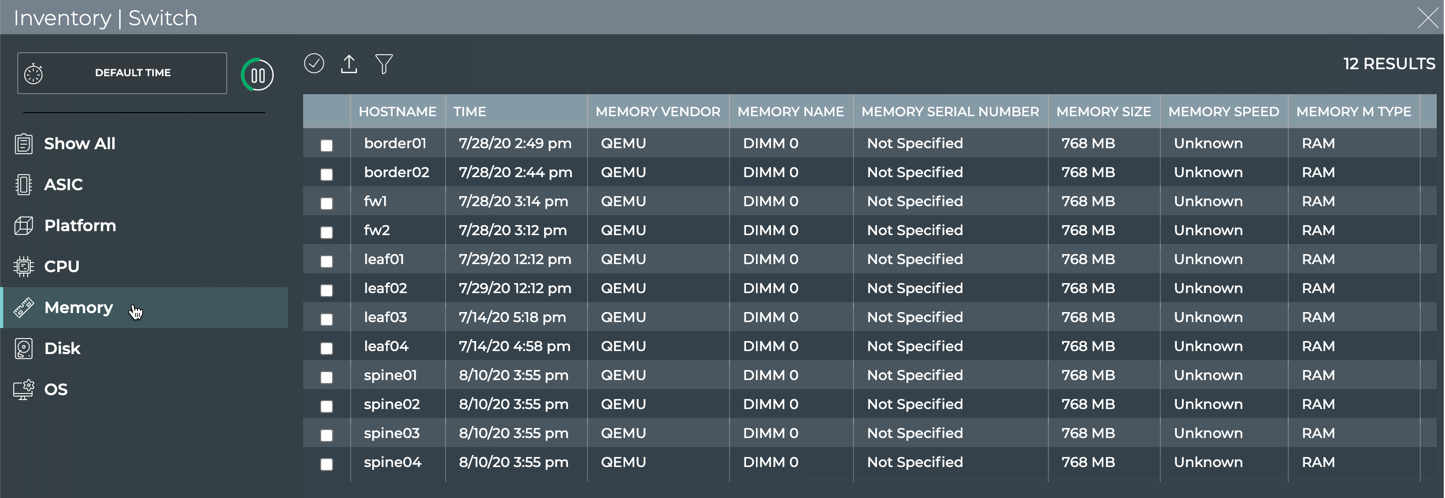
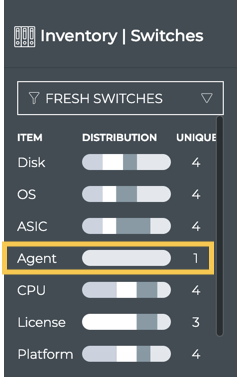
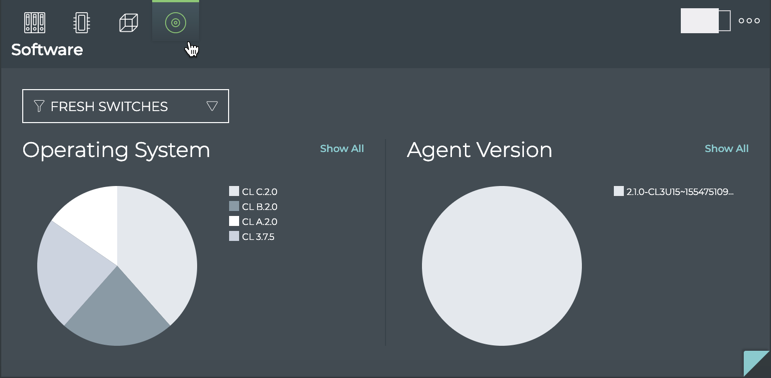
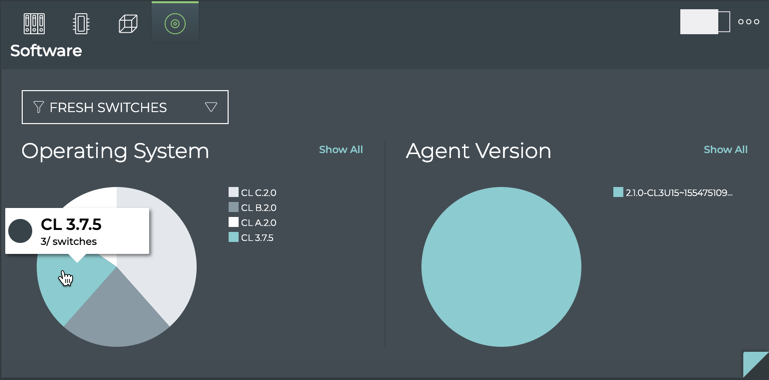
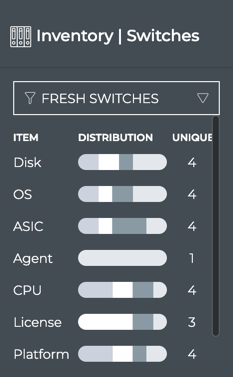
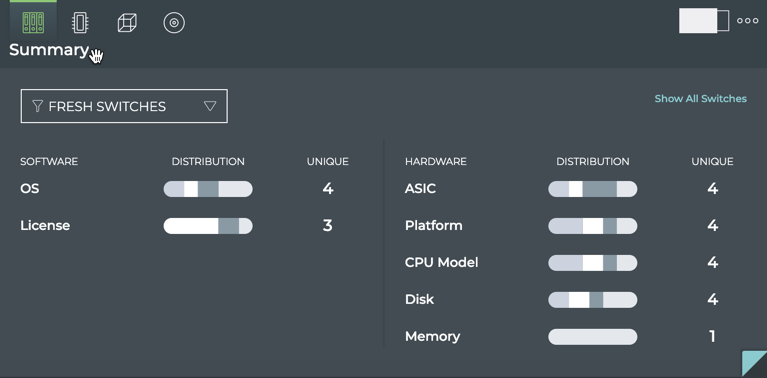
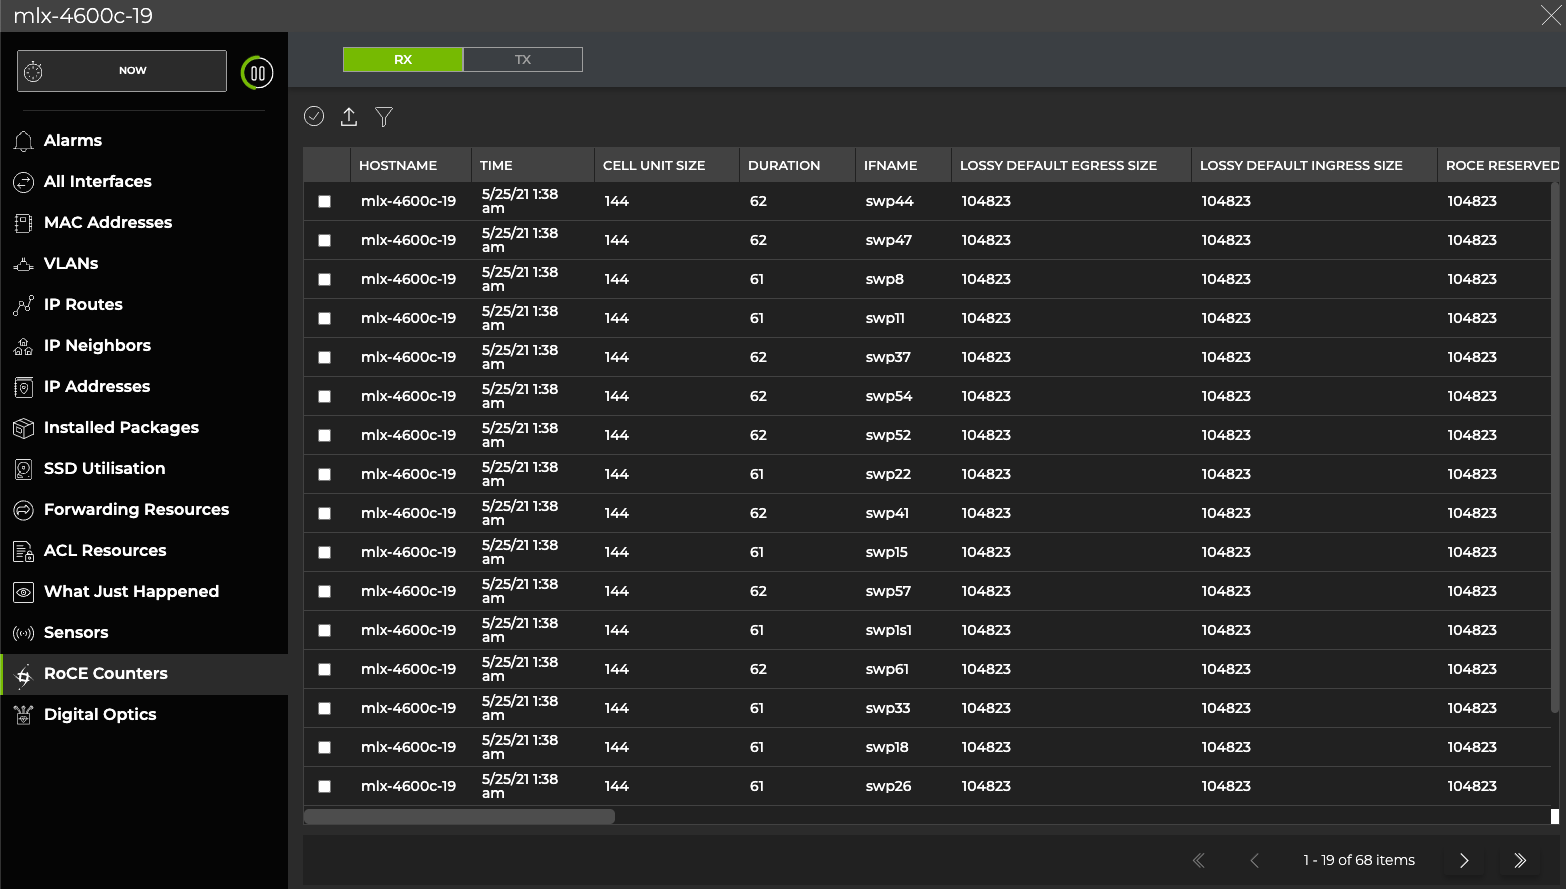
Inventory|Switches: information about the components on a given switch
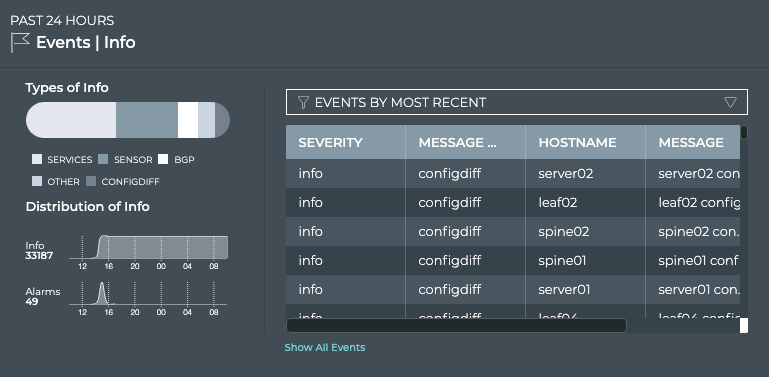
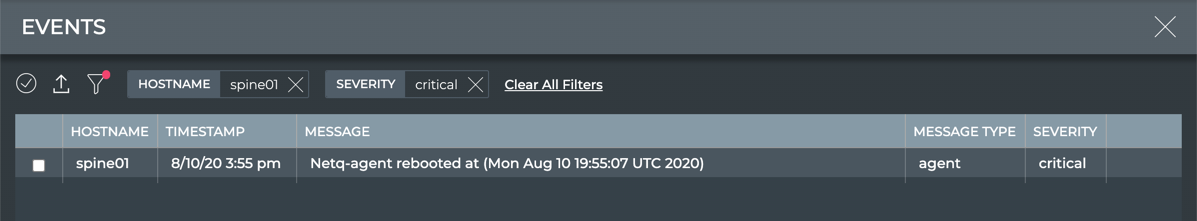
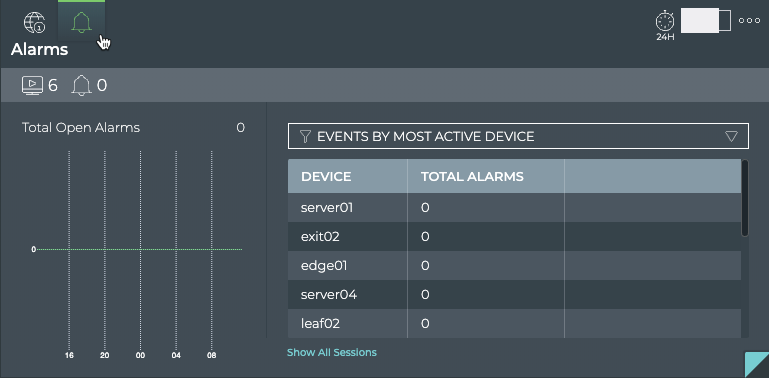
Events|Alarms: information about all critical severity events in the system
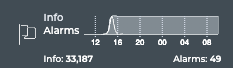
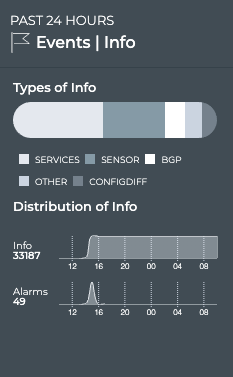
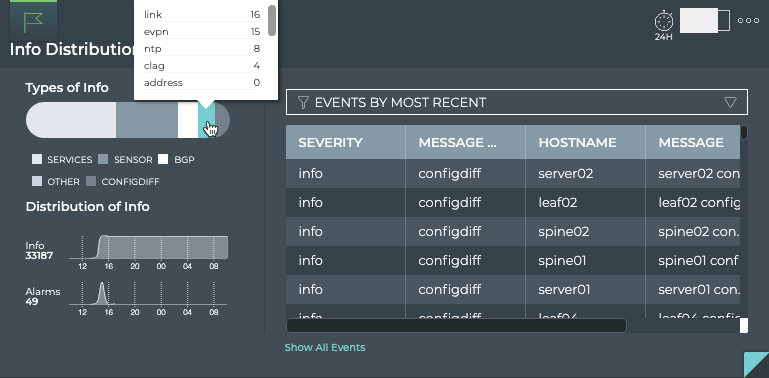
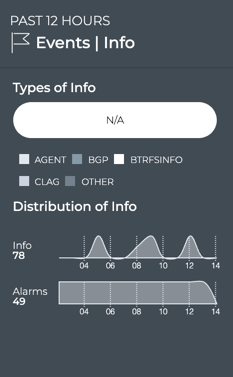
Events|Info: information about all warning, info, and debug events in the system
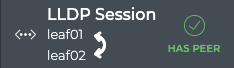
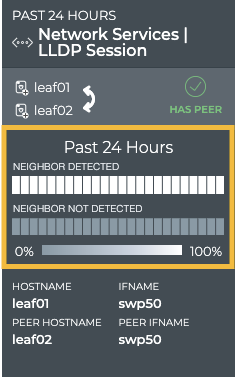
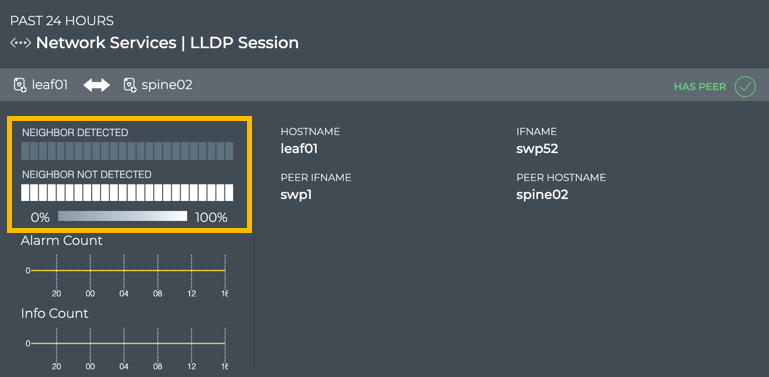
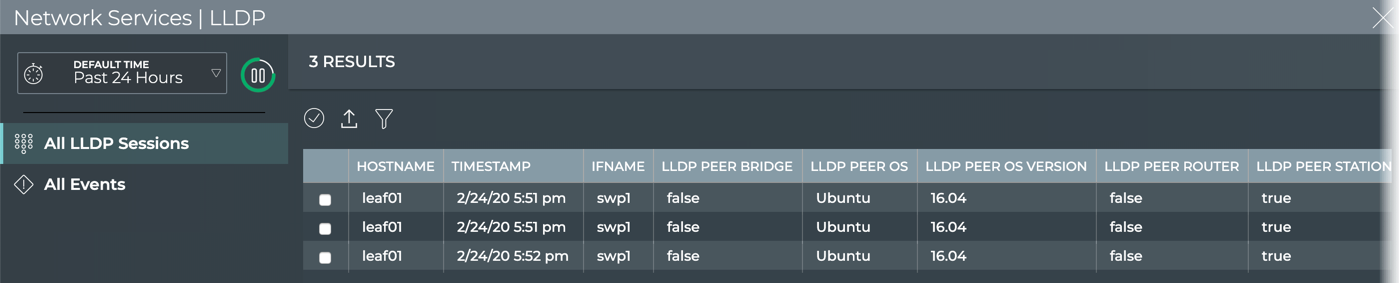
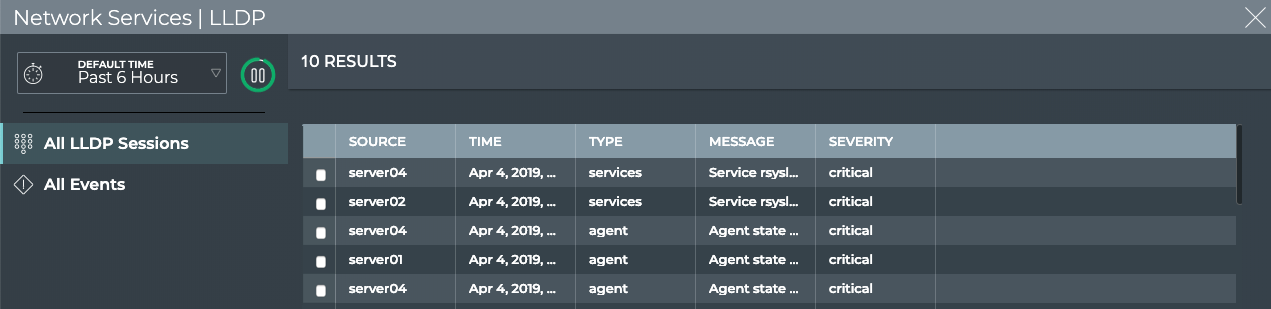
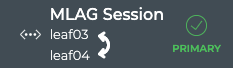
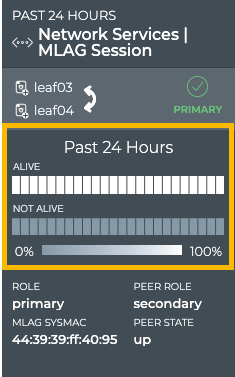
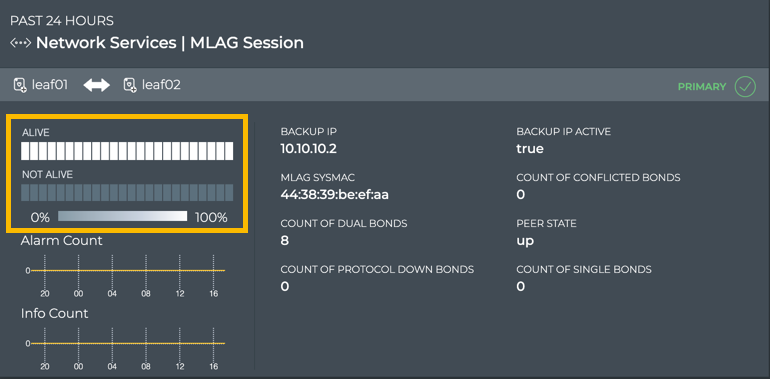
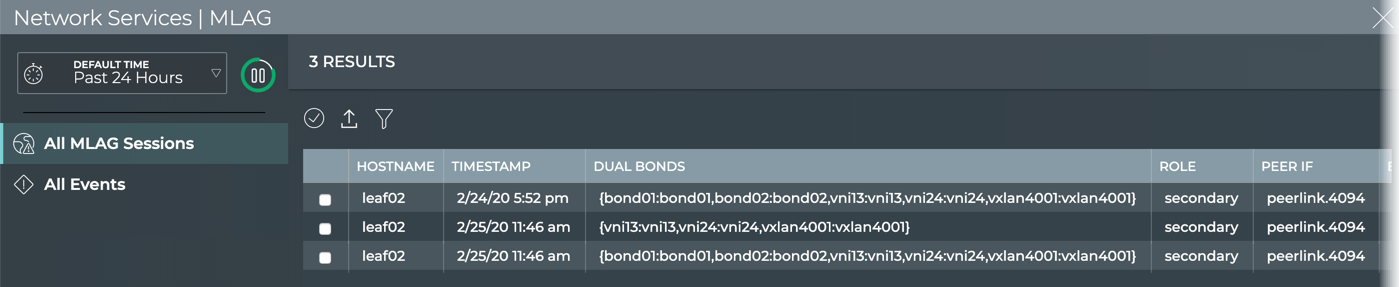
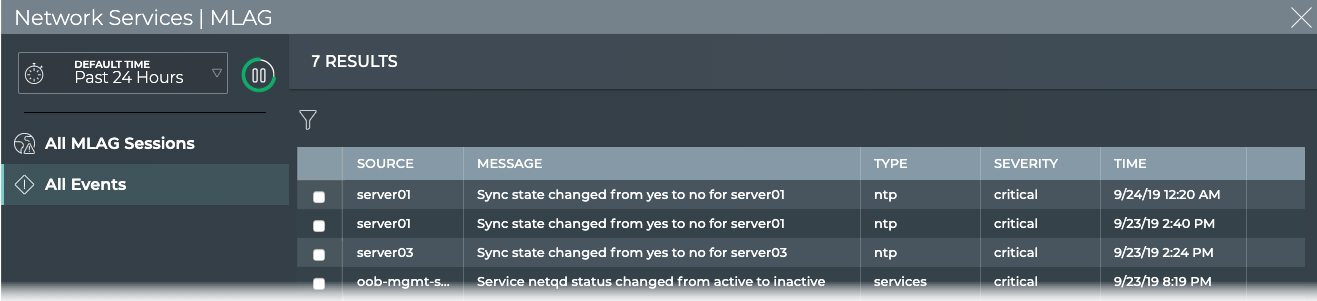
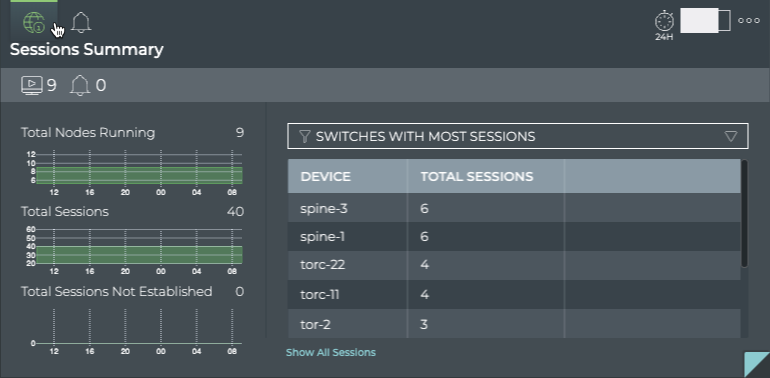
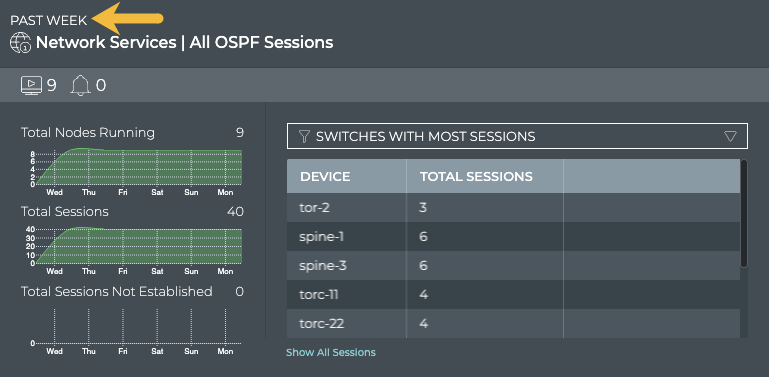
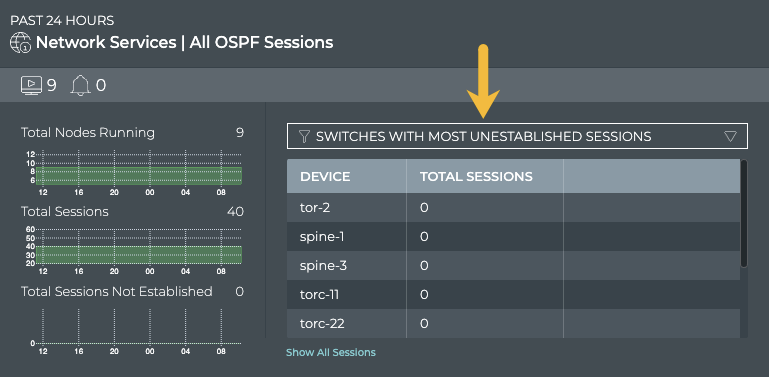
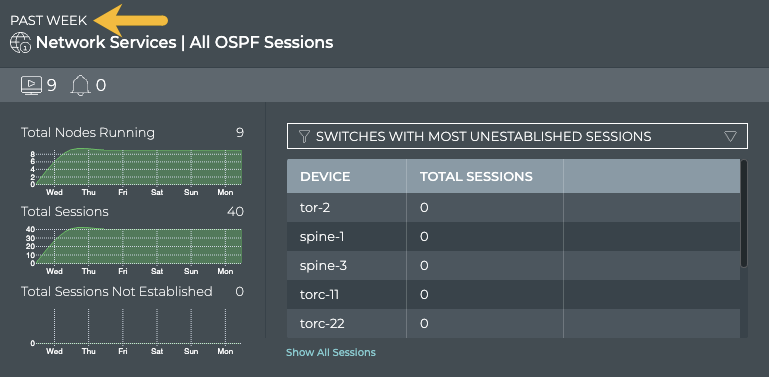
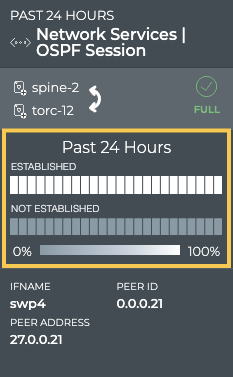
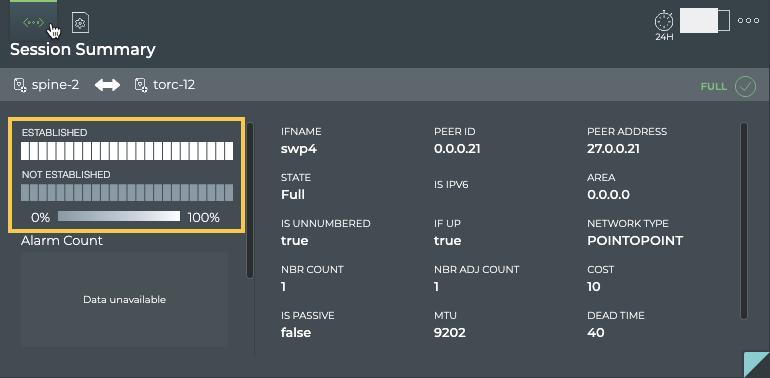
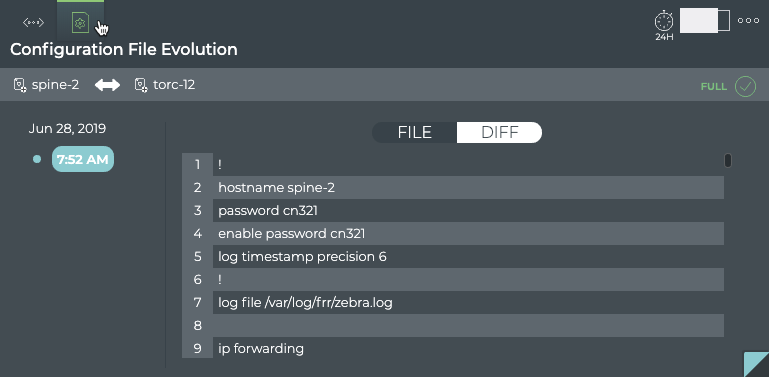
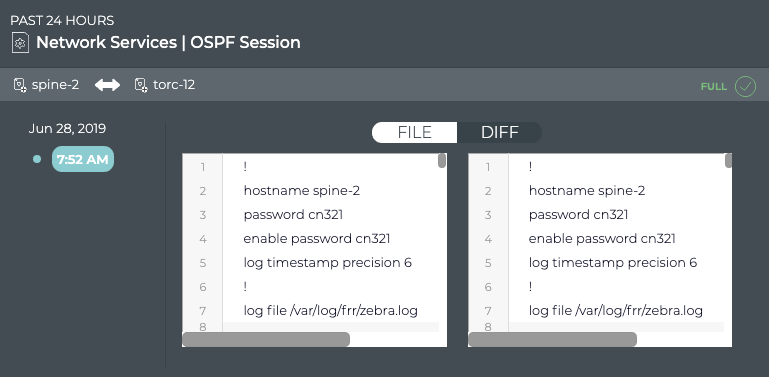
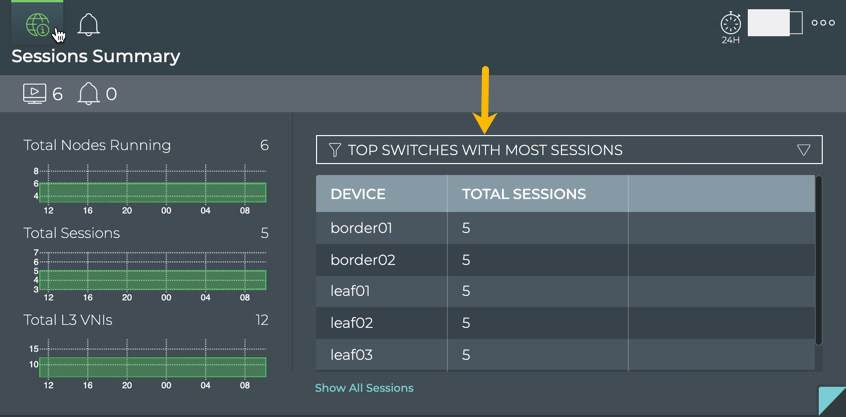
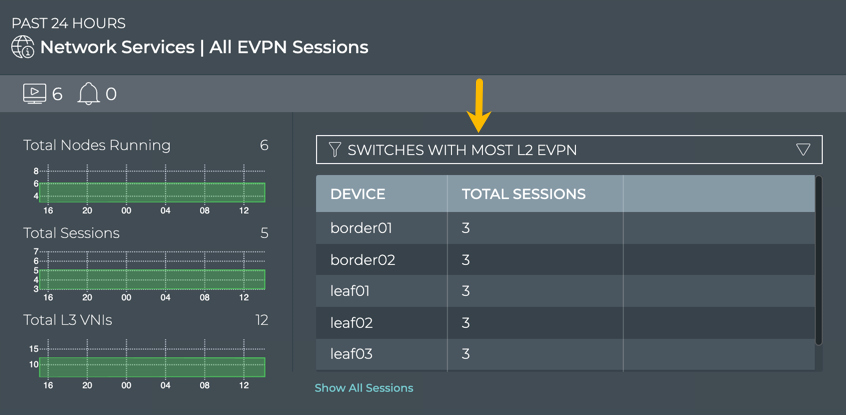
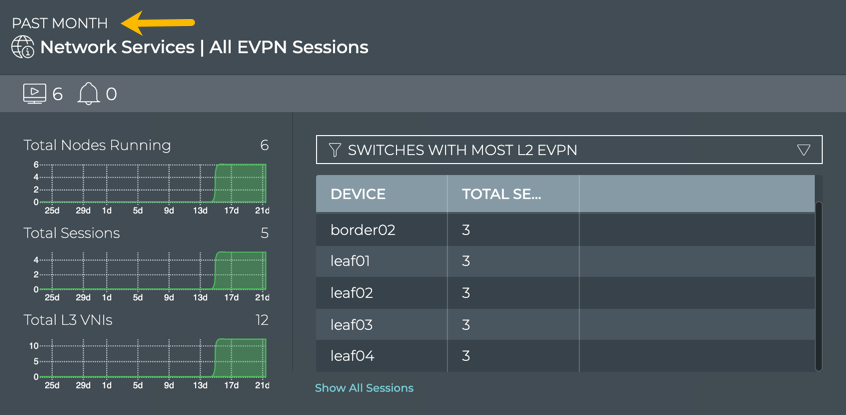
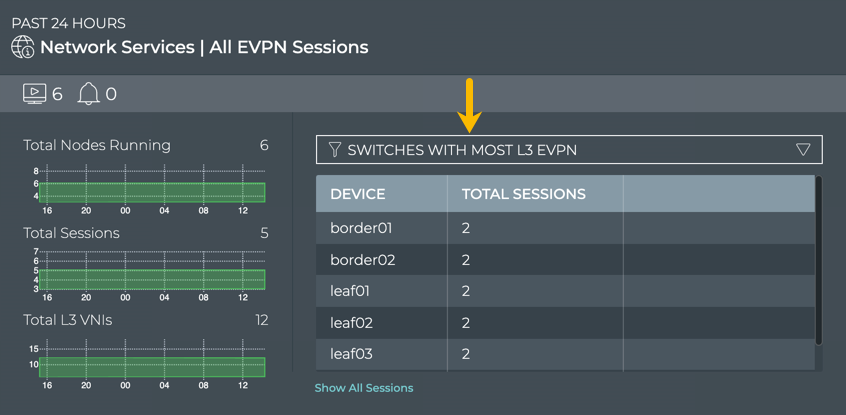
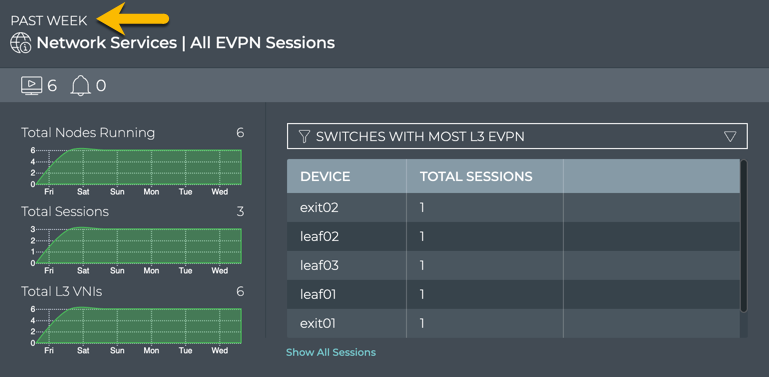
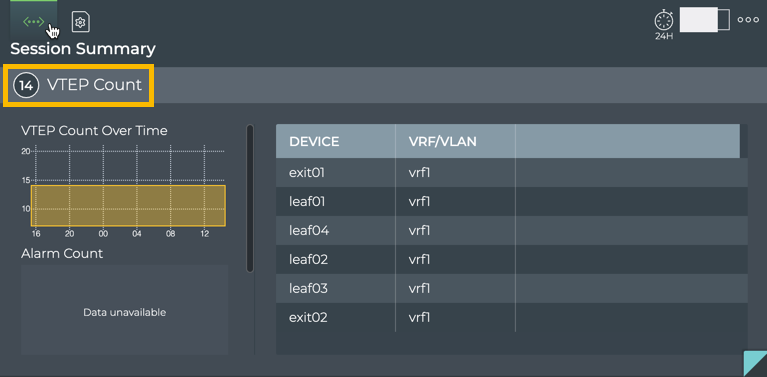
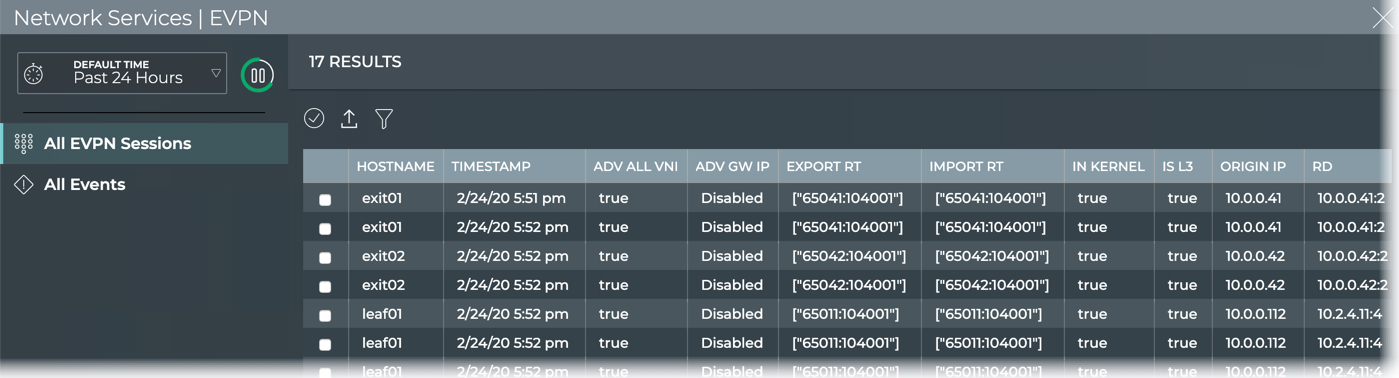
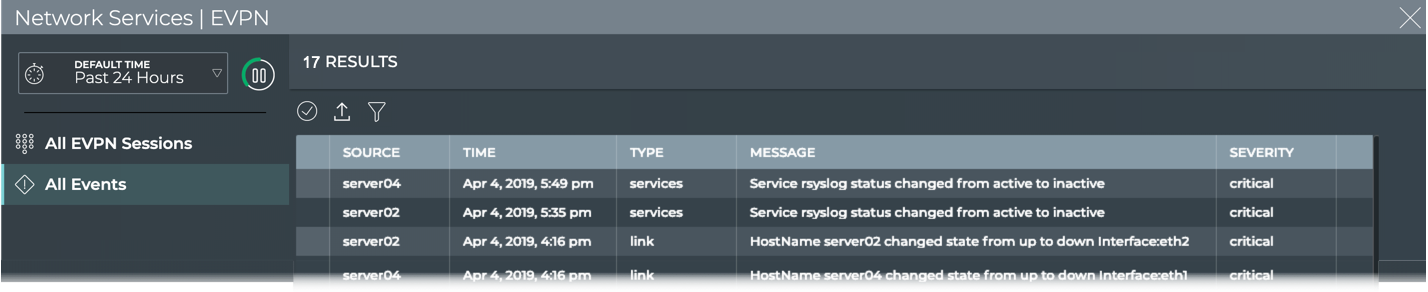
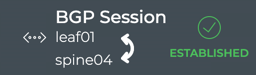
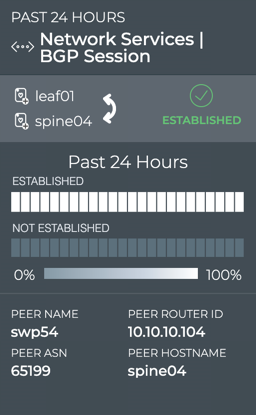
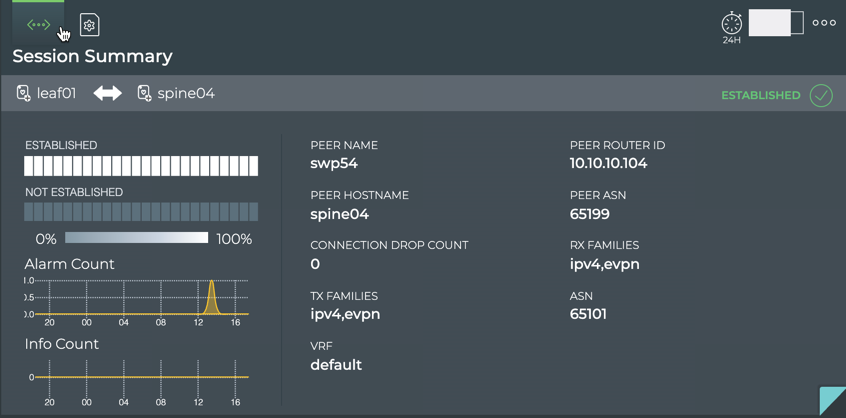
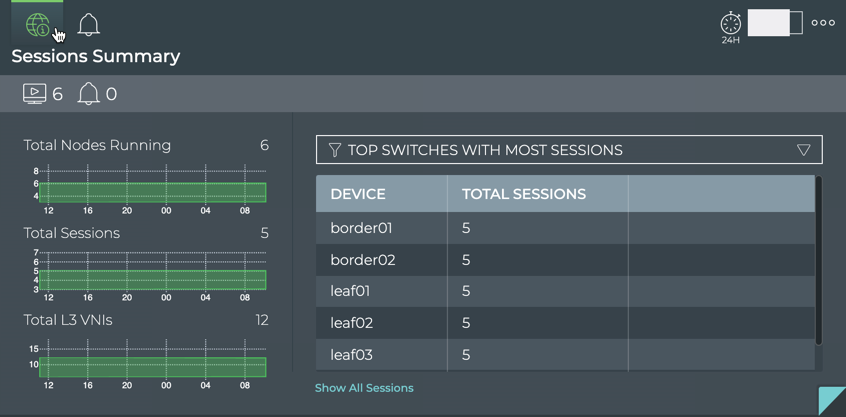
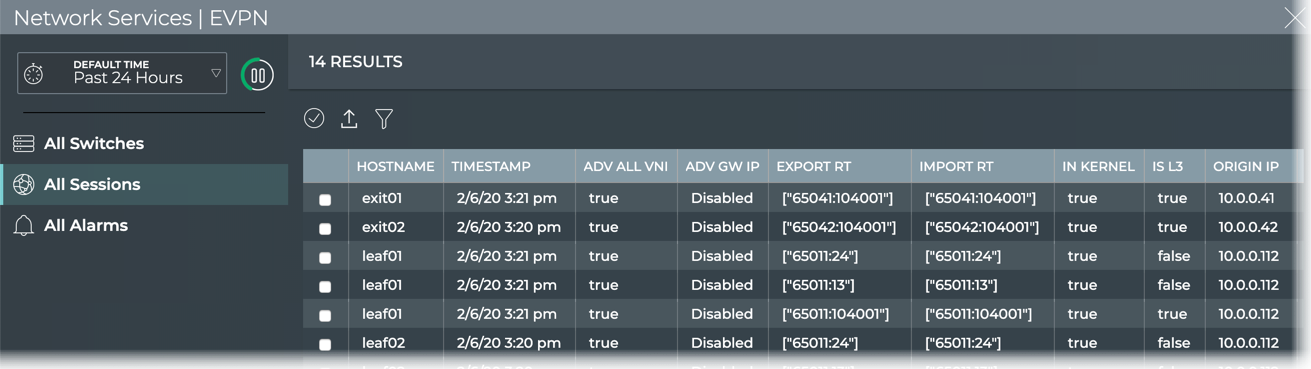
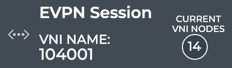
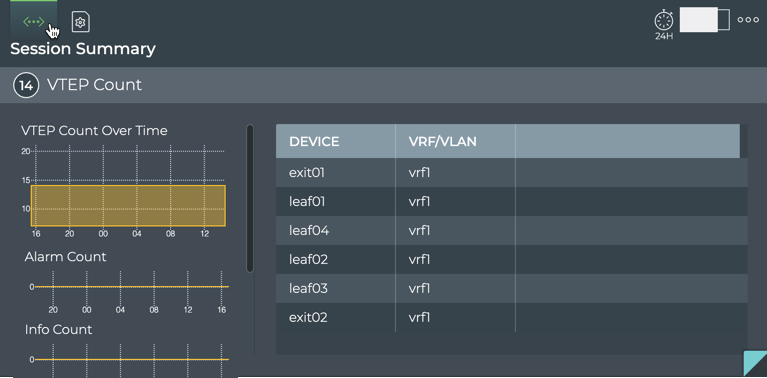
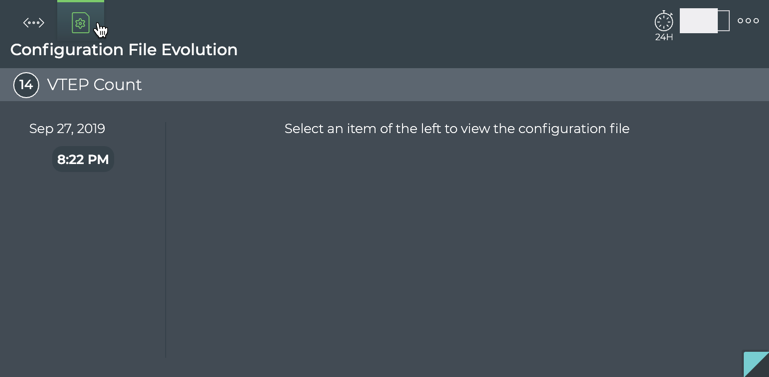
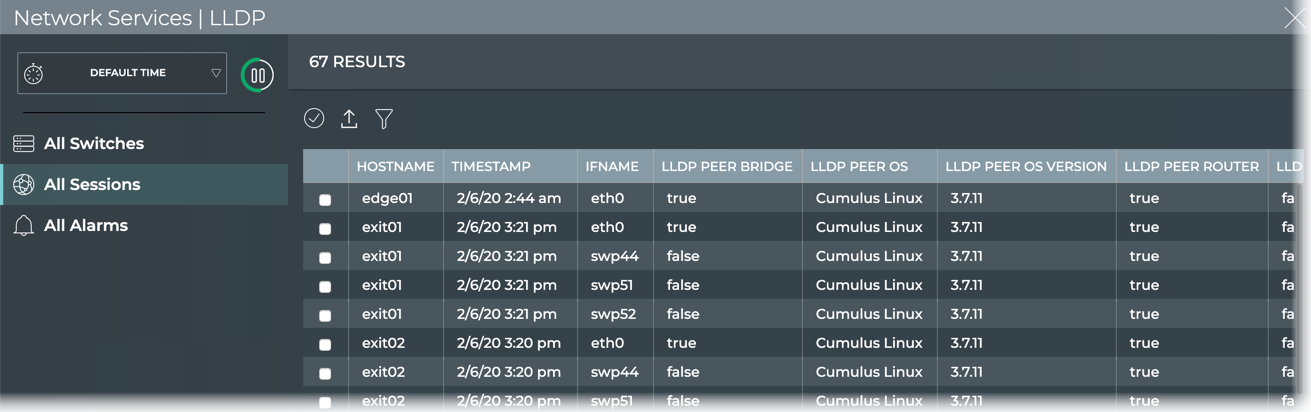
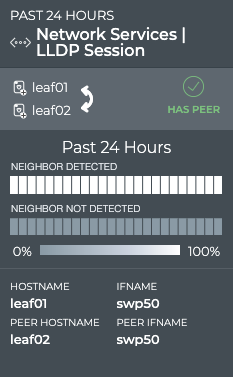
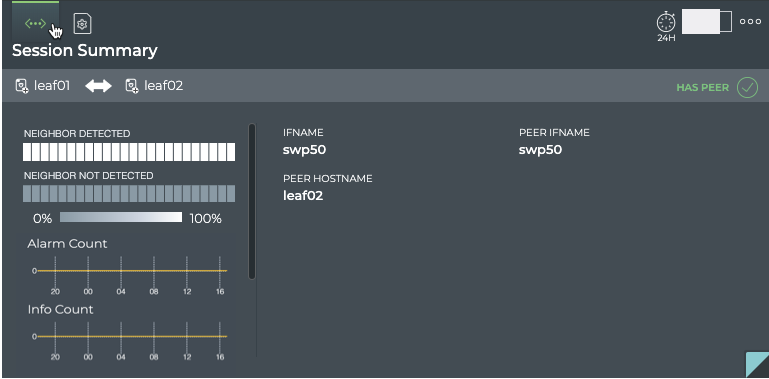
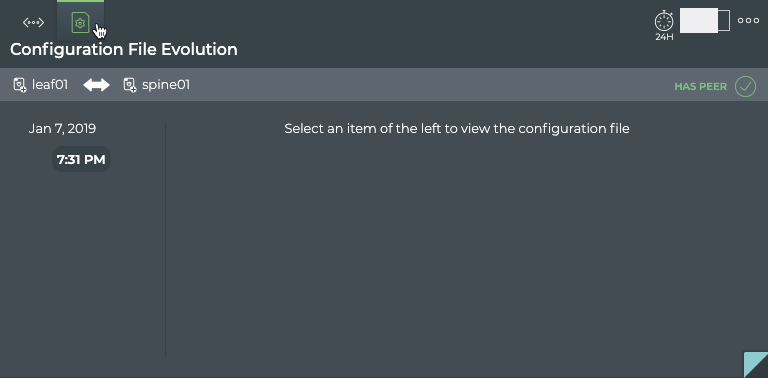
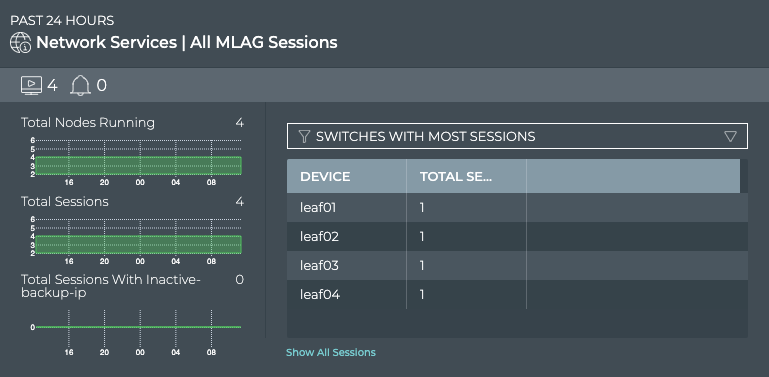
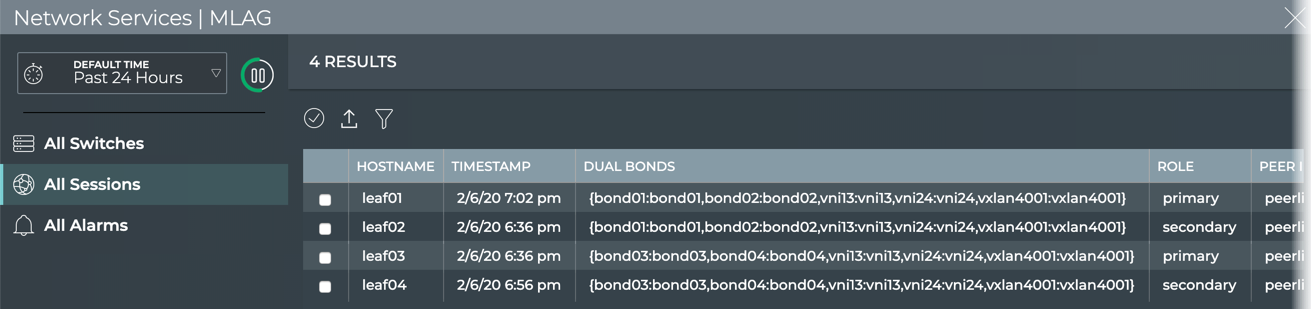
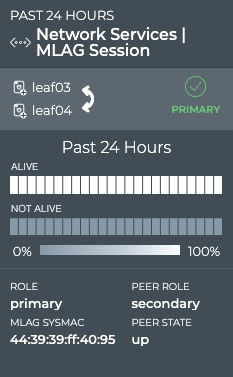
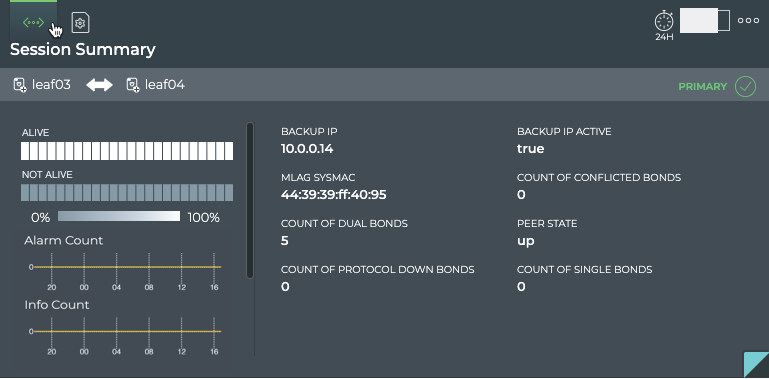
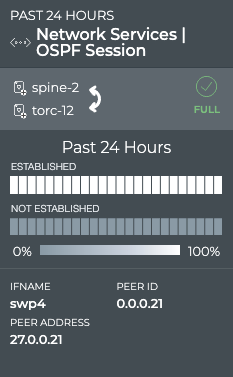
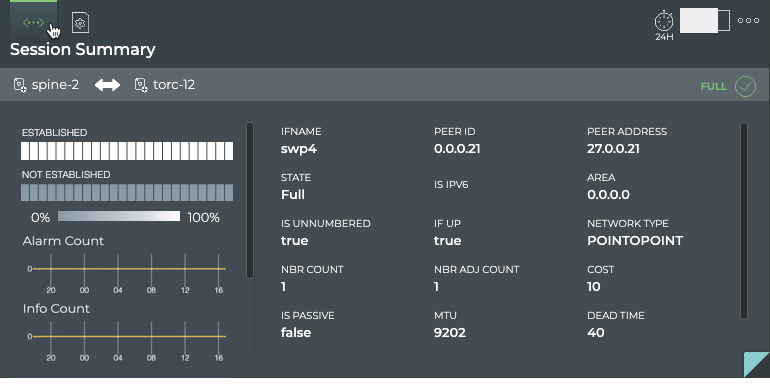
Network Services: information about the network services and sessions
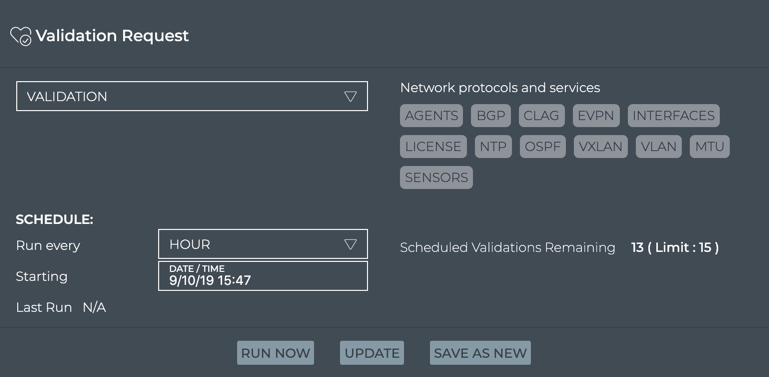
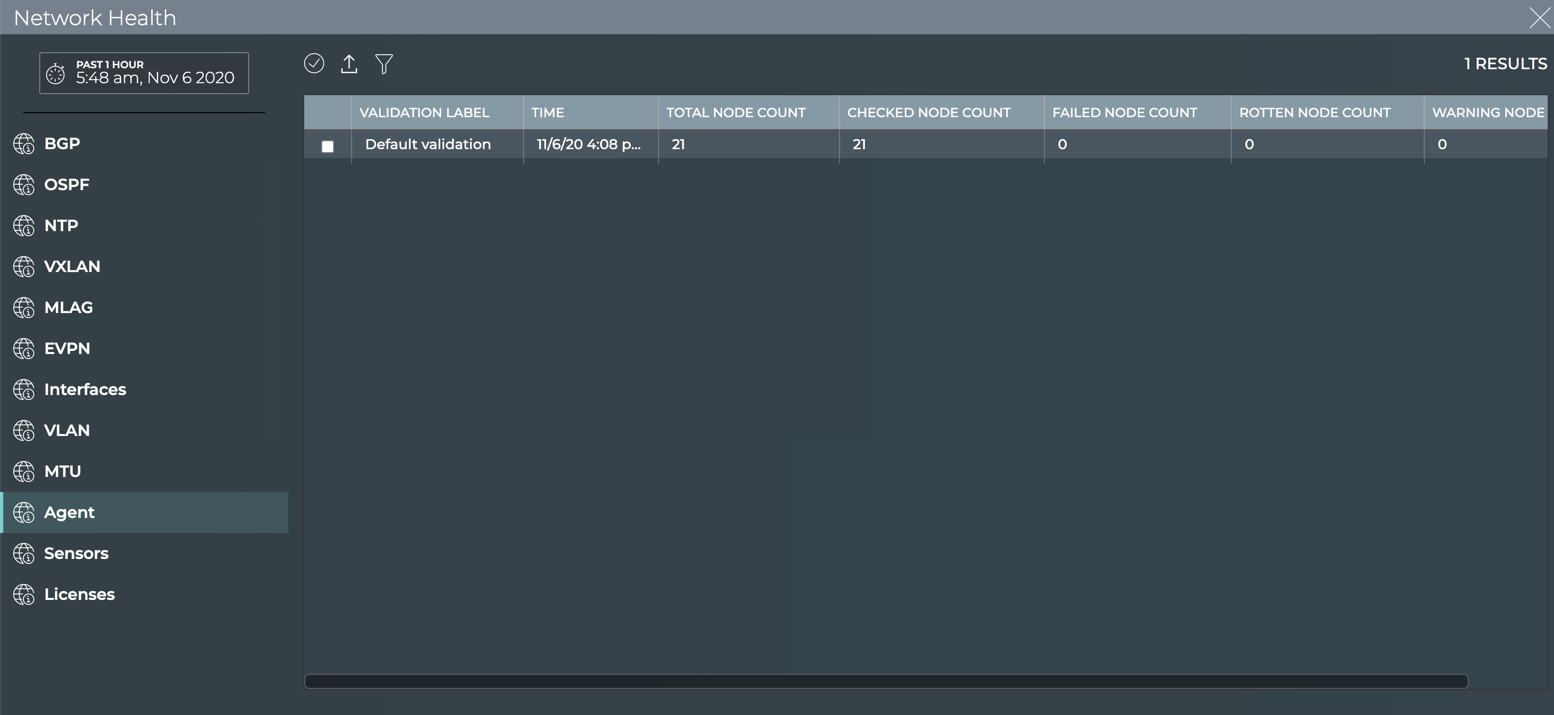
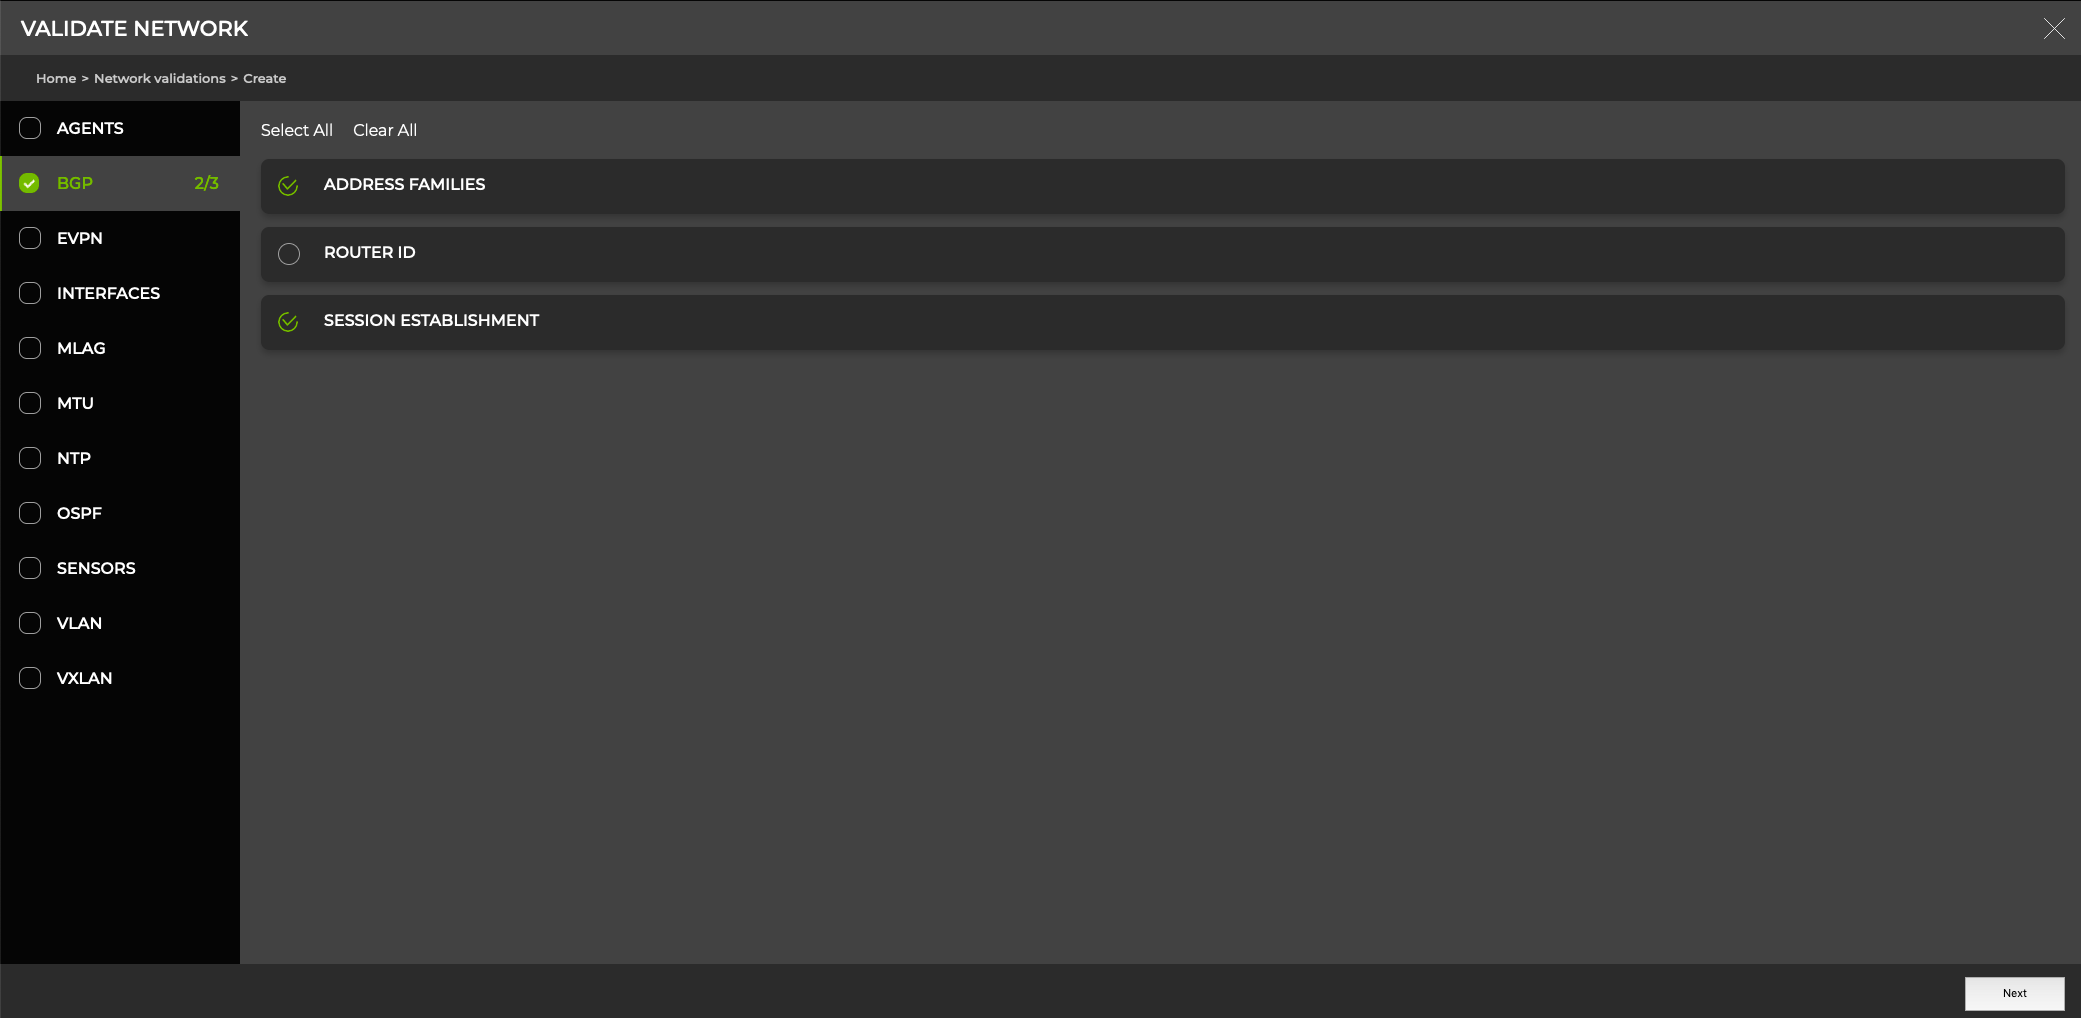
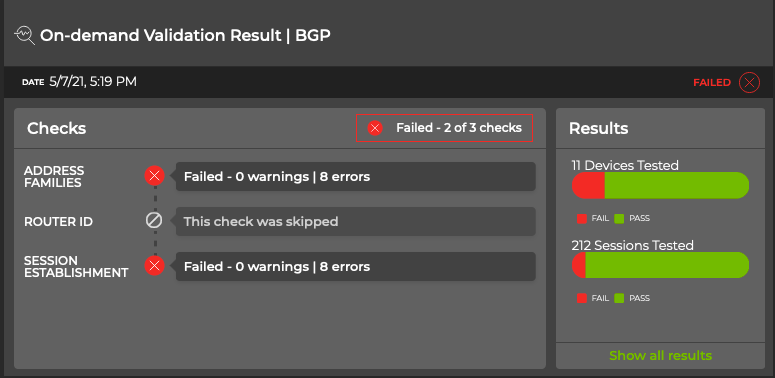
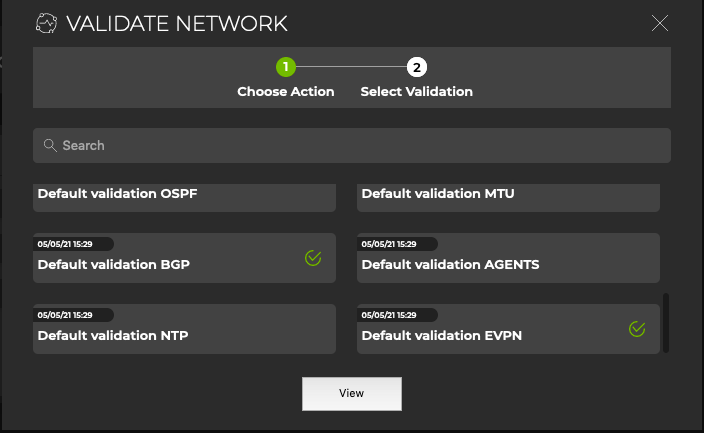
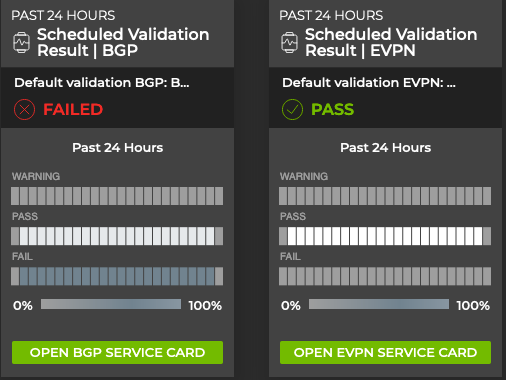
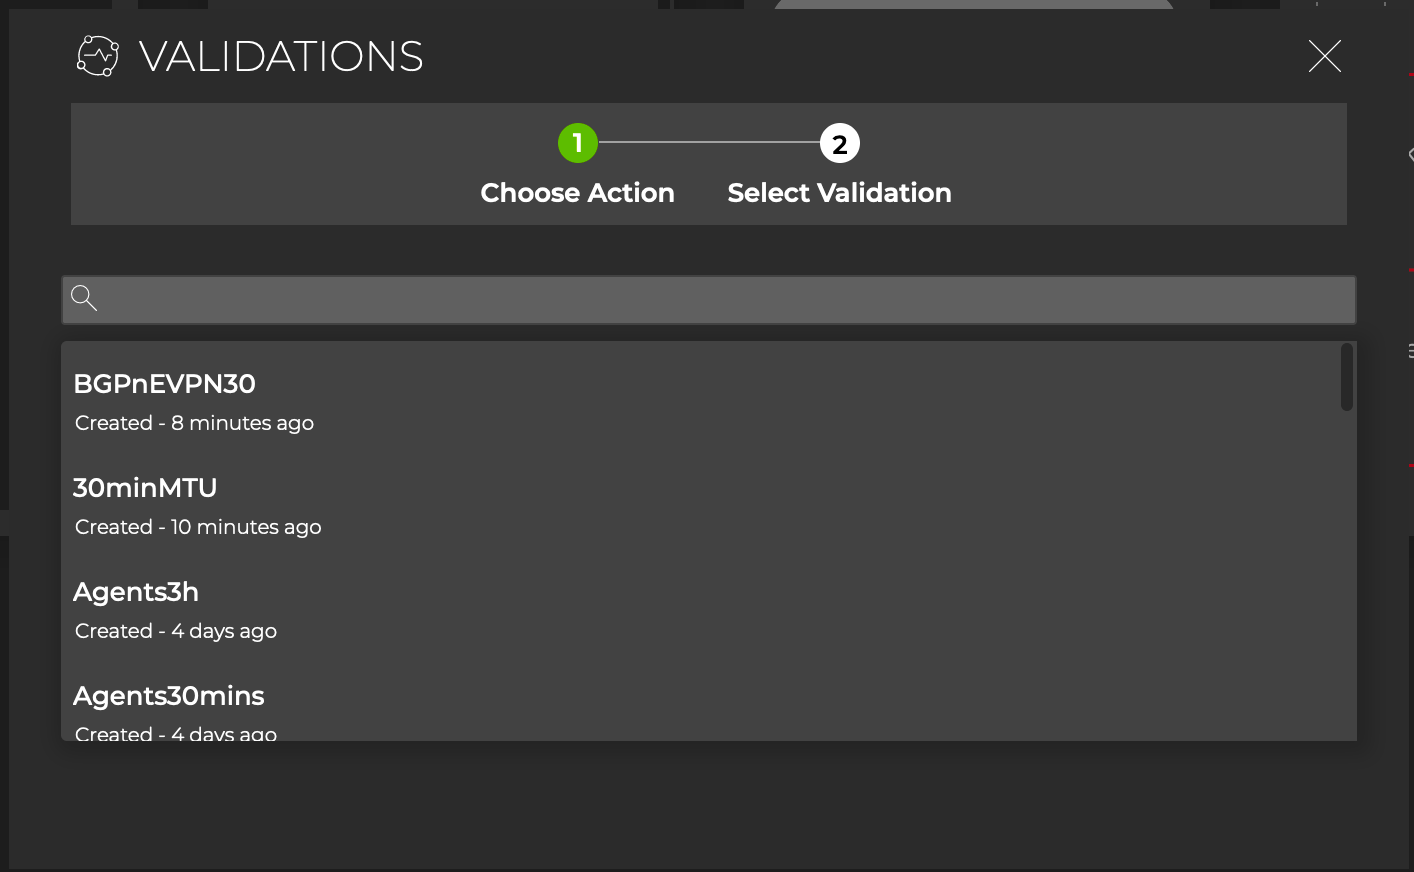
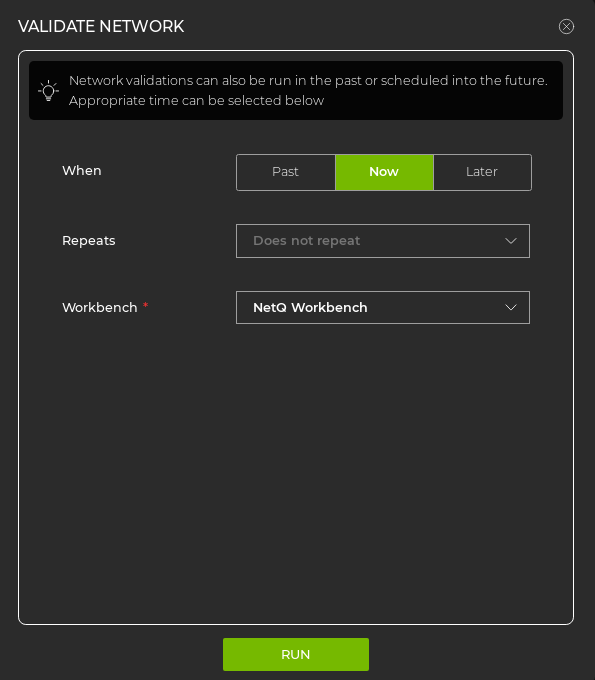
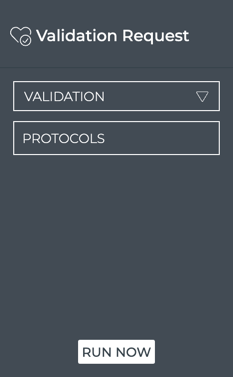
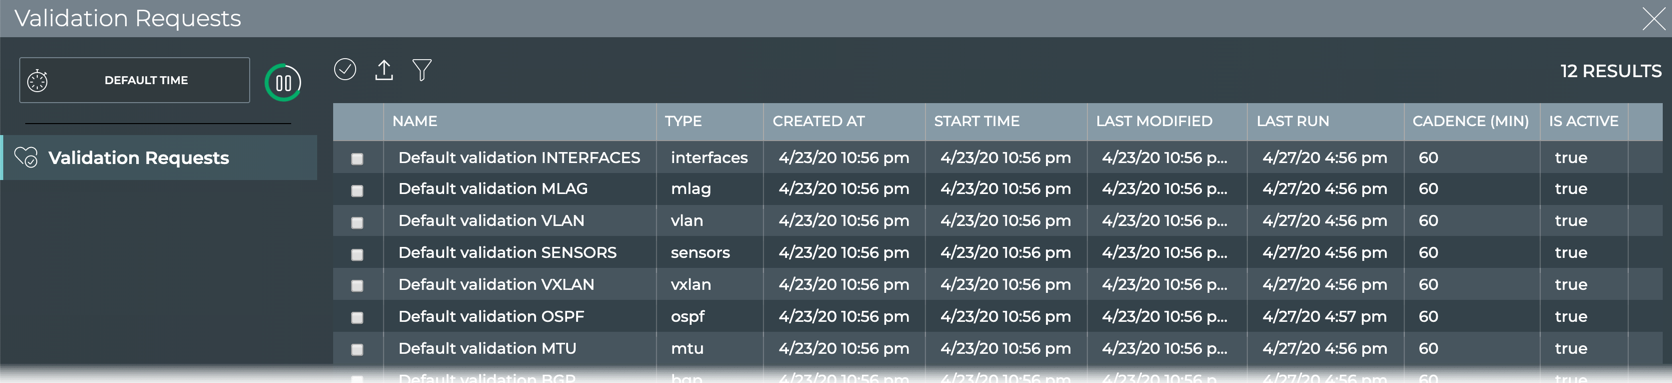
Validation Request (and Results): networkwide validation of network protocols and services
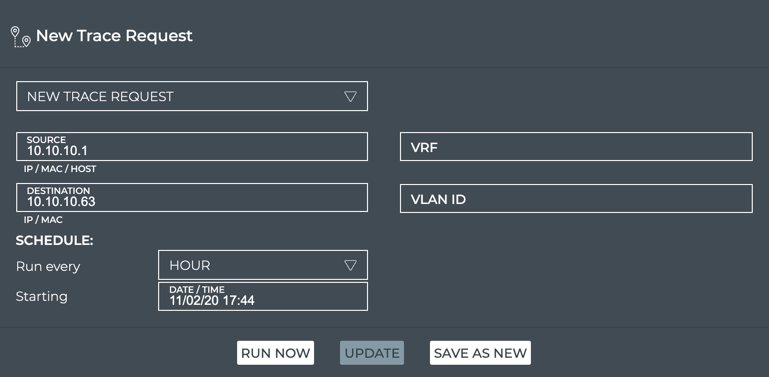
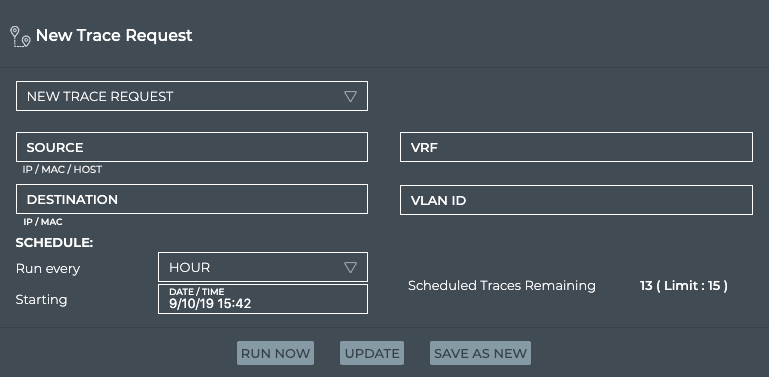
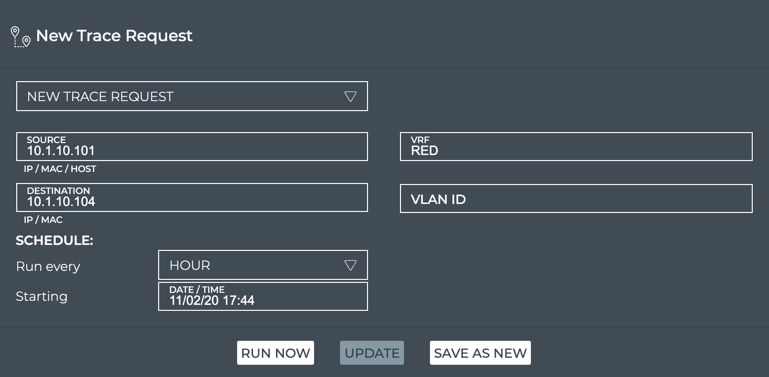
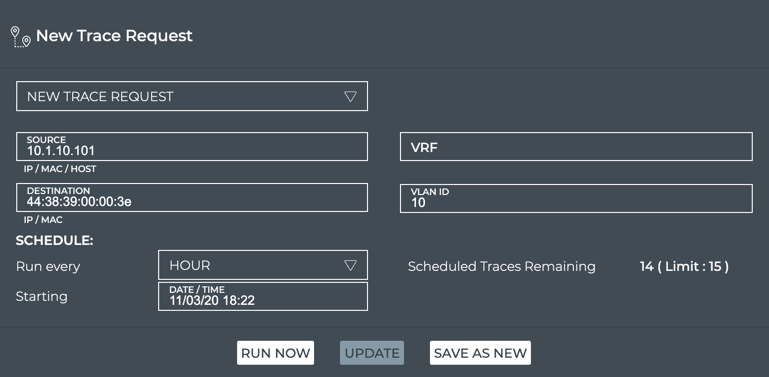
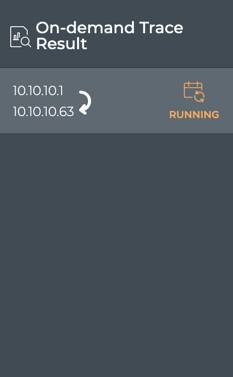
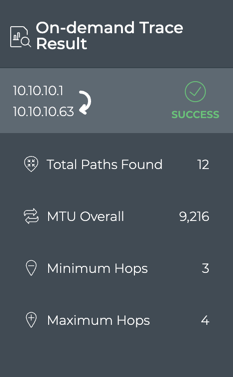
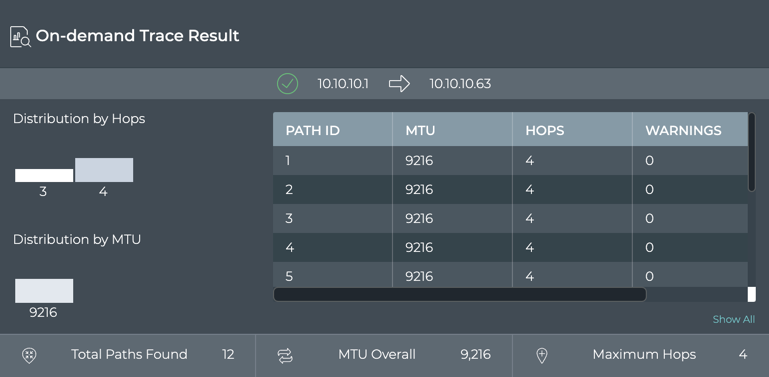
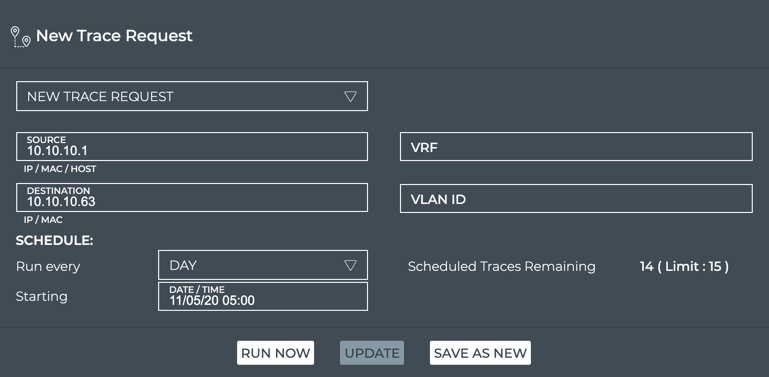
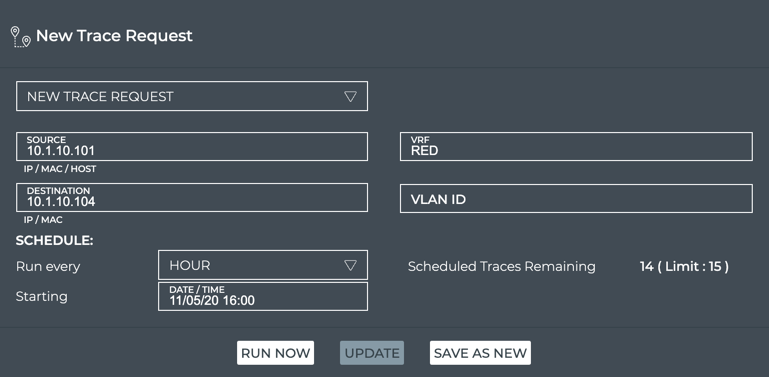
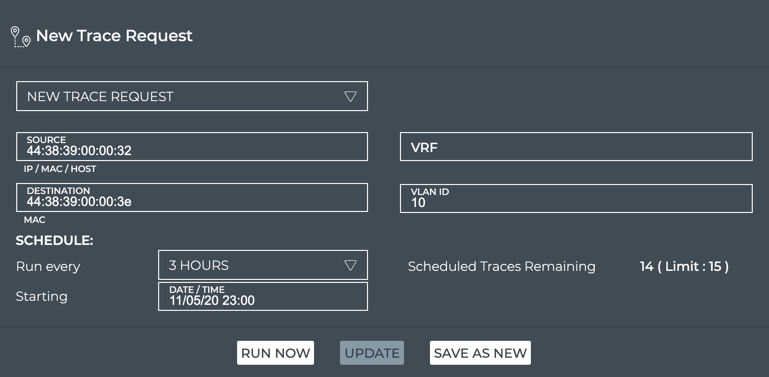
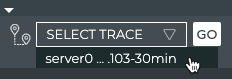
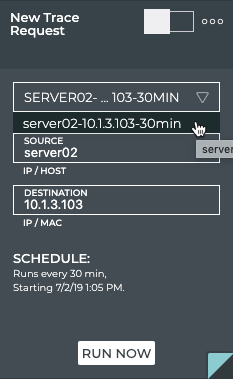
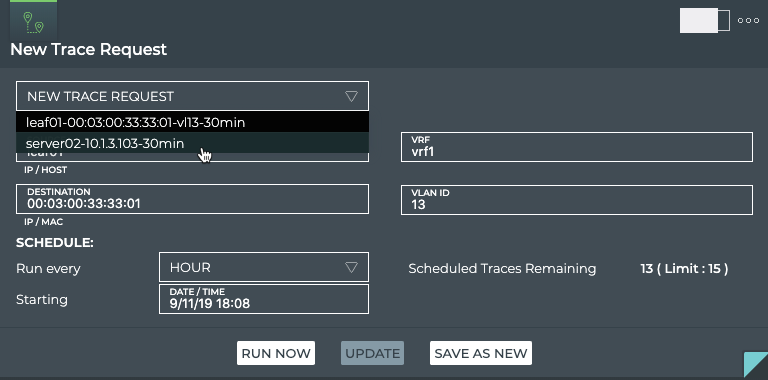
Trace Request (and Results): find available paths between two devices in the network fabric
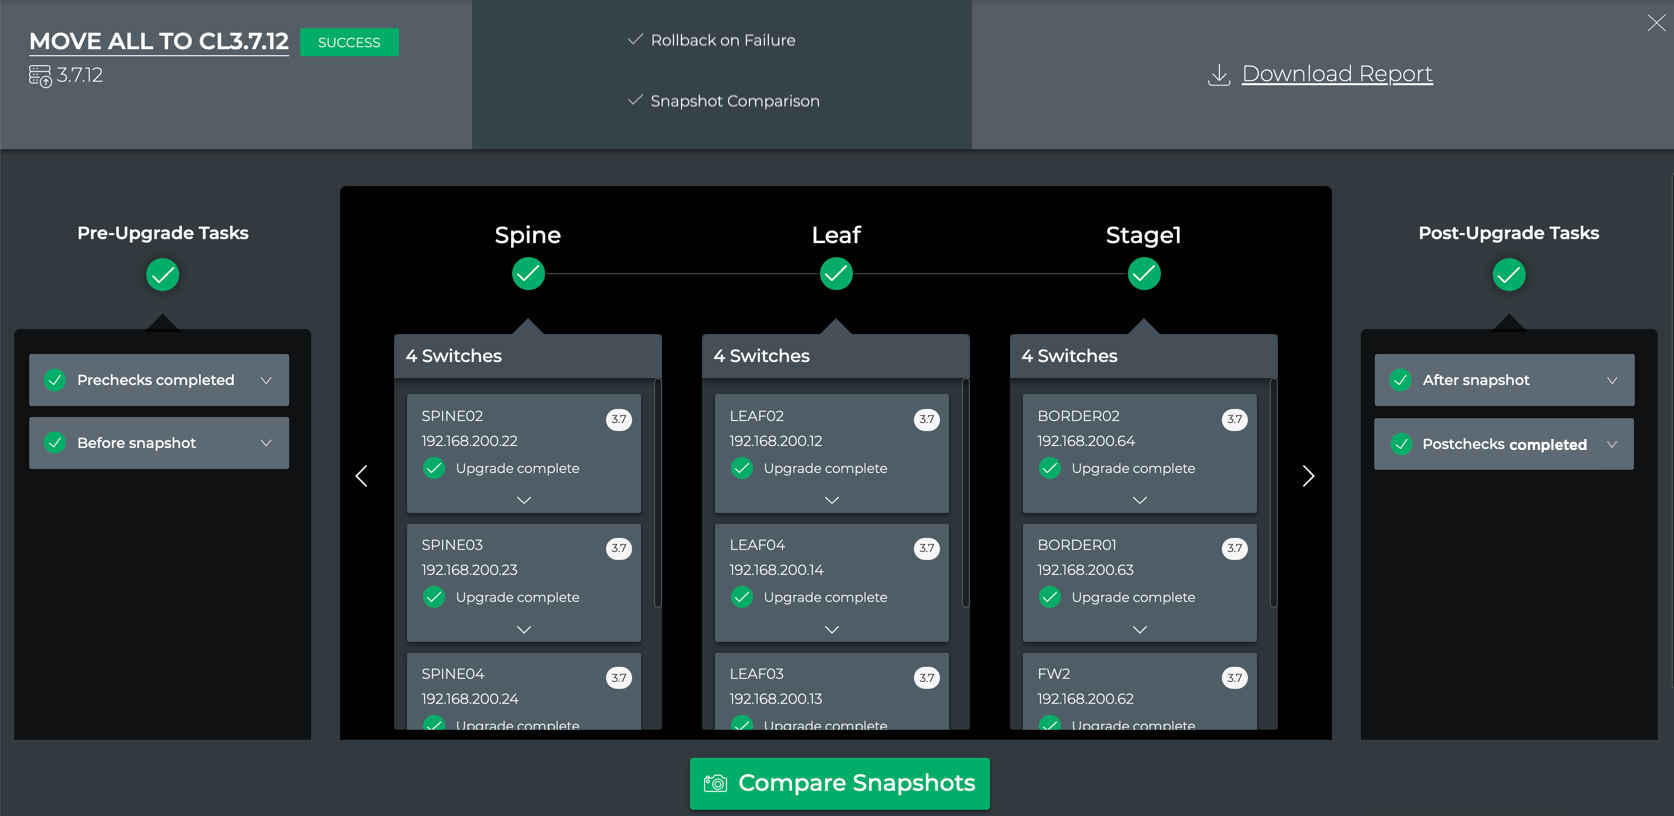
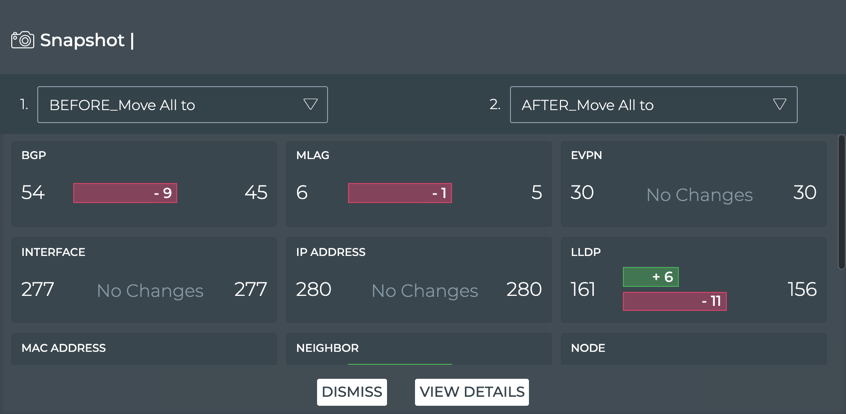
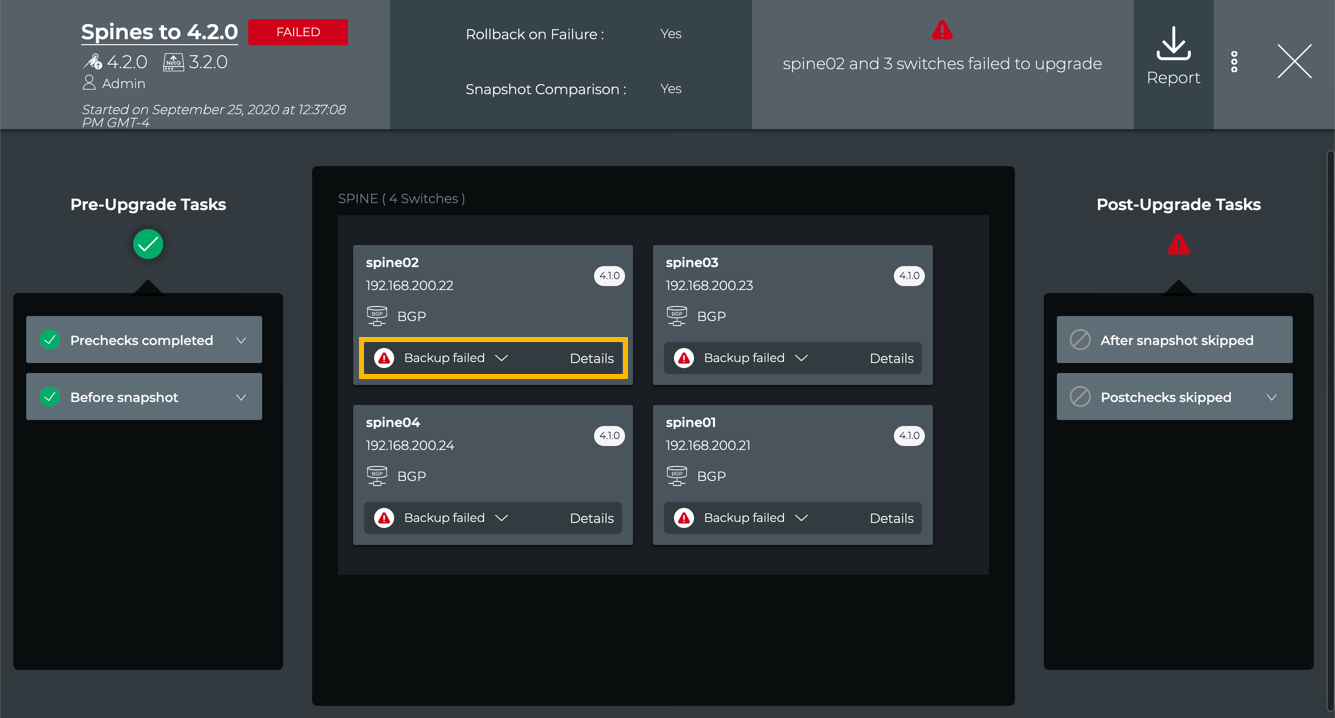
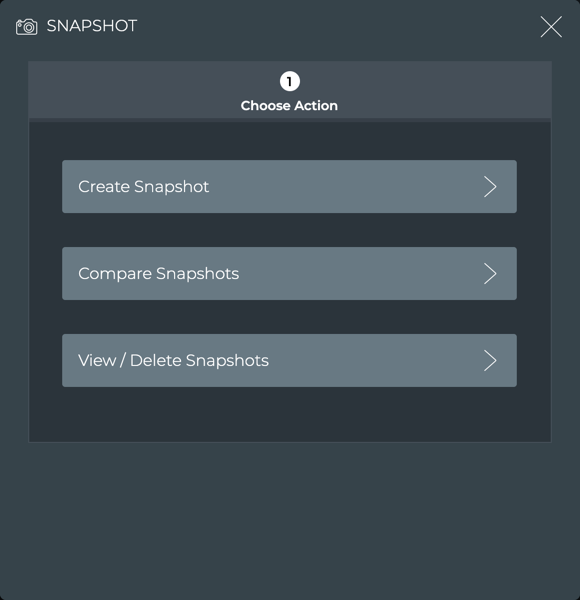
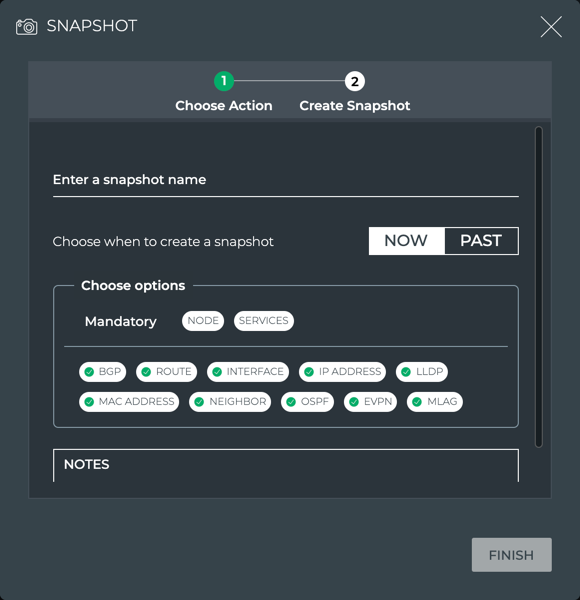
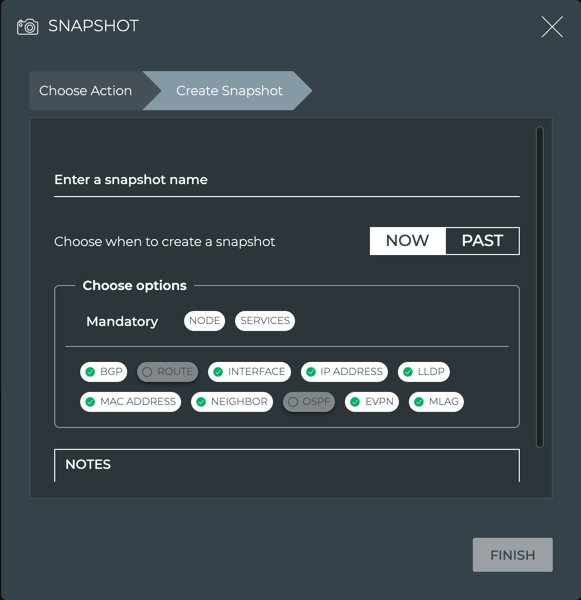
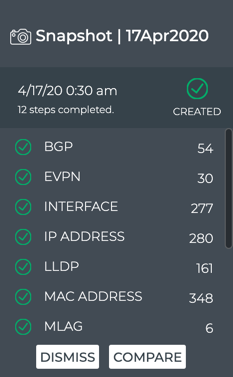
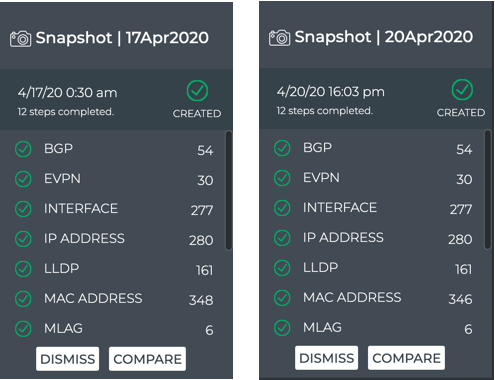
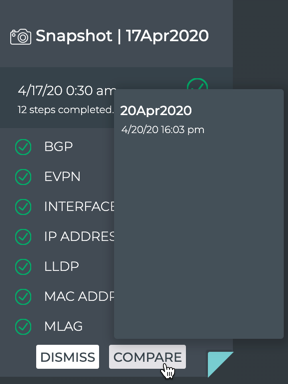
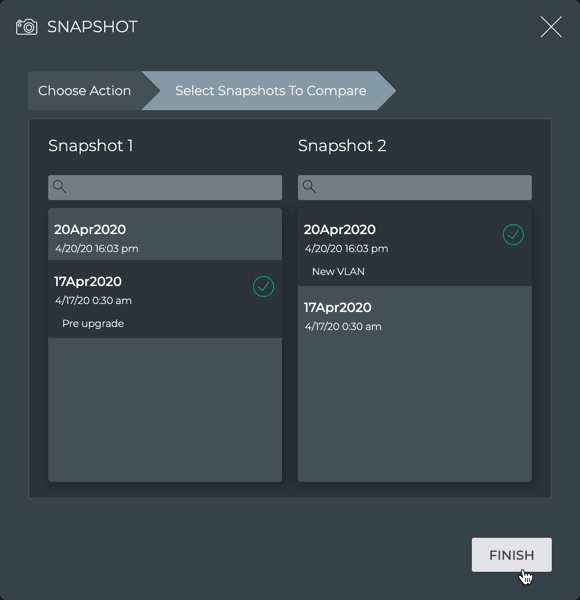
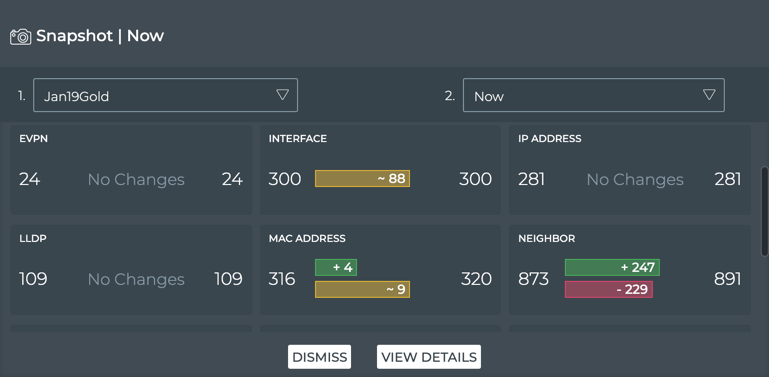
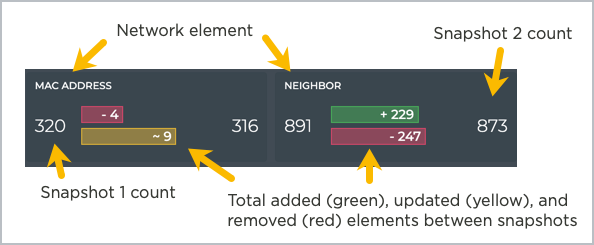
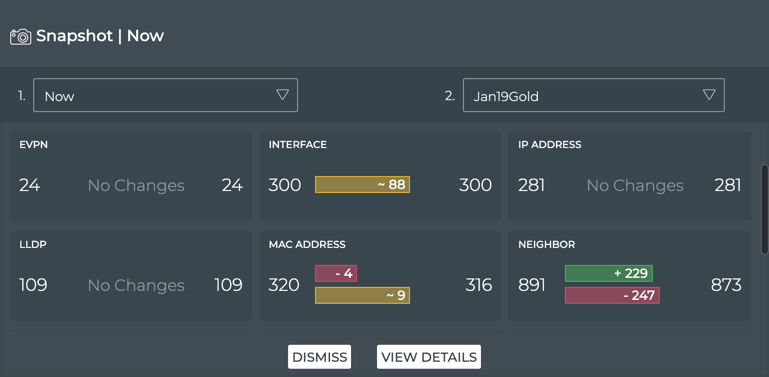
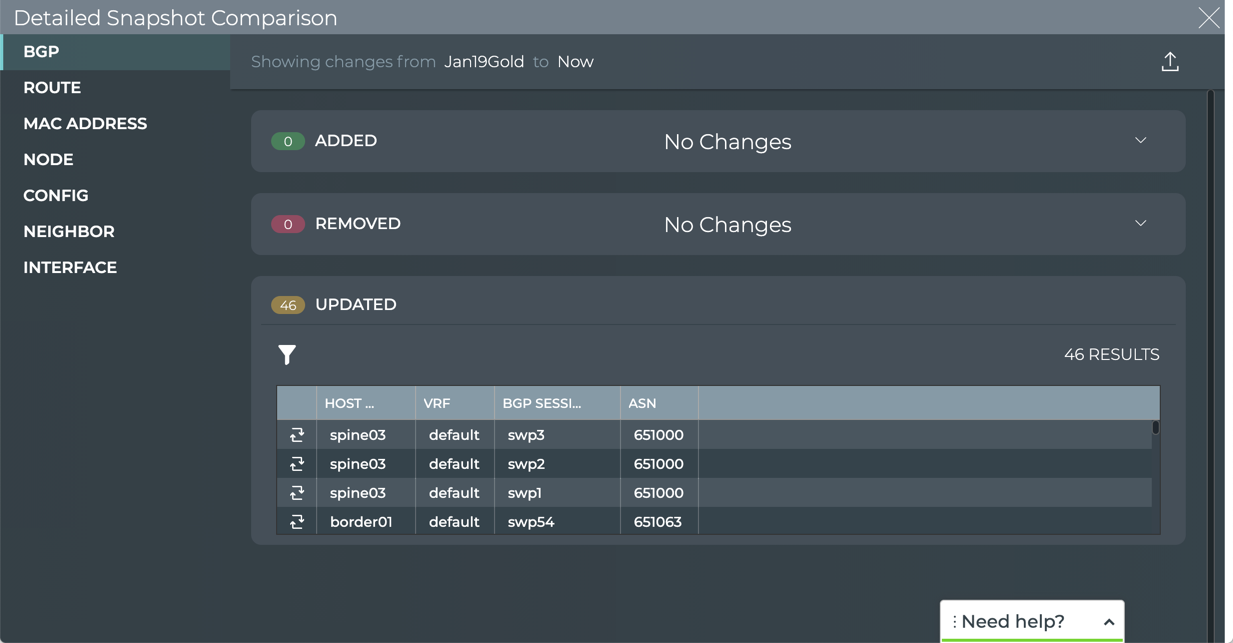
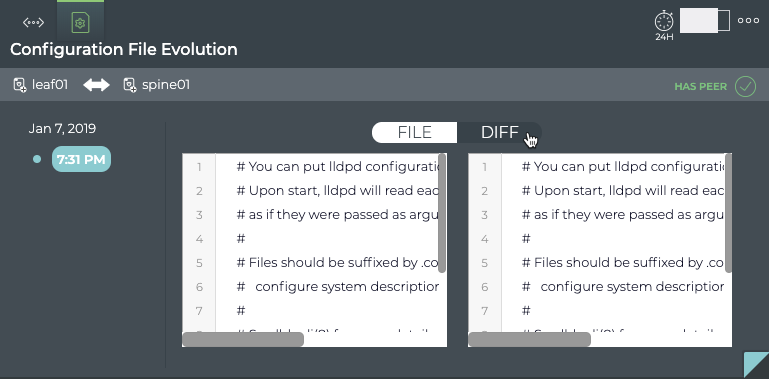
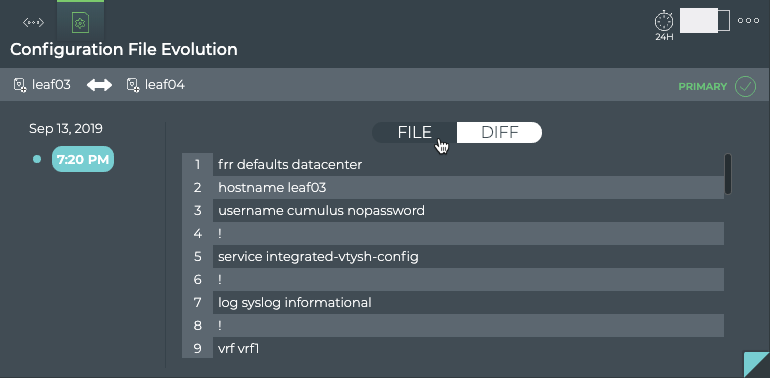
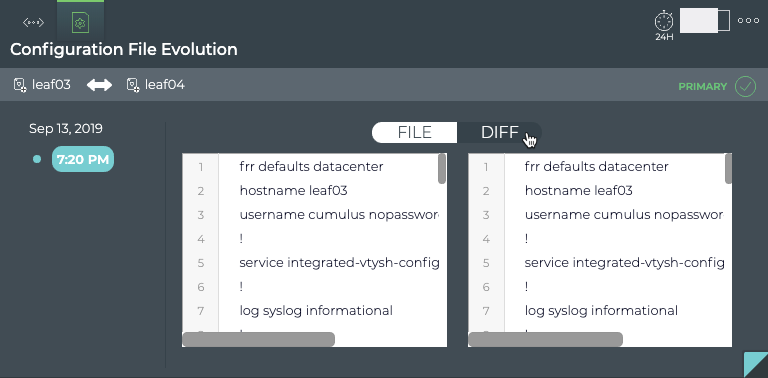
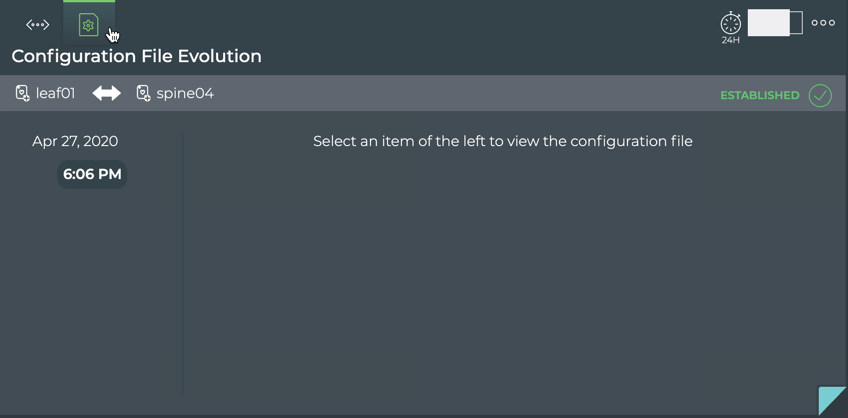
Network Snapshot: view and compare the network state at various times
Access a Card Workflow
You can access a card workflow in multiple ways:
For workbenches available from the main menu, open the workbench that contains the card flow
Open a prior search
Add it to a workbench
Search for it
If you have multiple cards open on your workbench already, you might need to scroll down to see the card you have just added.
To open the card workflow through an existing workbench:
Click in the workbench task bar.
Select the relevant workbench.
The workbench opens, hiding your previous workbench.
To open the card workflow from Recent Actions:
Click in the application header.
Look for an “Add: <card name>” item.
If it is still available, click the item.
The card appears on the current workbench, at the bottom.
The card appears on the current workbench, at the bottom.
To access the card workflow by searching for the card:
Click in the Global Search field.
Begin typing the name of the card.
Select it from the list.
The card appears on a current workbench, at the bottom.
Card Interactions
Every card contains a standard set of interactions, including the ability to switch between card sizes, and change the time period of the presented data. Most cards also have additional actions that can be taken, in the form of links to other cards, scrolling, and so forth. The four sizes of cards for a particular aspect of the network are connected into a flow; however, you can have duplicate cards displayed at the different sizes. Cards with tabular data provide filtering, sorting, and export of data. The medium and large cards have descriptive text on the back of the cards.
To access the time period, card size, and additional actions, hover over the card. These options appear, covering the card header, enabling you to select the desired option.
Add Cards to Your Workbench
You can add one or more cards to a workbench at any time. To add Devices|Switches cards, refer to Add Switch Cards to Your Workbench. For all other cards, follow the steps in this section.
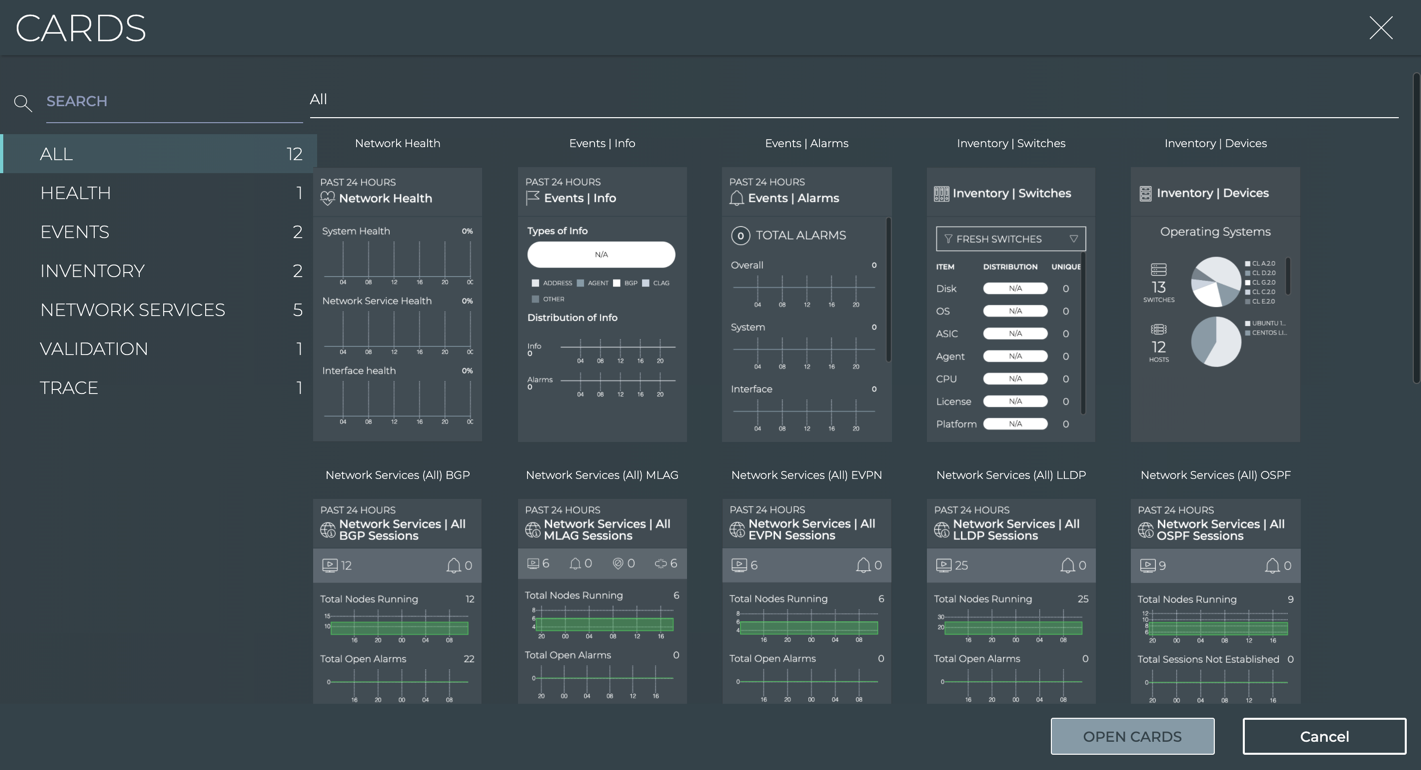
To add one or more cards:
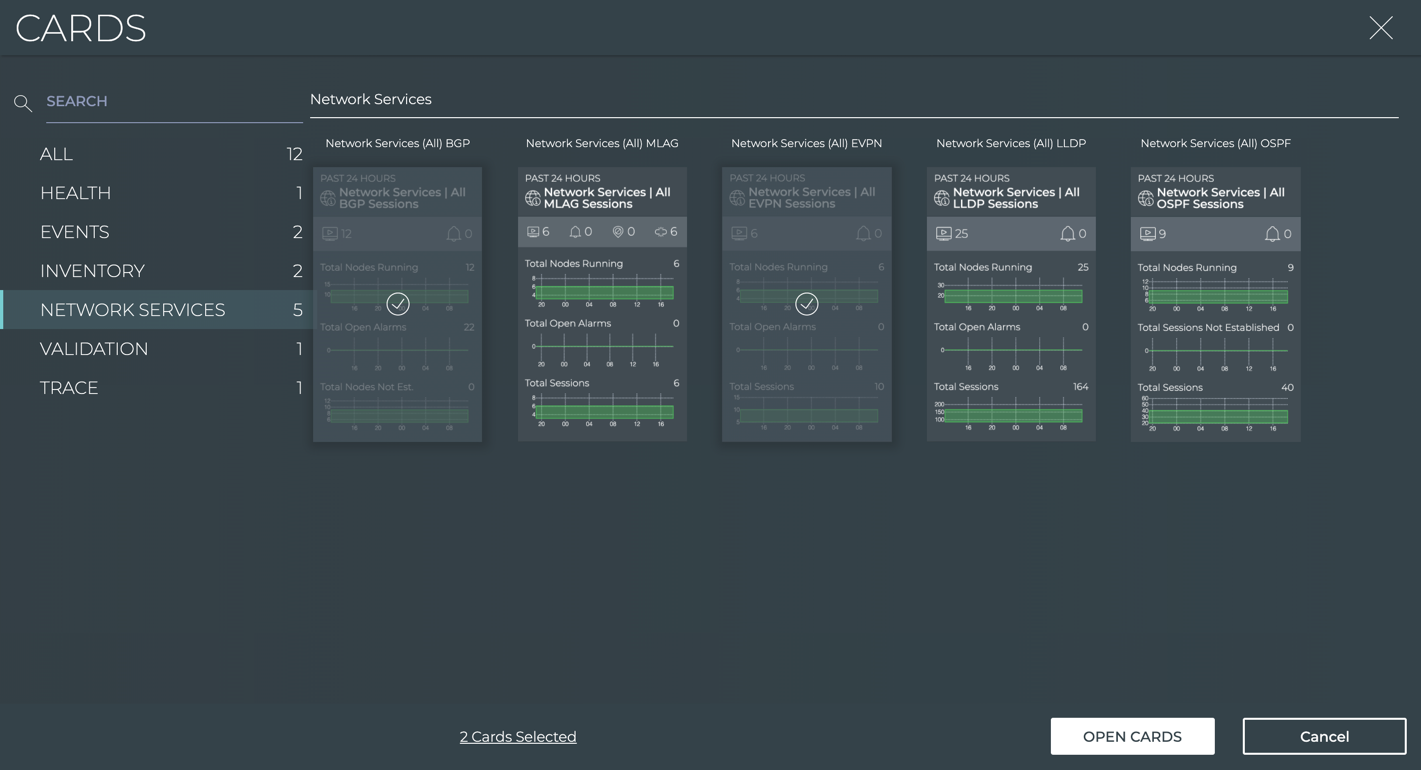
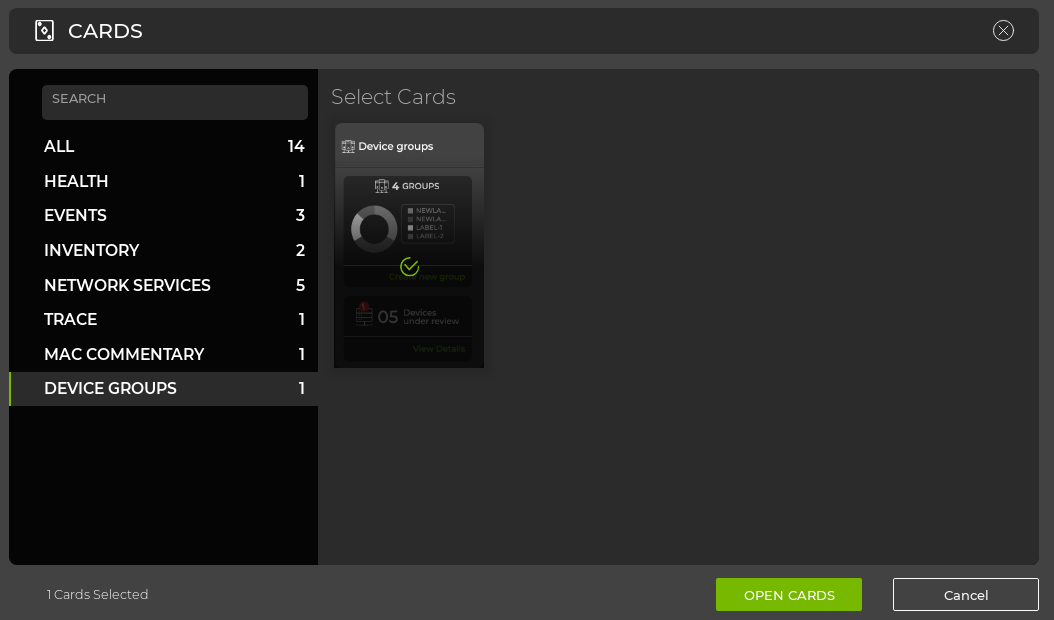
Click to open the Cards modal.
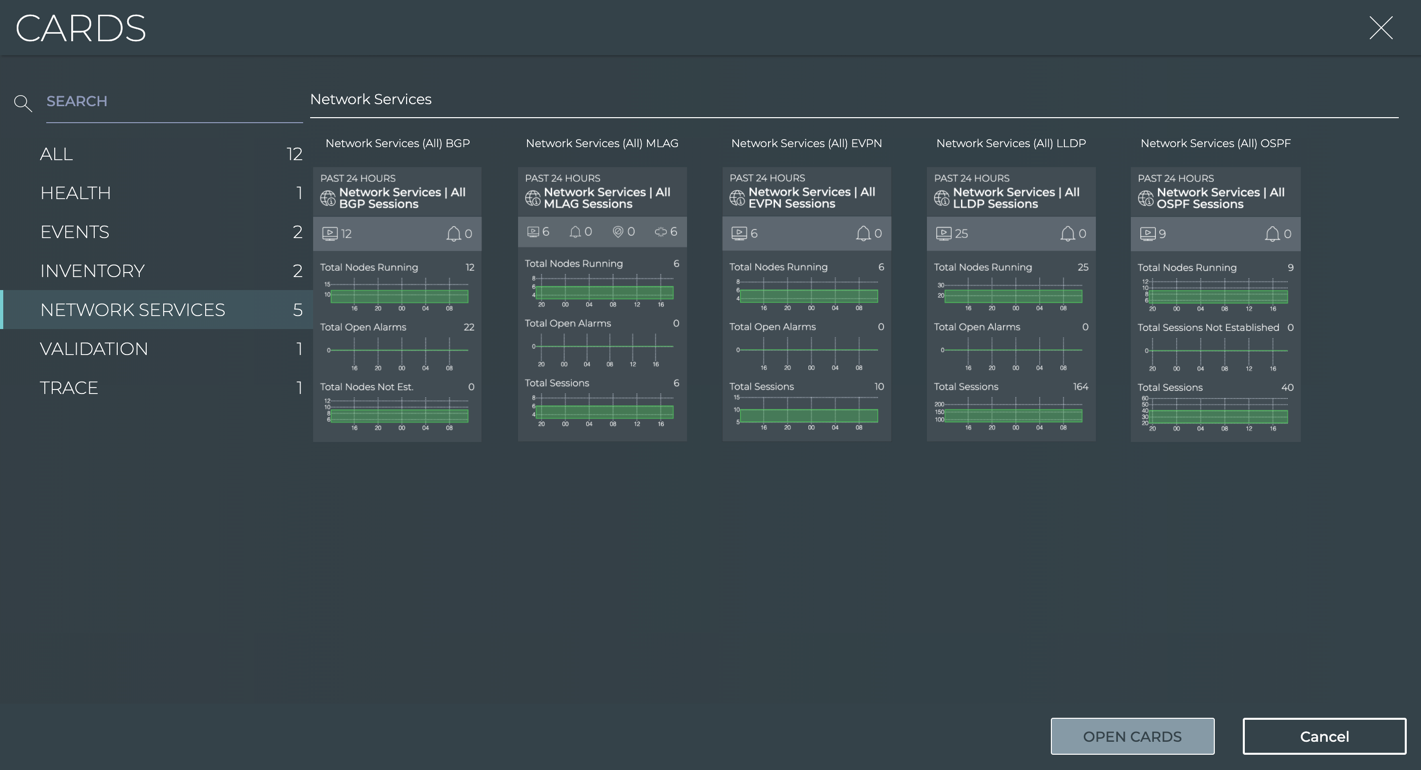
Scroll down until you find the card you want to add, select the category of cards, or use Search to find the card you want to add.
This example uses the category tab to narrow the search for a card.
Click on each card you want to add.
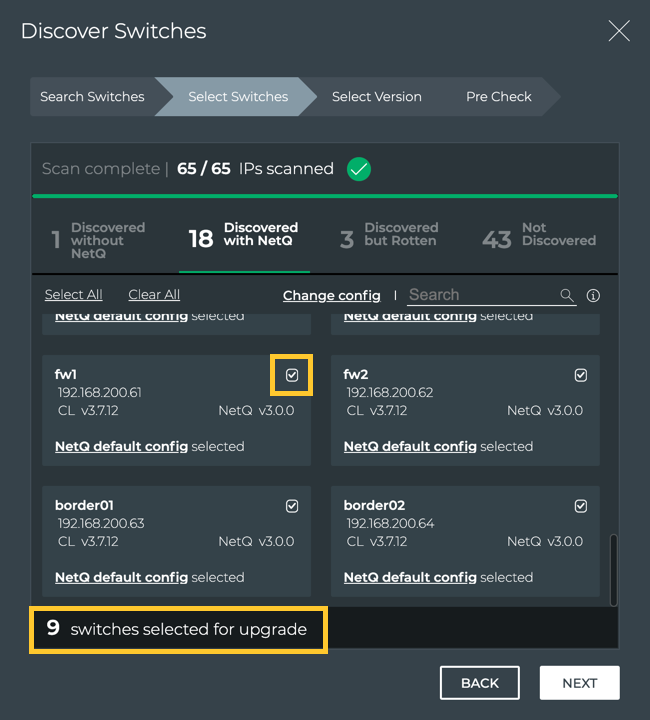
As you select each card, it is grayed out and a appears on top of it. If you have selected one or more cards using the category option, you can selected another category without losing your current selection. Note that the total number of cards selected for addition to your workbench is noted at the bottom.
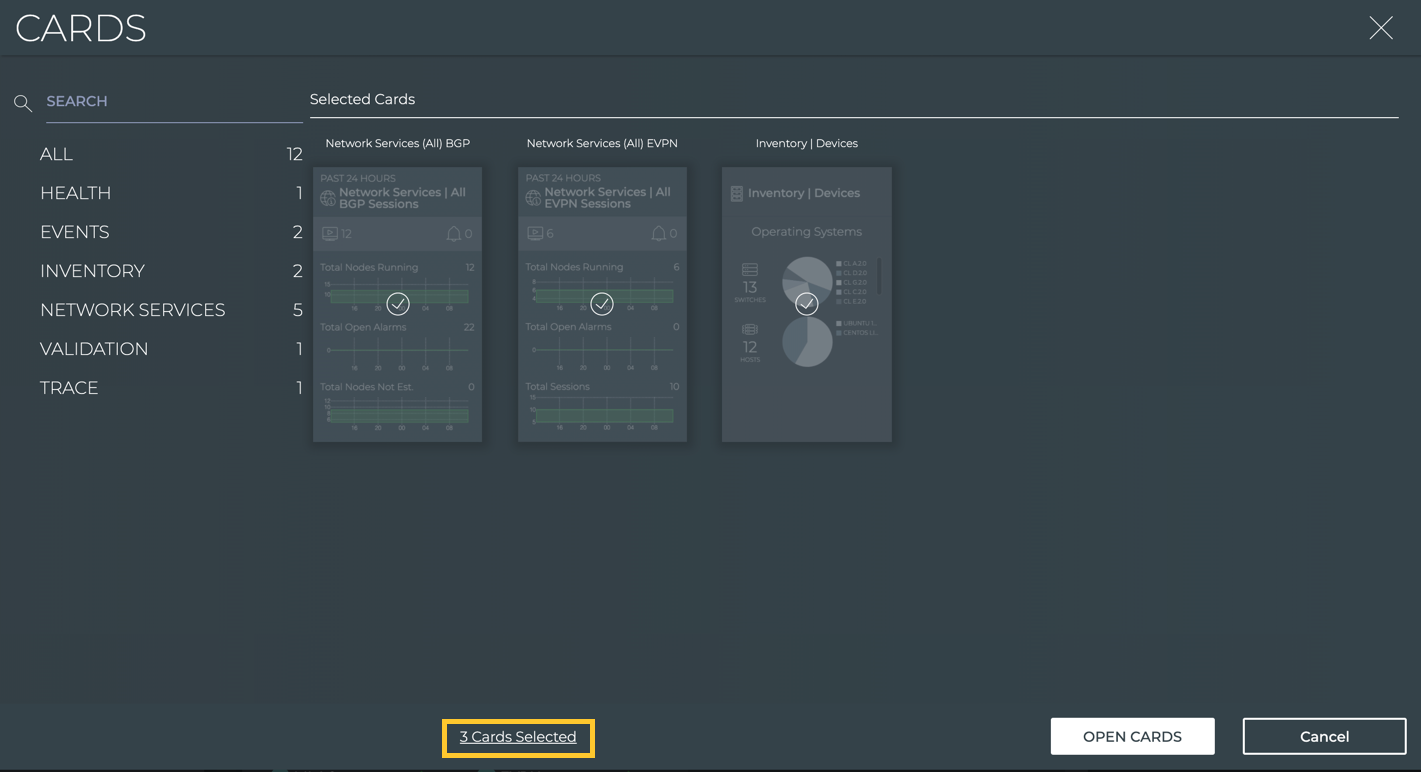
Also note that if you change your mind and do not want to add a particular card you have selected, simply click on it again to remove it from the cards to be added. Note the total number of cards selected decreases with each card you remove.
When you have selected all of the cards you want to add to your workbench, you can confirm which cards have been selected by clicking the Cards Selected link. Modify your selection as needed.
Click Open Cards to add the selected cards, or Cancel to return to your workbench without adding any cards.
The cards are placed at the end of the set of cards currently on the workbench. You might need to scroll down to see them. By default, the medium size of the card is added to your workbench for all except the Validation and Trace cards. These are added in the large size by default. You can rearrange the cards as described in Reposition a Card on Your Workbench.
Add Switch Cards to Your Workbench
You can add switch cards to a workbench at any time. For all other cards, follow the steps in Add Cards to Your Workbench. You can either add the card through the Switches icon on a workbench header or by searching for it through Global Search.
To add a switch card using the icon:
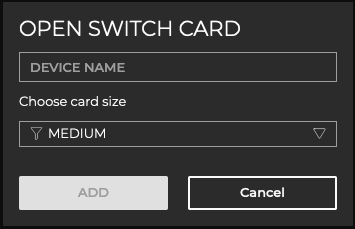
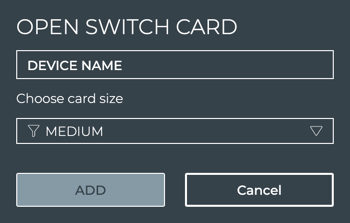
Click , then select Open a switch card to open the Open Switch Card modal.
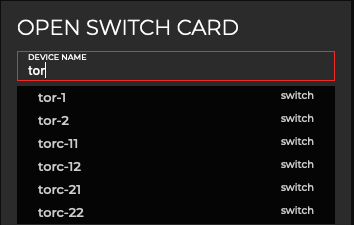
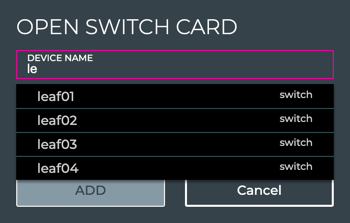
Begin entering the hostname of the switch you want to monitor.
Select the device from the suggestions that appear.
If you attempt to enter a hostname that is unknown to NetQ, a red border appears around the entry field and you are unable to select Add. Try checking for spelling errors. If you feel your entry is valid, but not an available choice, consult with your network administrator.
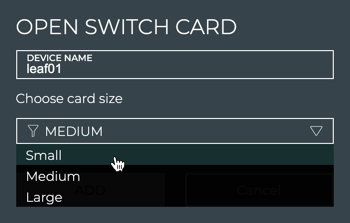
Optionally select the small or large size to display instead of the medium size.
Click Add to add the switch card to your workbench, or Cancel to return to your workbench without adding the switch card.
To open the switch card by searching:
Click in Global Search.
Begin typing the name of a switch.
Select it from the options that appear.
Remove Cards from Your Workbench
Removing cards is handled one card at a time.
To remove a card:
Hover over the card you want to remove.
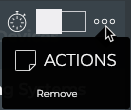
Click (More Actions menu).
Click Remove.
The card is removed from the workbench, but not from the application.
Change the Time Period for the Card Data
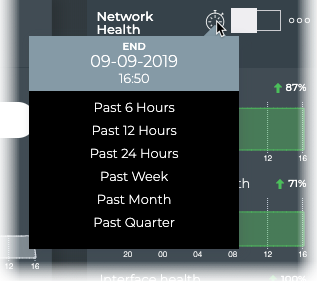
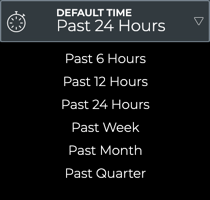
All cards have a default time period for the data shown on the card, typically the last 24 hours. You can change the time period to view the data during a different time range to aid analysis of previous or existing issues.
To change the time period for a card:
Hover over any card.
Click in the header.
Select a time period from the dropdown list.
Changing the time period in this manner only changes the time period for the given card.
Switch to a Different Card Size
You can switch between the different card sizes at any time. Only one size is visible at a time. To view the same card in different sizes, open a second copy of the card.
To change the card size:
Hover over the card.
Hover over the Card Size Picker and move the cursor to the right or left until the desired size option is highlighted.
One-quarter width opens a small card. One-half width opens a medium card. Three-quarters width opens a large card. Full width opens a full-screen card.
Click the Picker. The card changes to the selected size, and might move its location on the workbench.
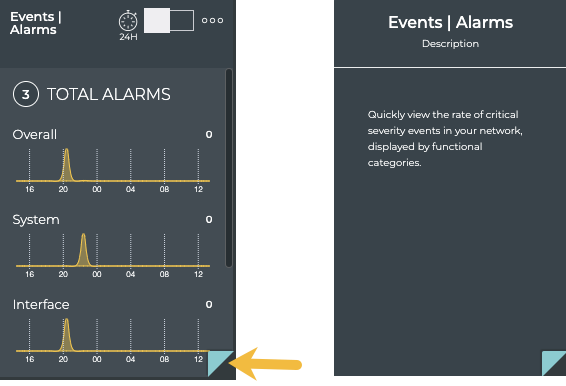
View a Description of the Card Content
When you hover over a medium or large card, the bottom right corner turns up and is highlighted. Clicking the corner turns the card over where a description of the card and any relevant tabs are described. Hover and click the corner again to turn it back to the front side.
Reposition a Card on Your Workbench
You can move cards around on the workbench.
Click and drag the card to the left, right, above, or below another card, to where you want to place the card.
Release your hold on the card when the other card becomes highlighted with a dotted line.
Table Settings
You can manipulate the data in a data grid in a full-screen card in several ways. The available options are displayed above each table. The options vary depending on the card and what is selected in the table.
Icon
Action
Description
Select All
Selects all items in the list.
Clear All
Clears all existing selections in the list.
Add Item
Adds item to the list.
Edit
Edits the selected item.
Delete
Removes the selected items.
Filter
Filters the list using available parameters. Refer to Filter Table Data for more detail.
,
Generate/Delete AuthKeys
Creates or removes NetQ CLI authorization keys.
Open Cards
Opens the corresponding validation or trace card(s).
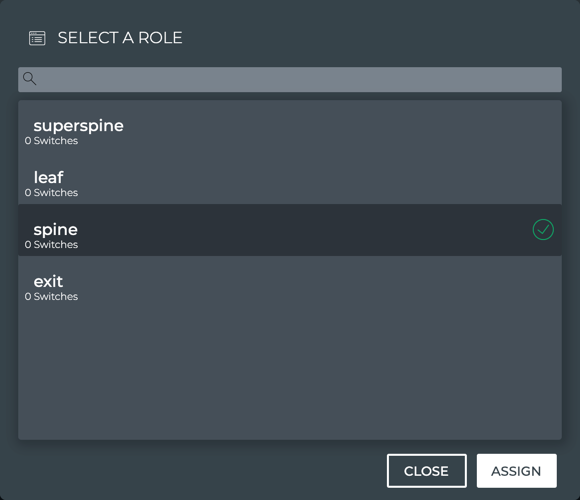
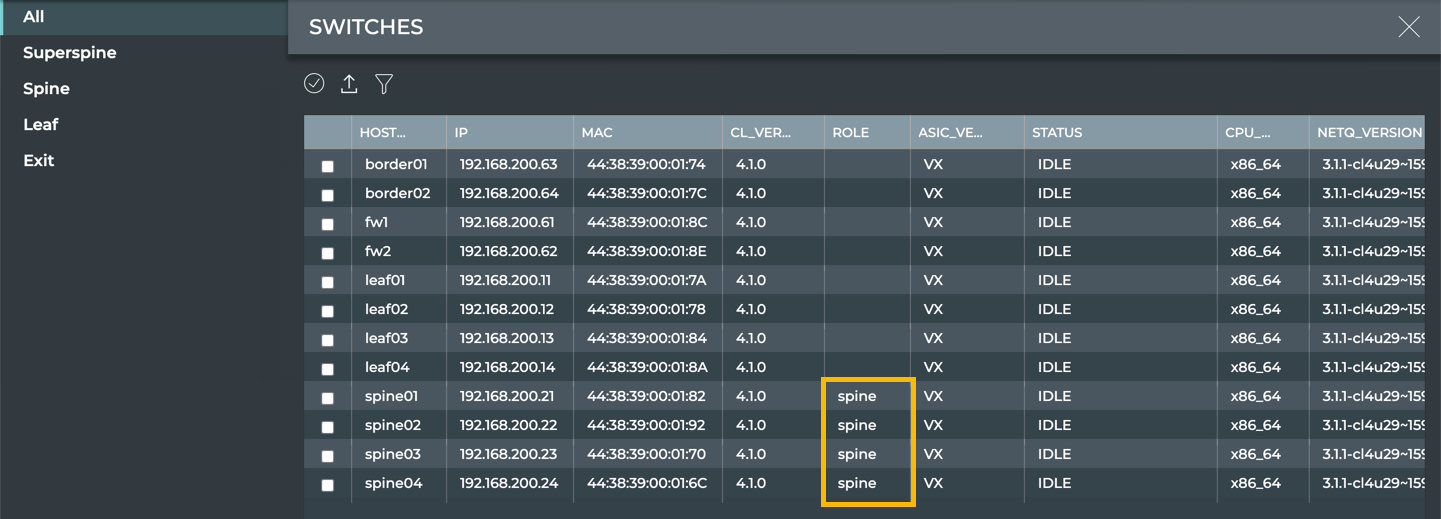
Assign role
Opens role assignment options for switches.
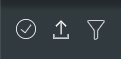
Export
Exports selected data into either a .csv or JSON-formatted file. Refer to Export Data for more detail.
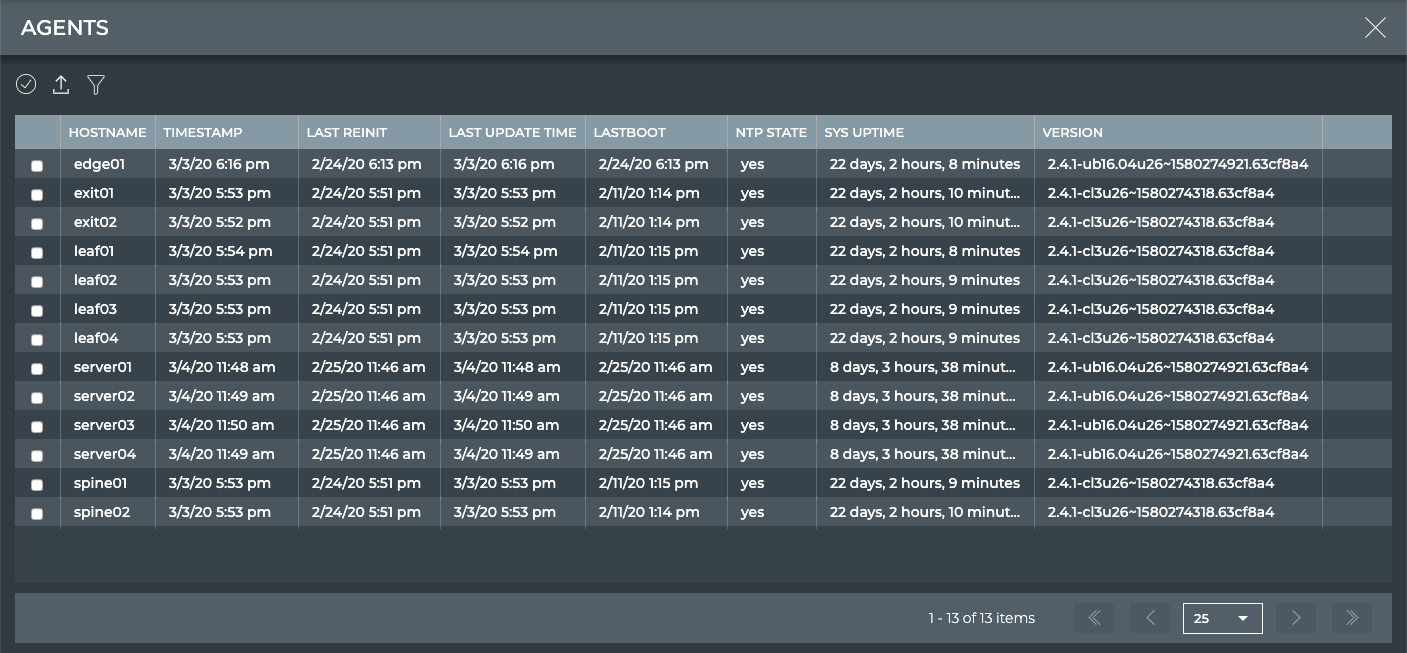
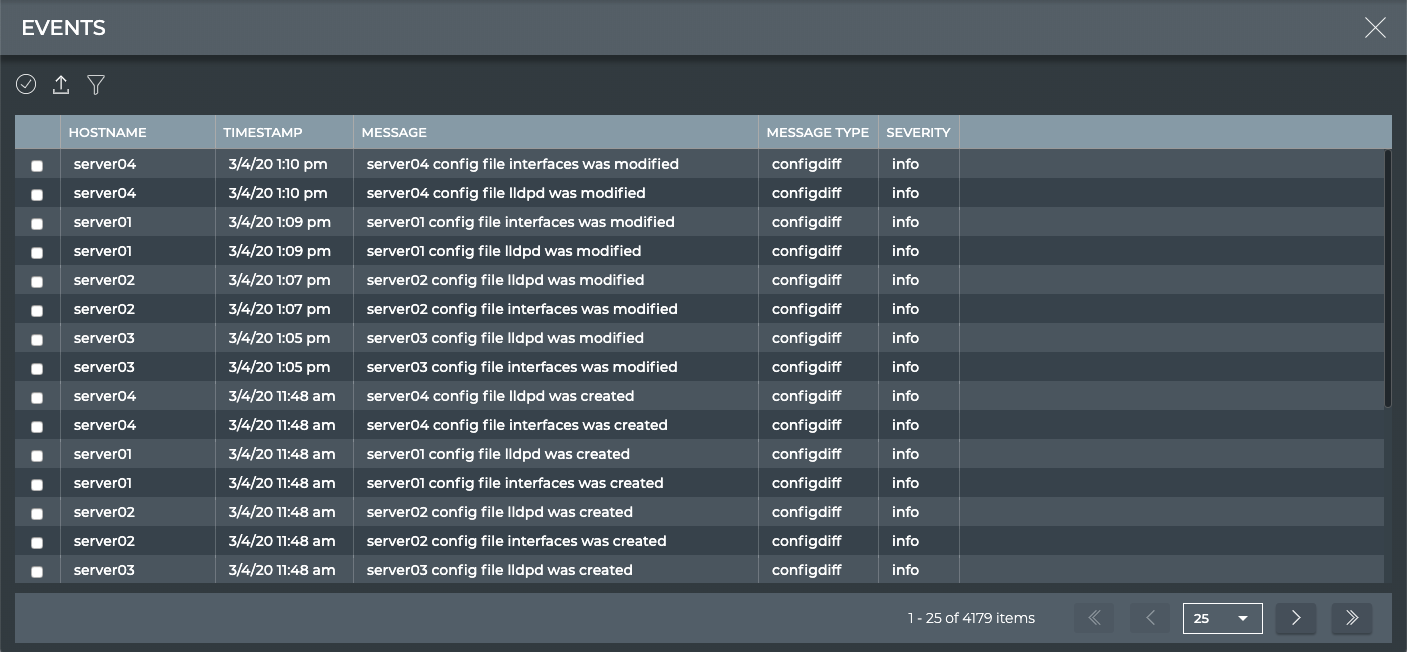
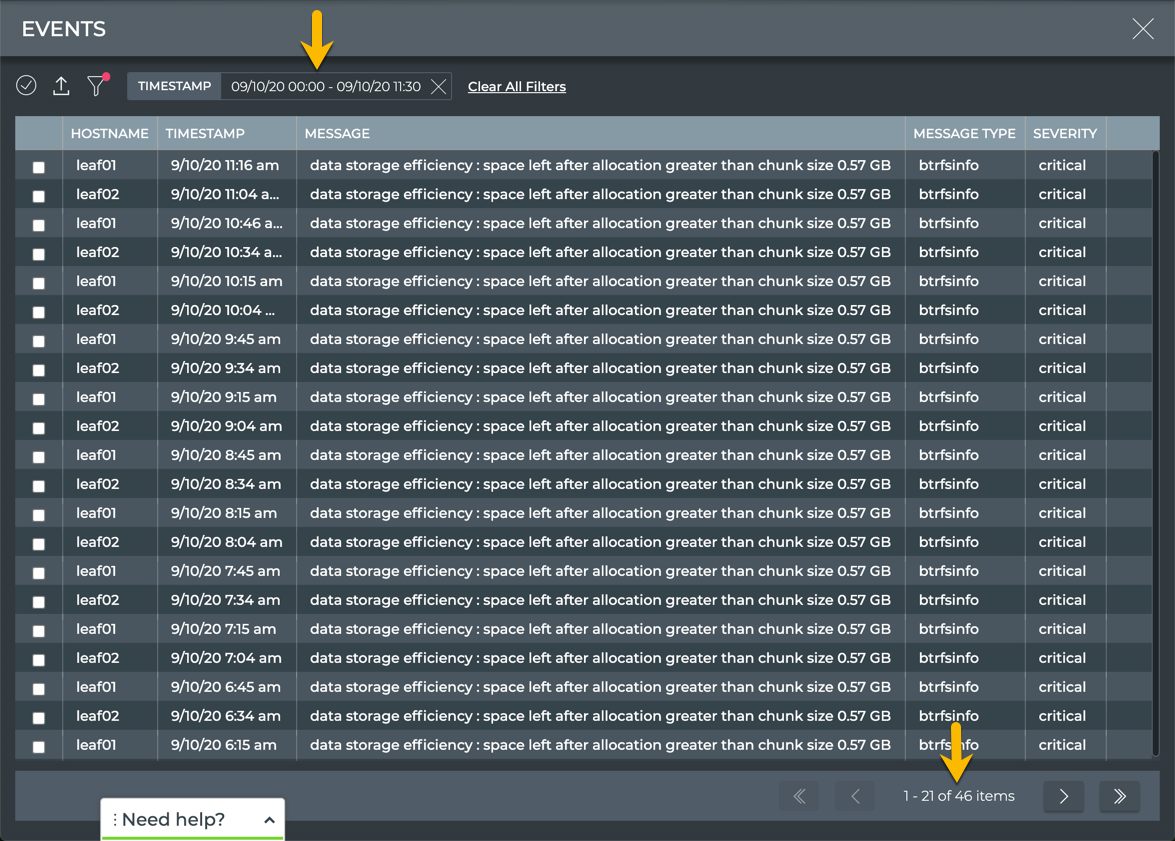
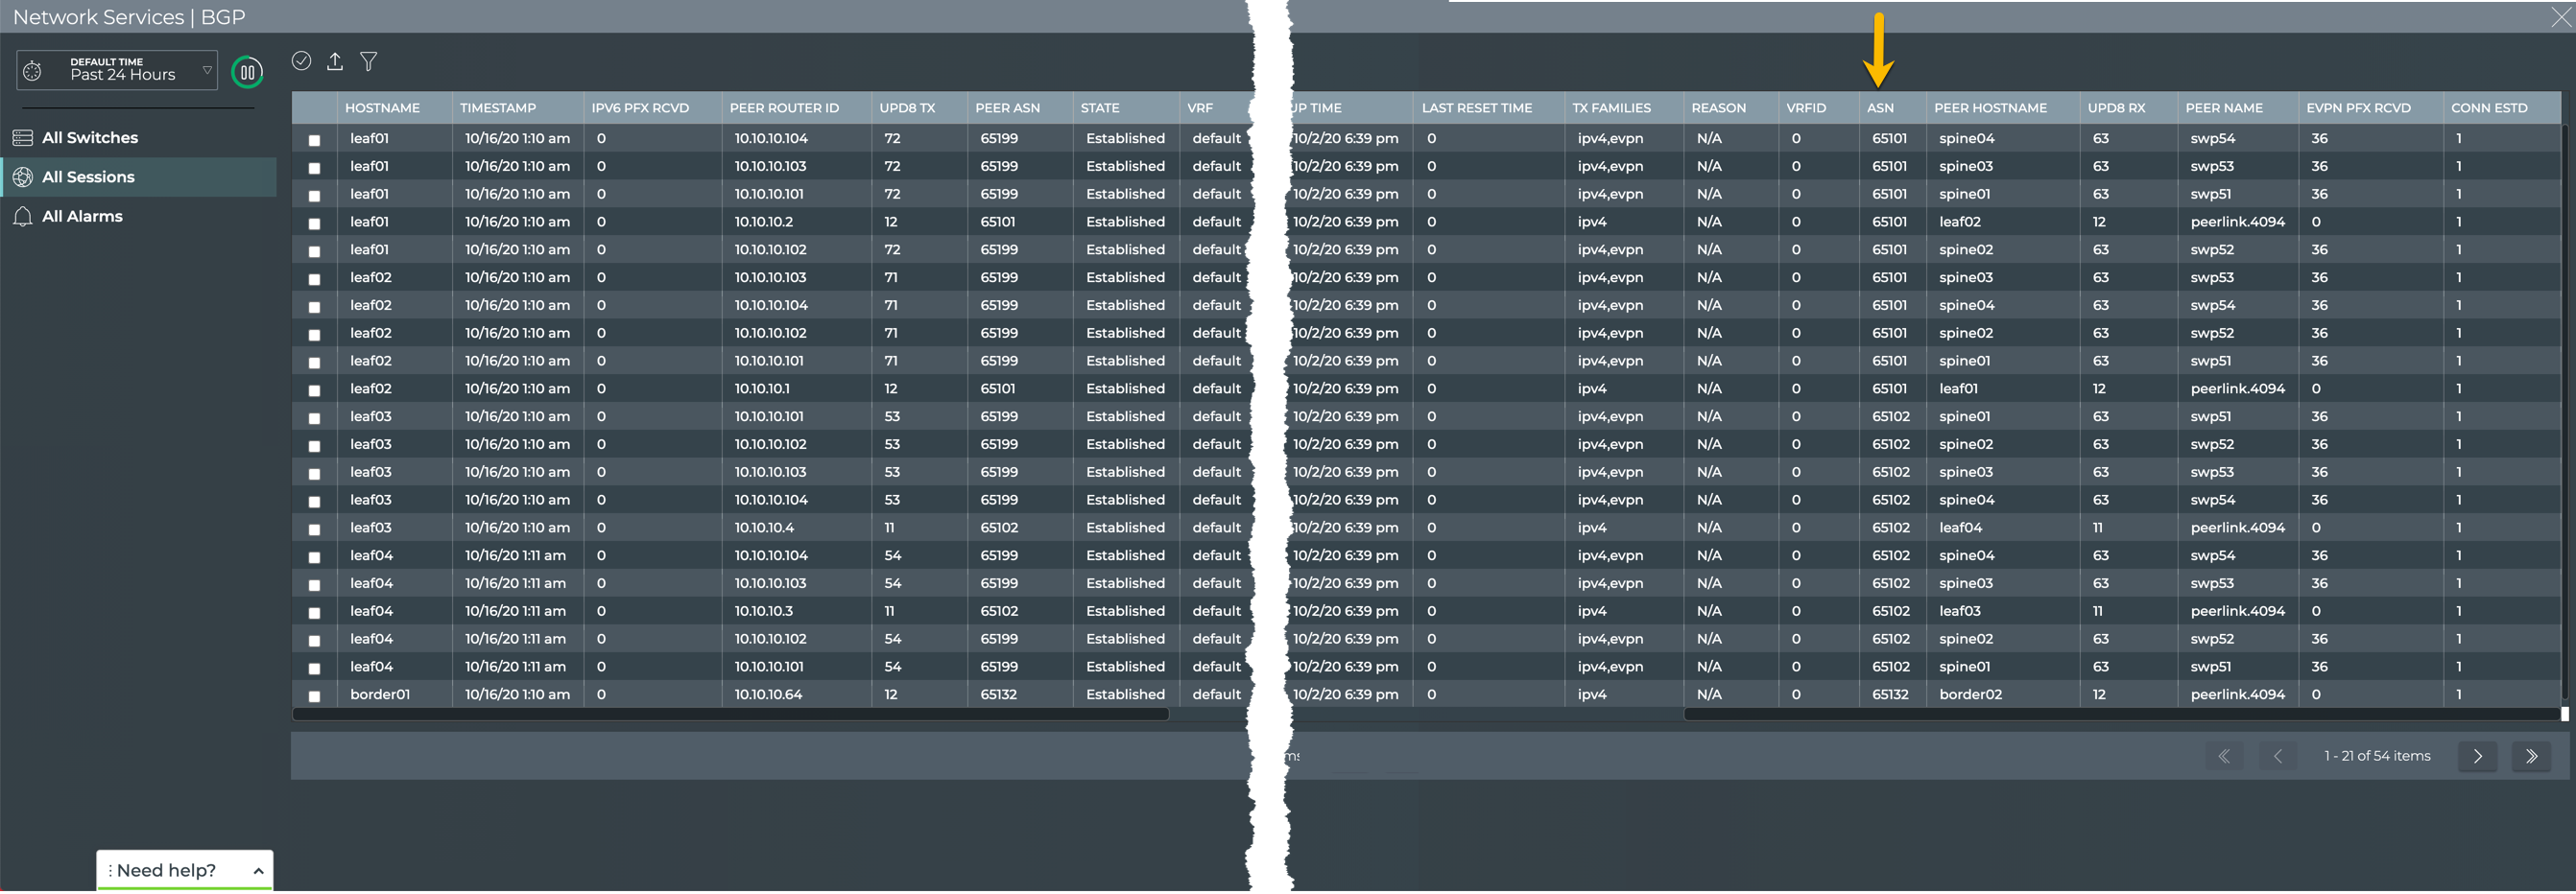
When there are numerous items in a table, NetQ loads up to 25 by default and provides the rest in additional table pages. In this case, pagination is shown under the table.
From there, you can:
View the total number of items in the list
Move forward or backward one page at a time (, )
Go to the first or last page in the list (, )
Change Order of Columns
You can rearrange the columns within a table. Click and hold on a column header, then drag it to the location where you want it.
Sort Table Data by Column
You can sort tables (with up to 10,000 rows) by a given column for tables on full-screen cards. The data is sorted in ascending or descending order; A to Z, Z to A, 1 to n, or n to 1.
To sort table data by column:
Open a full-screen card.
Hover over a column header.
Click the header to toggle between ascending and descending sort order.
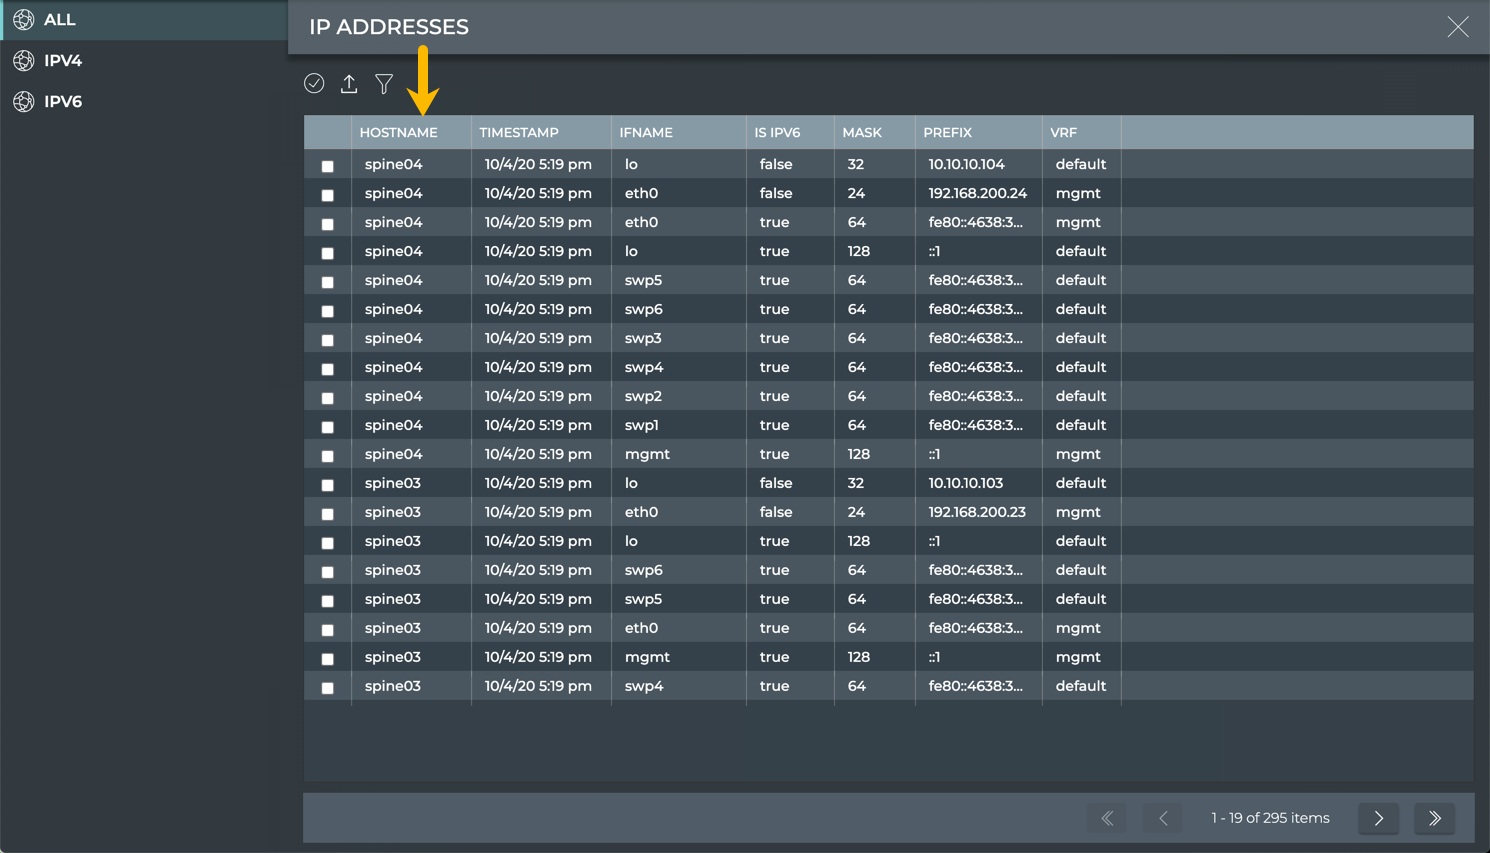
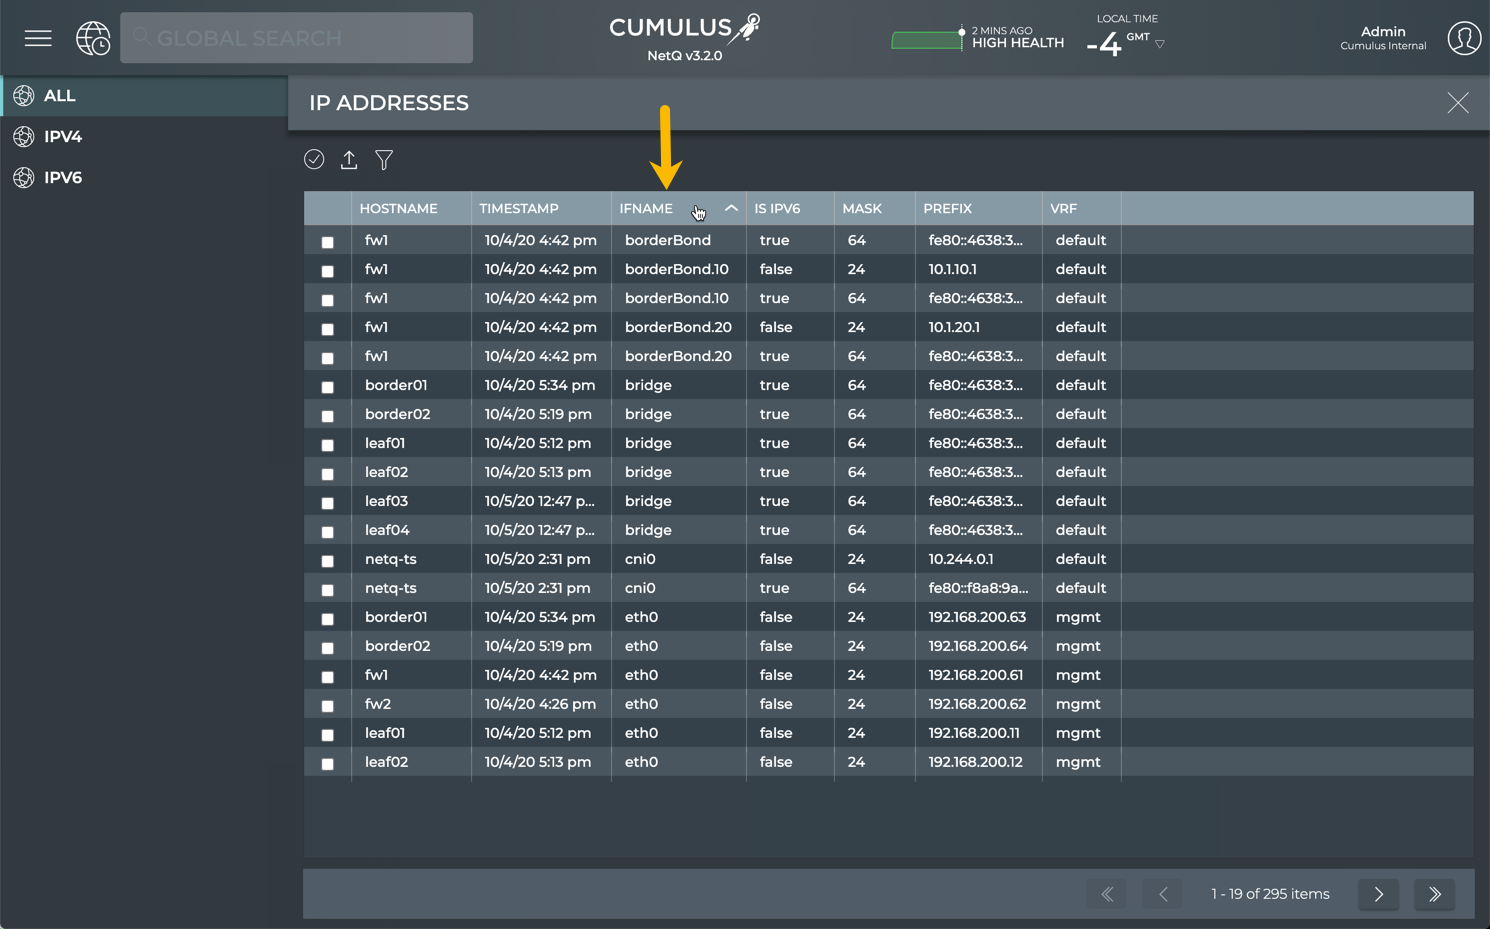
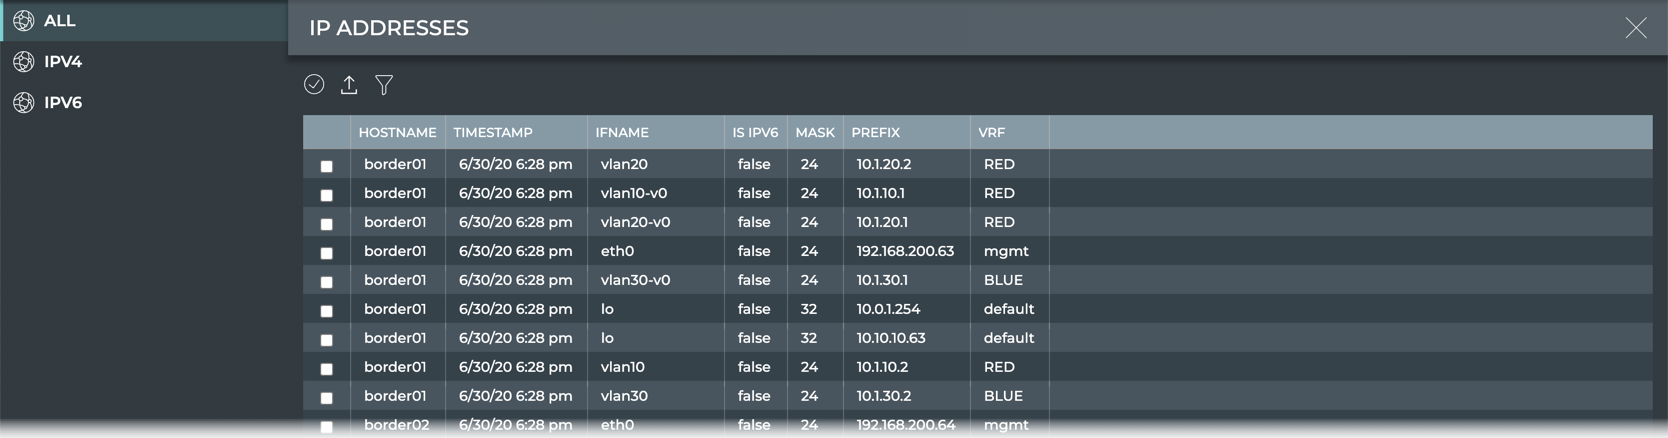
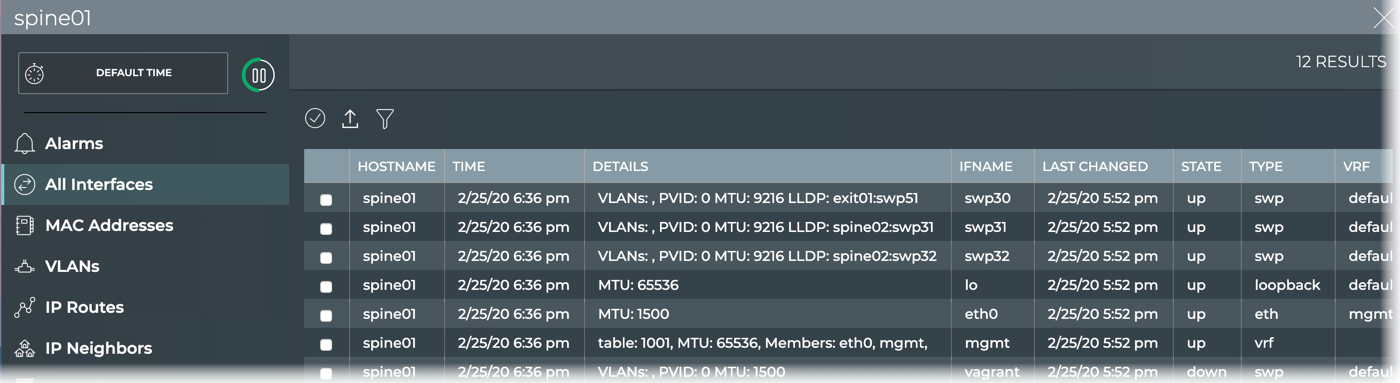
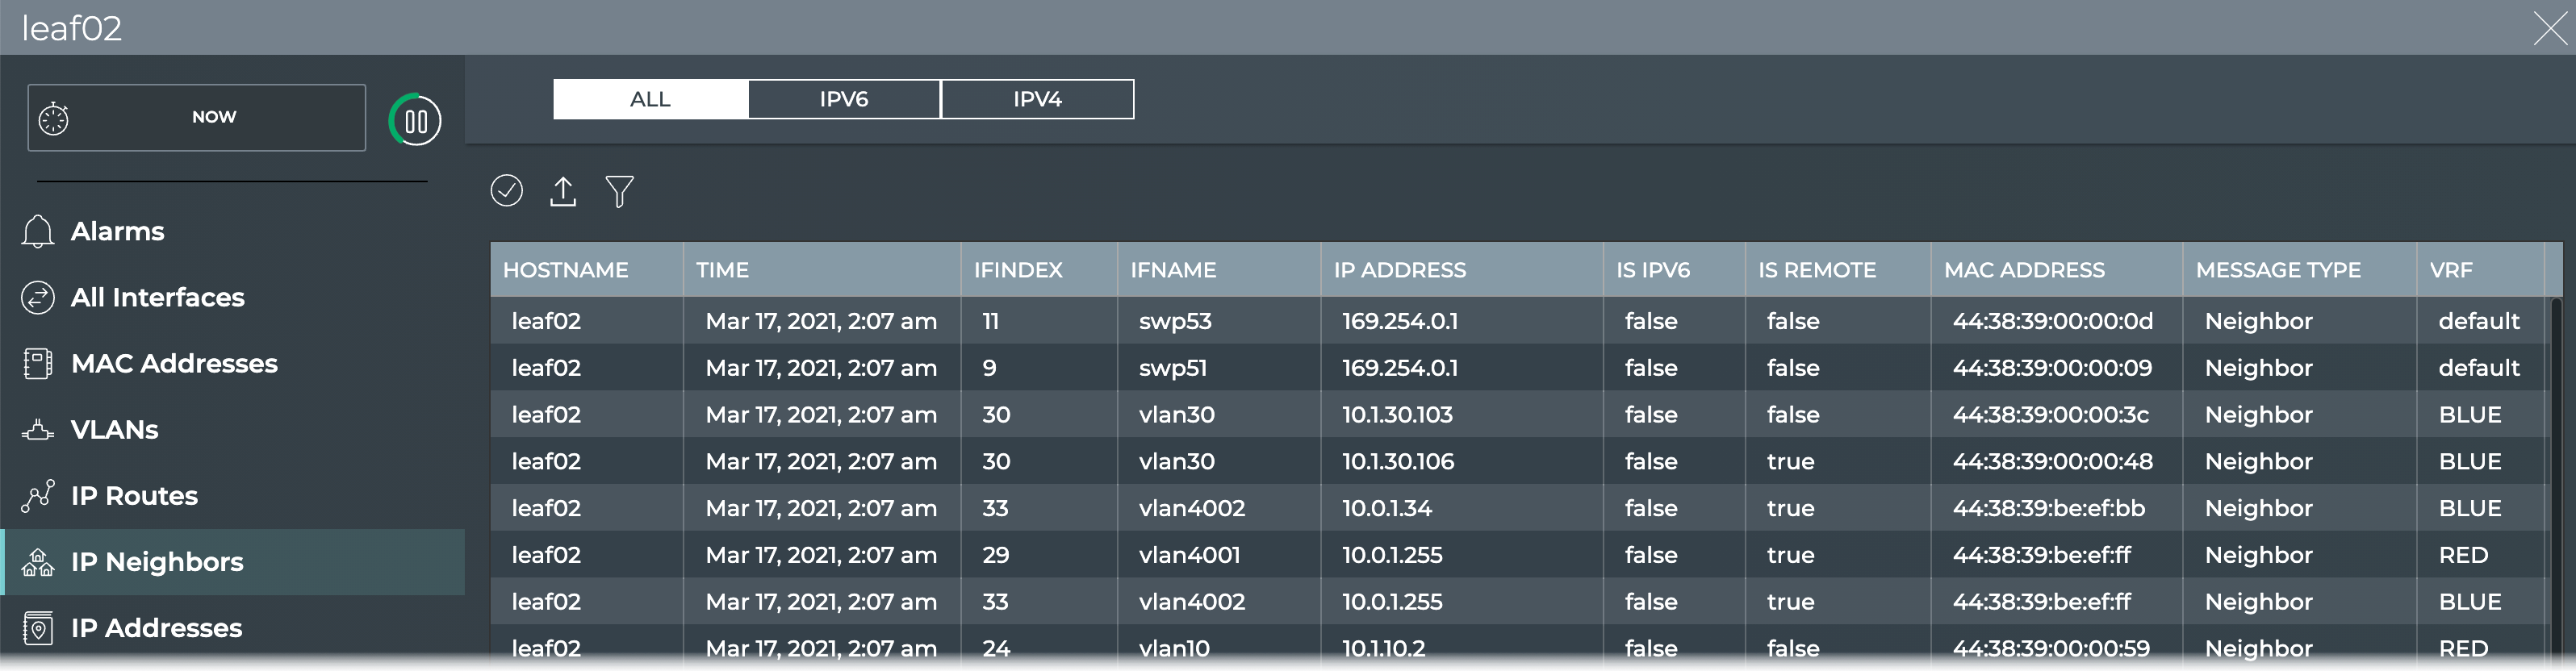
For example, this IP Addresses table is sorted by hostname in a descending order. Click the Hostname header to sort the data in ascending order. Click the IfName header to sort the same table by interface name.
Sorted by descending hostname
Sorted by ascending hostname
Sorted by descending interface name
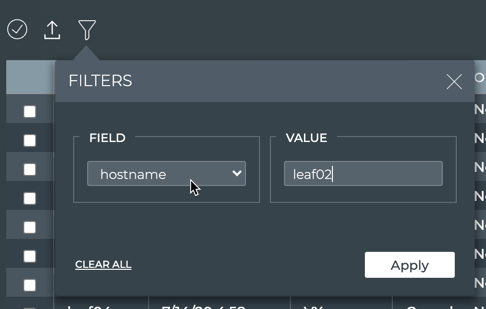
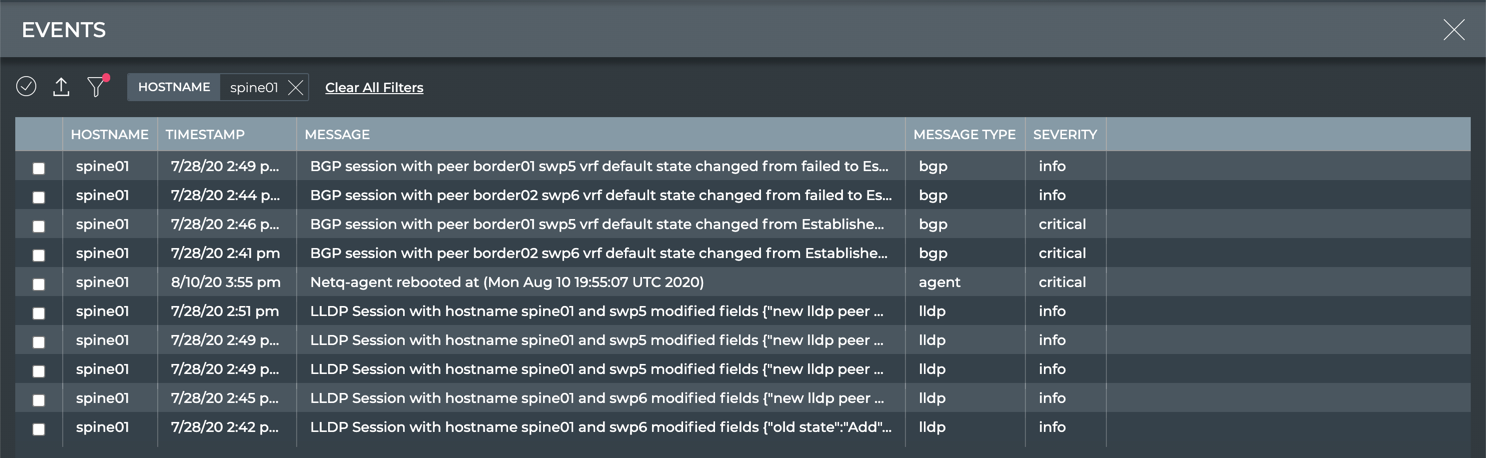
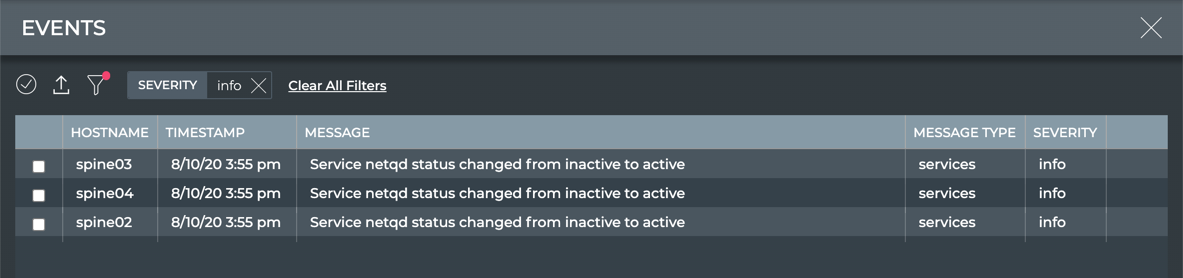
Filter Table Data
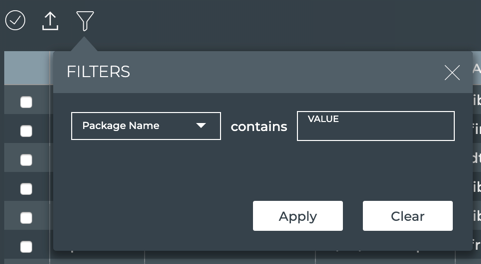
The filter option associated with tables on full-screen cards can be used to filter the data by any parameter (column name). The parameters available vary according to the table you are viewing. Some tables offer the ability to filter on more than one parameter.
Some tables only allow a single filter to be applied; you select the parameter and set the value. You can use partial values.
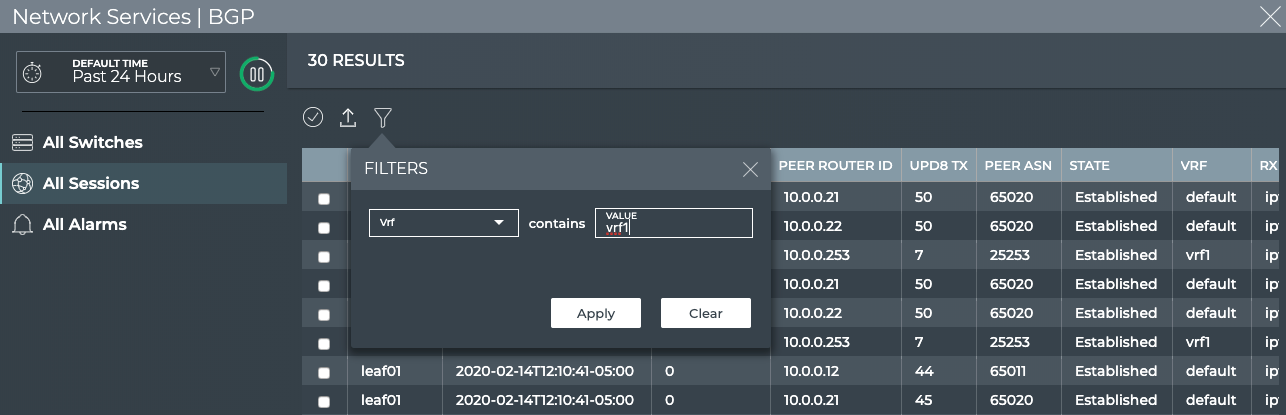
For example, to set the filter to show only BGP sessions using a particular VRF:
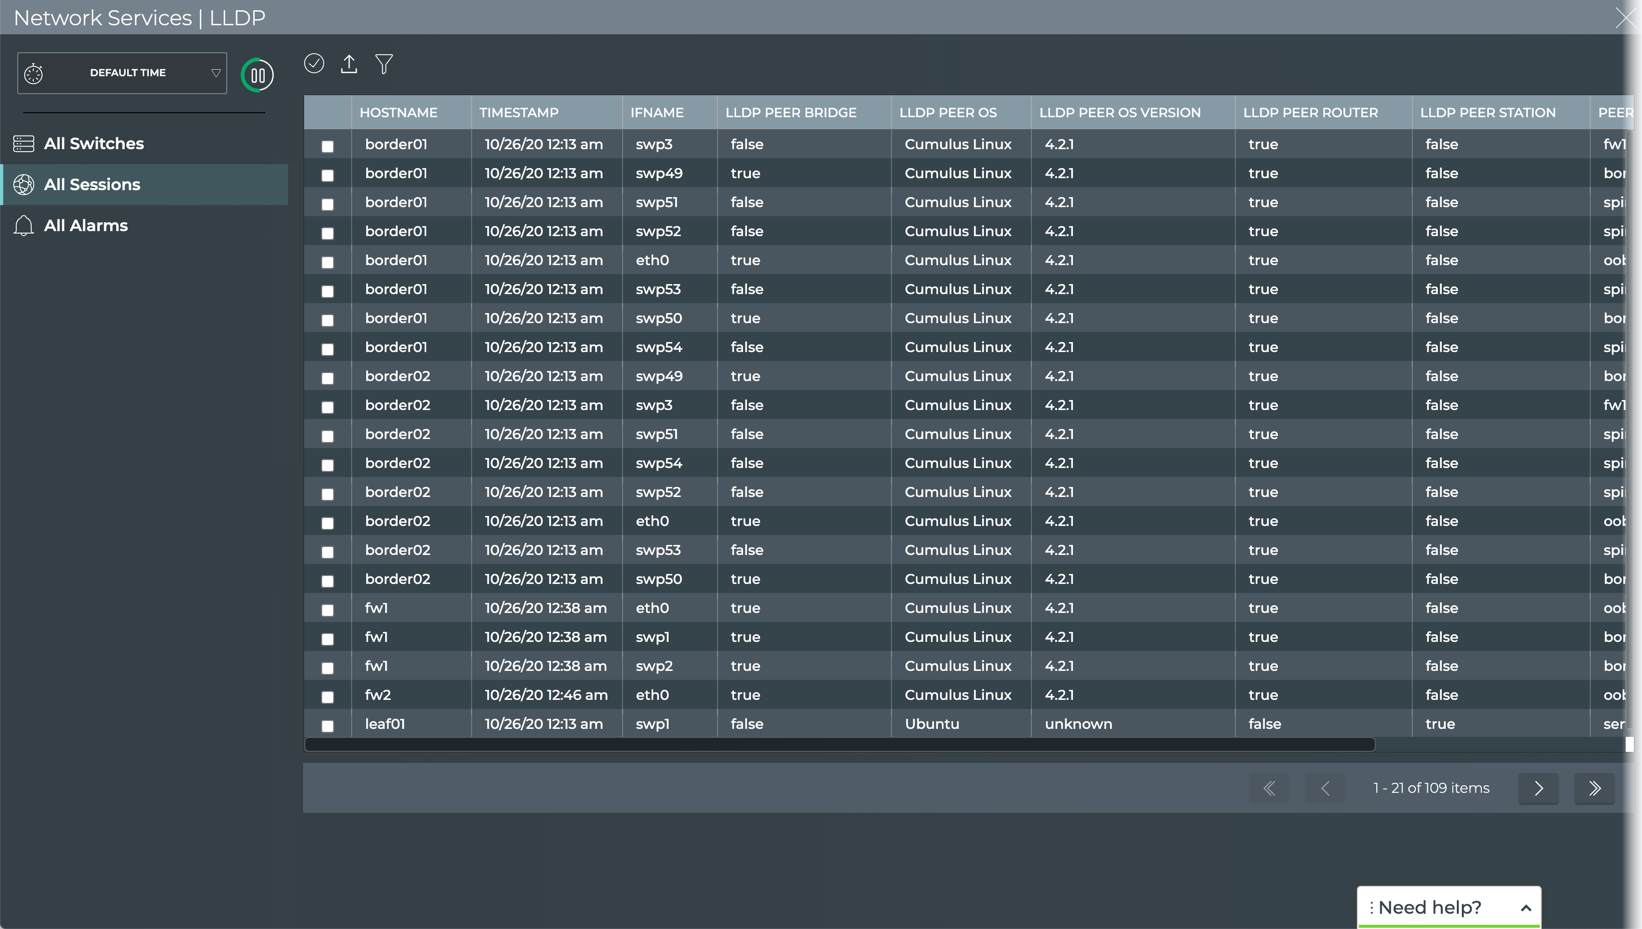
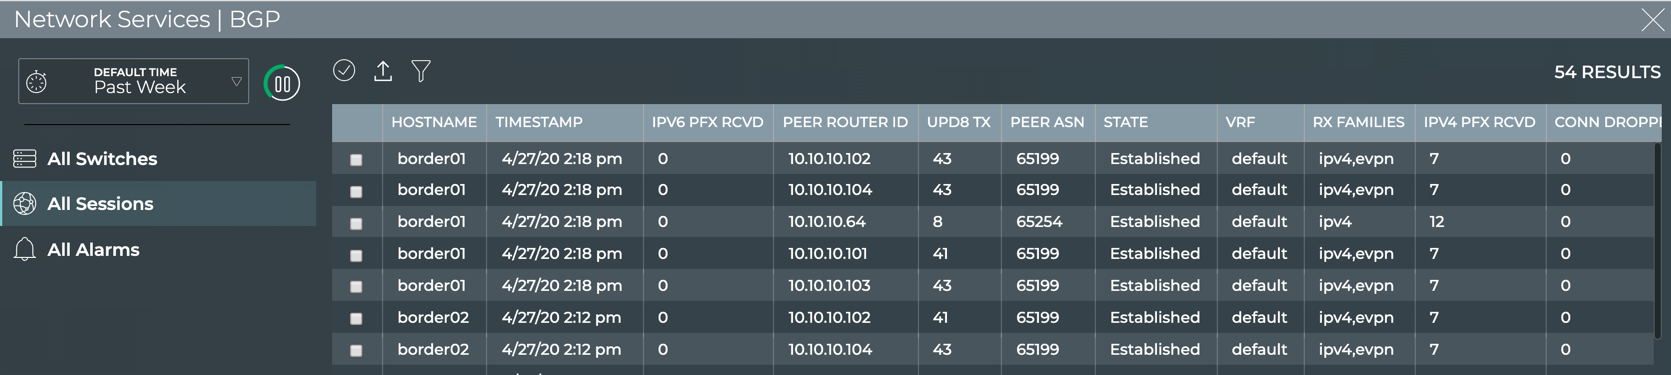
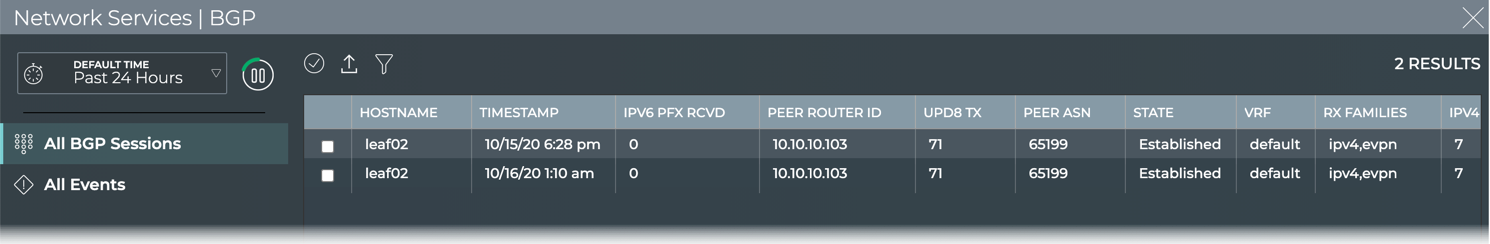
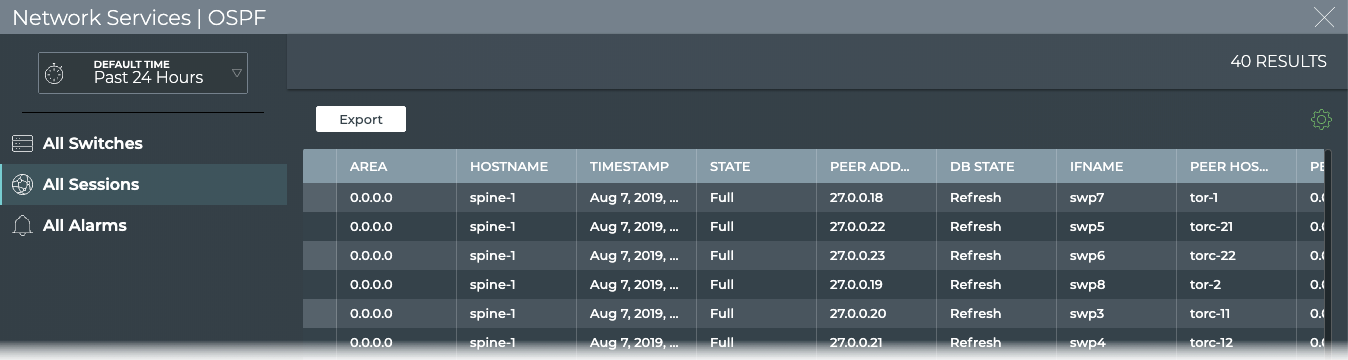
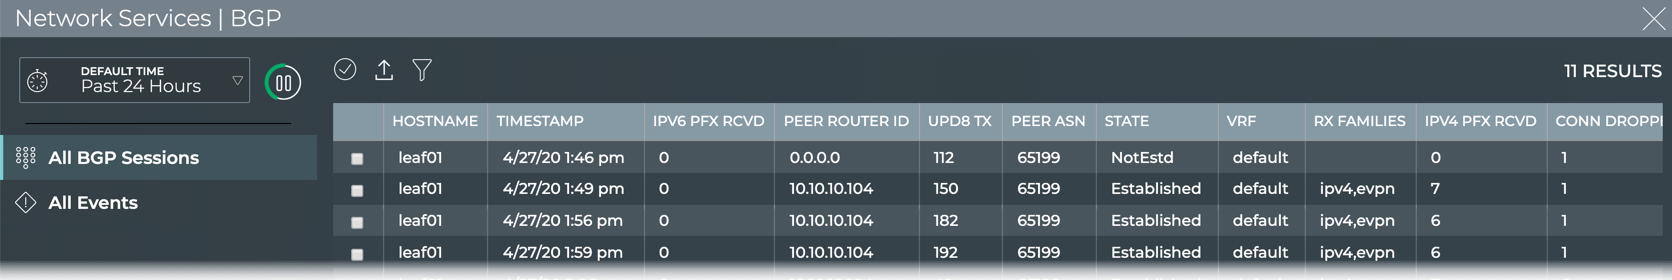
Open the full-screen Network Services | All BGP Sessions card.
Click the All Sessions tab.
Click above the table.
Select VRF from the Field dropdown.
Enter the name of the VRF of interest. In our example, we chose vrf1.
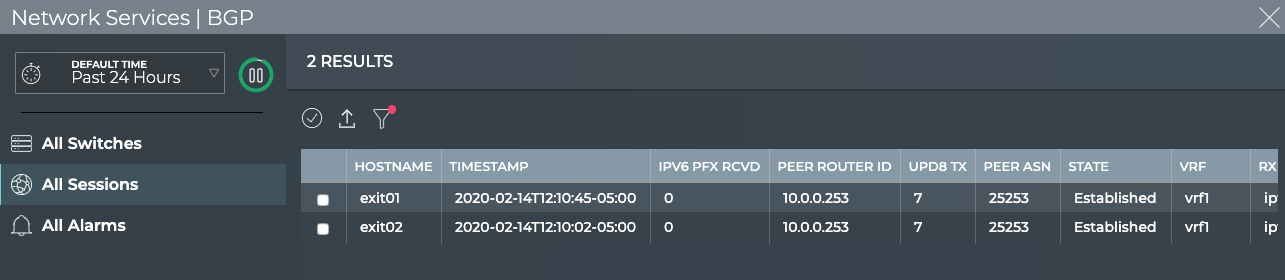
Click Apply.
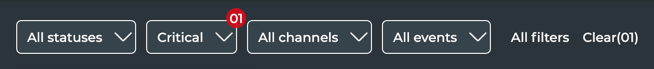
The filter icon displays a red dot to indicate filters are applied.
To remove the filter, click (with the red dot).
Click Clear.
Close the Filters dialog by clicking .
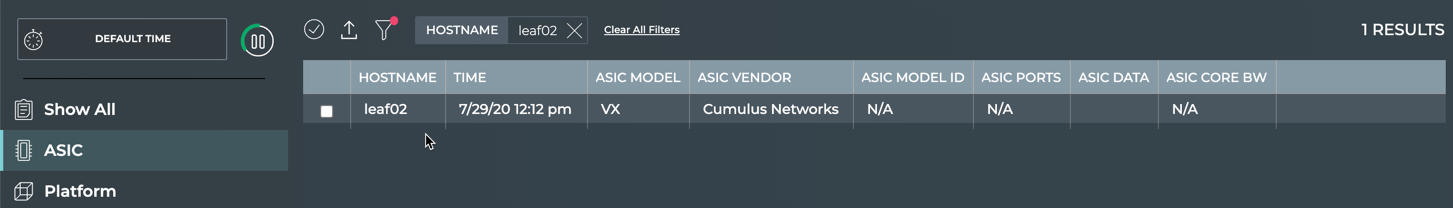
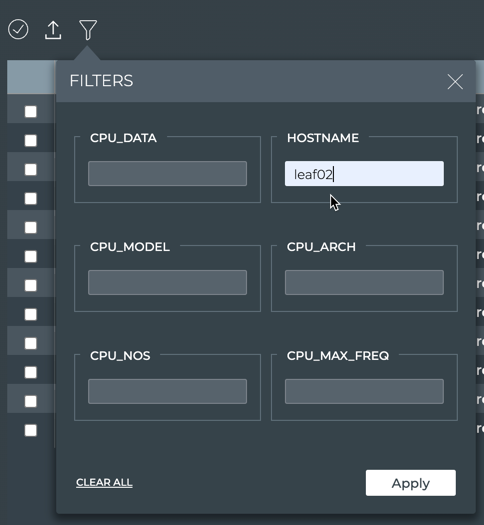
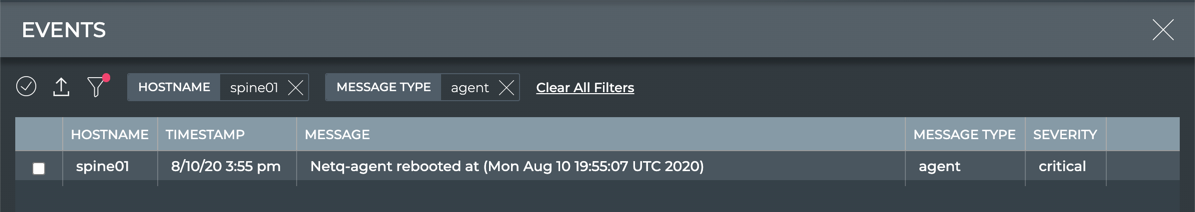
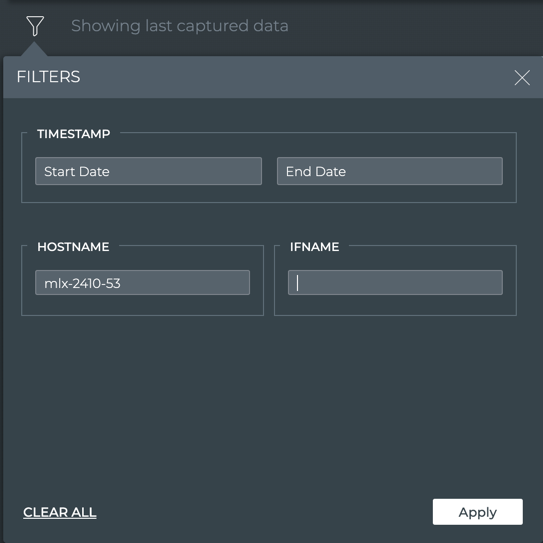
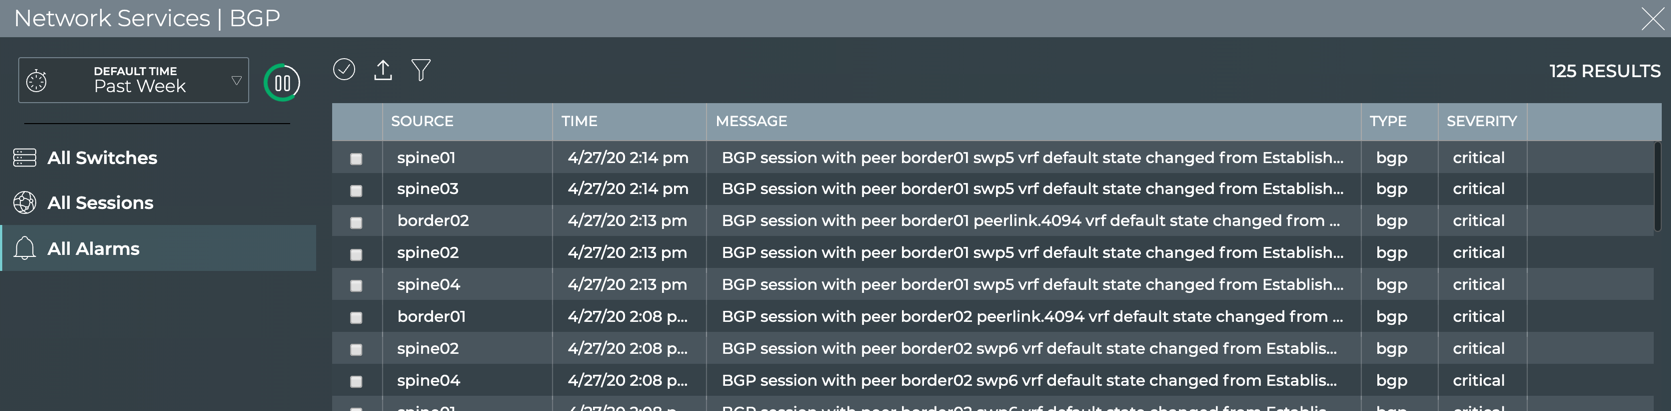
Filter Table Data with Multiple Filters
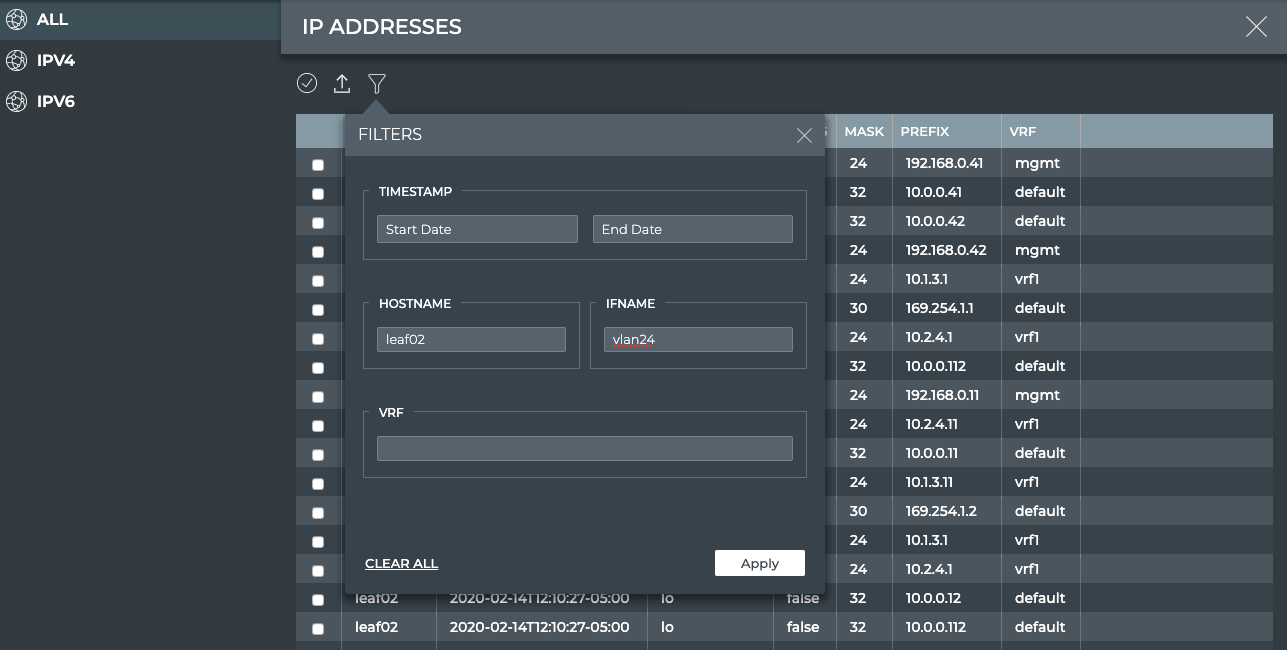
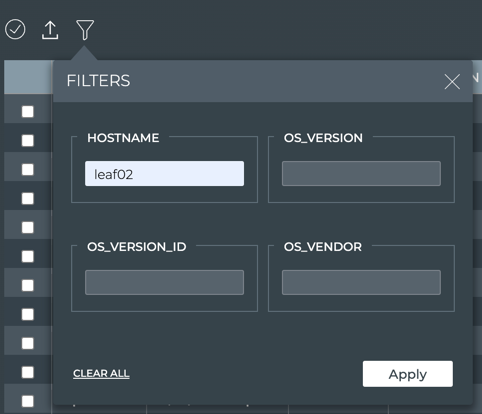
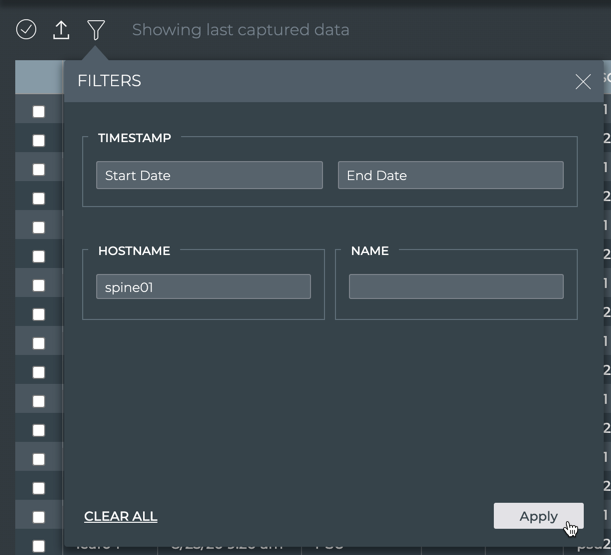
Some tables offer filtering by multiple parameters. In such cases, the Filter dialog is slightly different. For example, to filter the list of IP addresses in your system by hostname and interface:
Click .
Select IP Addresses under Network.
Click above the table.
Enter a hostname and interface name in the respective fields.
Click Apply.
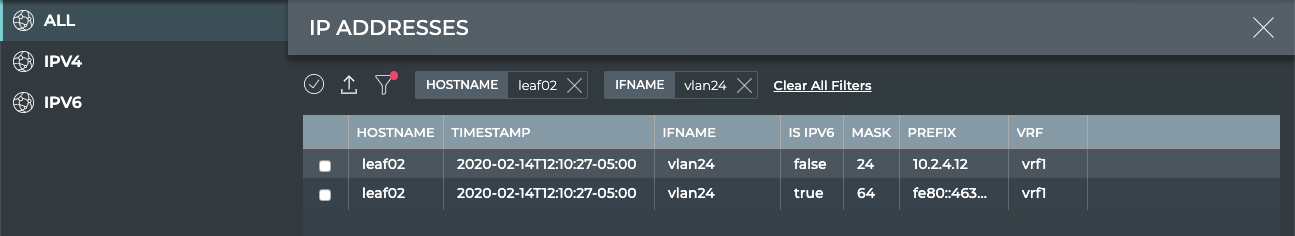
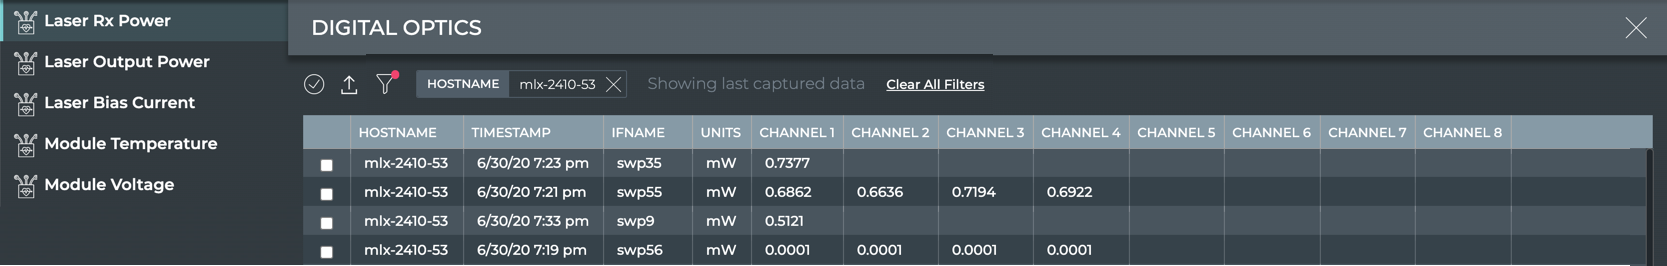
The filter icon displays a red dot to indicate filters are applied, and each filter is presented above the table.
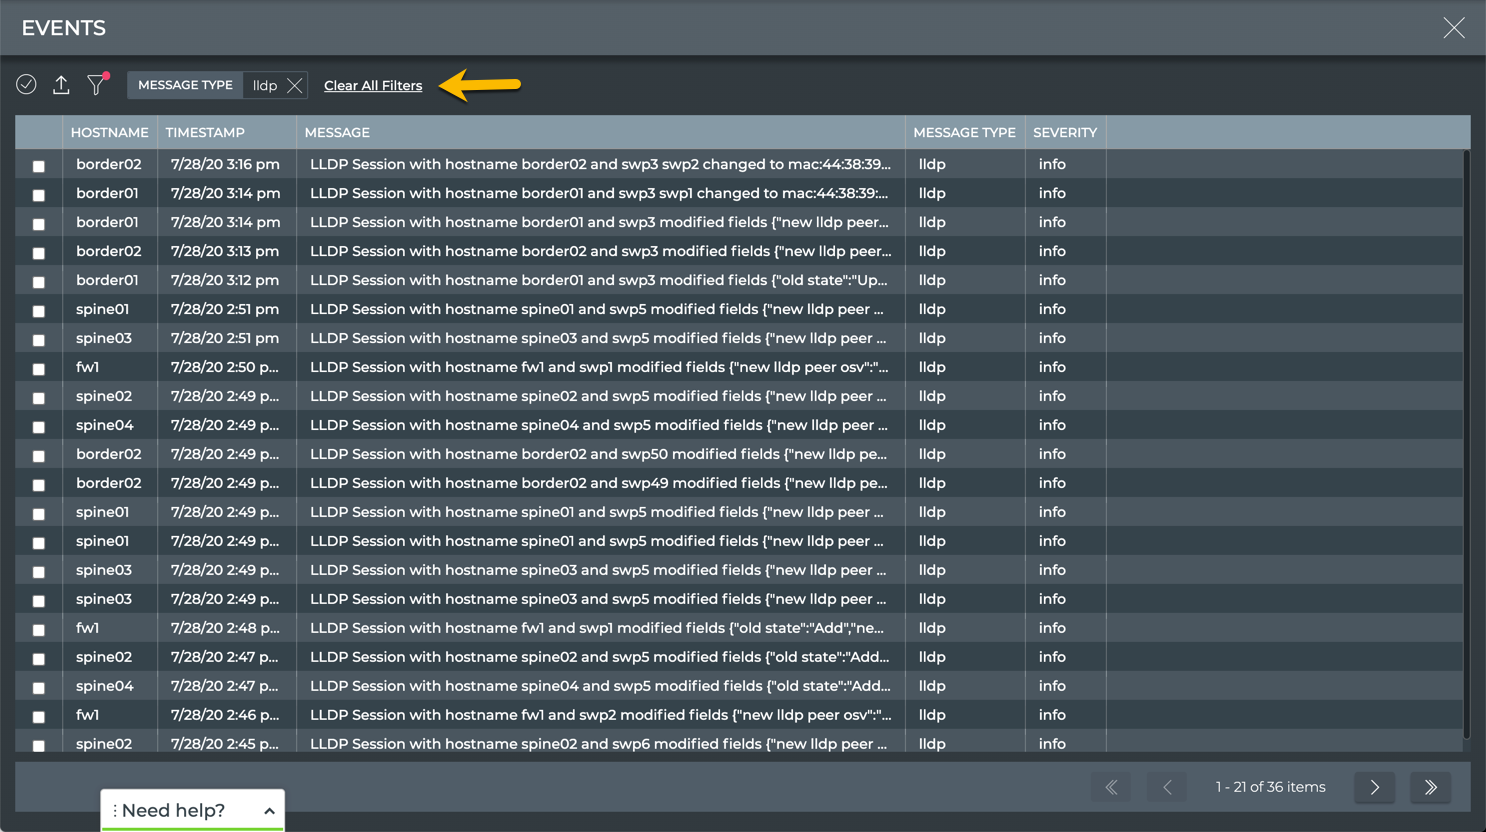
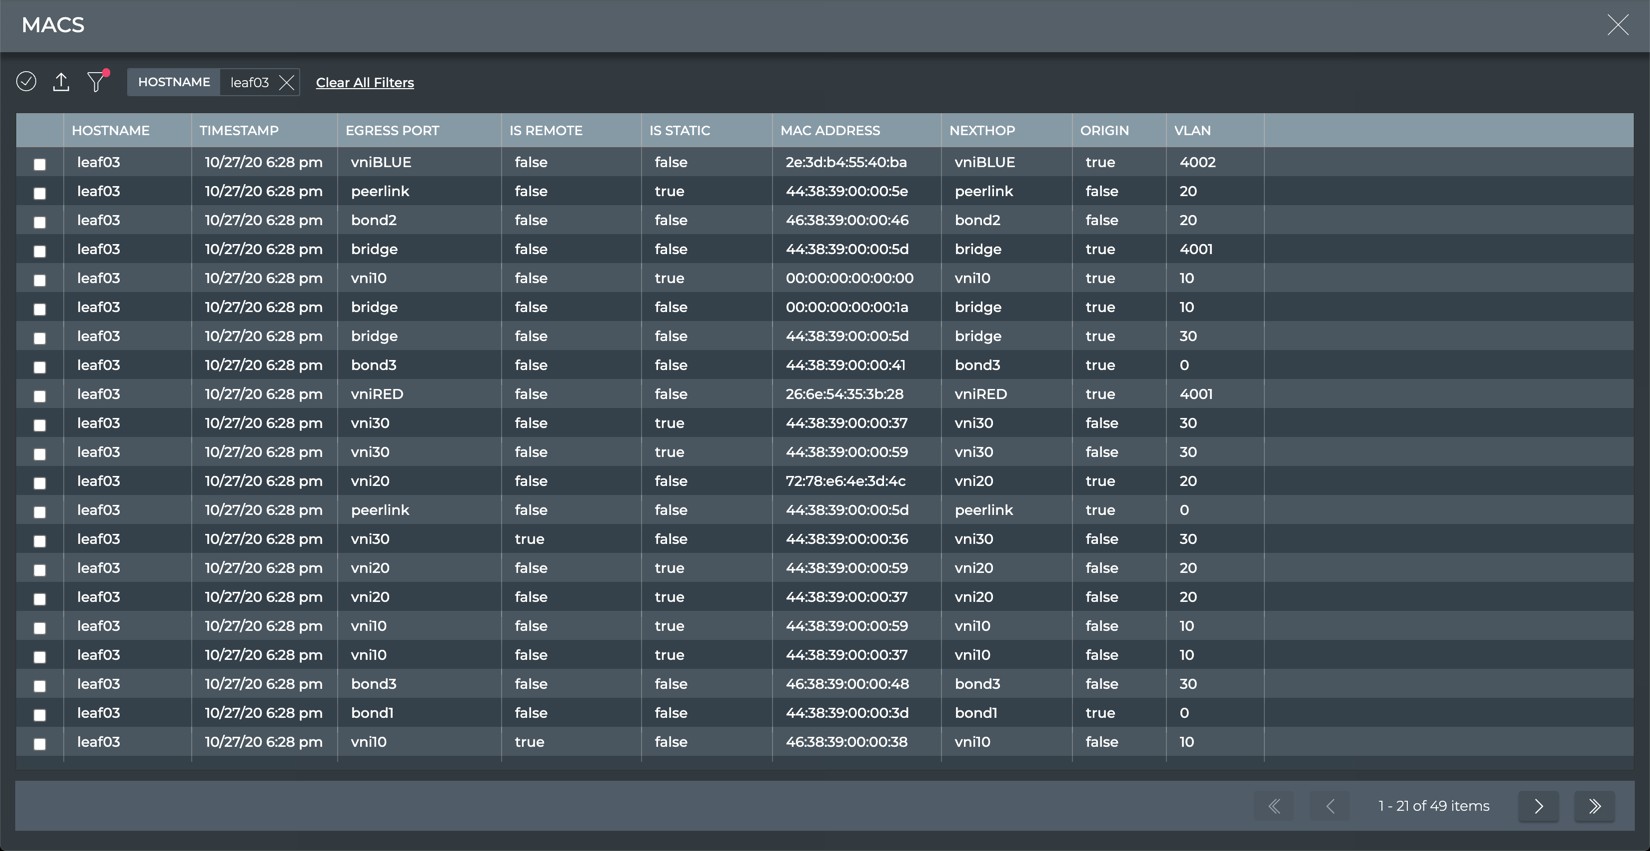
To remove a filter, simply click on the filter, or to remove all filters at once, click Clear All Filters.
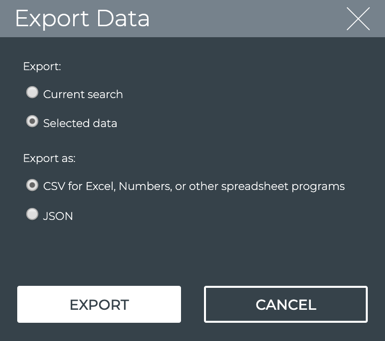
Export Data
You can export tabular data from a full-screen card to a CSV- or JSON-formatted file.
To export all data:
Click above the table.
Select the export format.
Click Export to save the file to your downloads directory.
To export selected data:
Select the individual items from the list by clicking in the checkbox next to each item.
Click above the table.
Select the export format.
Click Export to save the file to your downloads directory.
Set User Preferences
Each user can customize the NetQ application display, change his account password, and manage his workbenches.
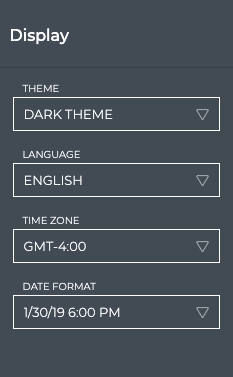
Configure Display Settings
The Display card contains the options for setting the application theme, language, time zone, and date formats. Two themes are available: a light theme and a dark theme, which is the default. The screen captures in this user guide are all displayed with the dark theme. English is the only language available for this release. You can choose to view data in the time zone where you or your data center resides. You can also select the date and time format, choosing words or number format and a 12- or 24-hour clock. All changes take effect immediately.
To configure the display settings:
Click in the application header to open the User Settings options.
Click Profile & Preferences.
Locate the Display card.
In the Theme field, click to select your choice of theme. This figure shows the light theme. Switch back and forth as desired.
In the Time Zone field, click to change the time zone from the default. By default, the time zone is set to the user’s local time zone. If a time zone has not been selected, NetQ defaults to the current local time zone where NetQ is installed. All time values are based on this setting. This is displayed in the application header, and is based on Greenwich Mean Time (GMT).
You can also change the time zone from the header display.
If your deployment is not local to you (for example, you want to view the data from the perspective of a data center in another time zone) you can change the display to another time zone. The following table presents a sample of time zones:
Time Zone
Description
Abbreviation
GMT +12
New Zealand Standard Time
NST
GMT +11
Solomon Standard Time
SST
GMT +10
Australian Eastern Time
AET
GMT +9:30
Australia Central Time
ACT
GMT +9
Japan Standard Time
JST
GMT +8
China Taiwan Time
CTT
GMT +7
Vietnam Standard Time
VST
GMT +6
Bangladesh Standard Time
BST
GMT +5:30
India Standard Time
IST
GMT+5
Pakistan Lahore Time
PLT
GMT +4
Near East Time
NET
GMT +3:30
Middle East Time
MET
GMT +3
Eastern African Time/Arab Standard Time
EAT/AST
GMT +2
Eastern European Time
EET
GMT +1
European Central Time
ECT
GMT
Greenwich Mean Time
GMT
GMT -1
Central African Time
CAT
GMT -2
Uruguay Summer Time
UYST
GMT -3
Argentina Standard/Brazil Eastern Time
AGT/BET
GMT -4
Atlantic Standard Time/Puerto Rico Time
AST/PRT
GMT -5
Eastern Standard Time
EST
GMT -6
Central Standard Time
CST
GMT -7
Mountain Standard Time
MST
GMT -8
Pacific Standard Time
PST
GMT -9
Alaskan Standard Time
AST
GMT -10
Hawaiian Standard Time
HST
GMT -11
Samoa Standard Time
SST
GMT -12
New Zealand Standard Time
NST
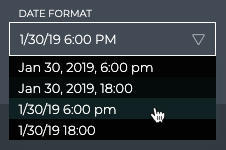
In the Date Format field, select the date and time format you want displayed on the cards.
The four options include the date displayed in words or abbreviated with numbers, and either a 12- or 24-hour time representation. The default is the third option.
Change Your Password
You can change your account password at any time should you suspect someone has hacked your account or your administrator requests you to do so.
To change your password:
Click in the application header to open the User Settings options.
Click Profile & Preferences.
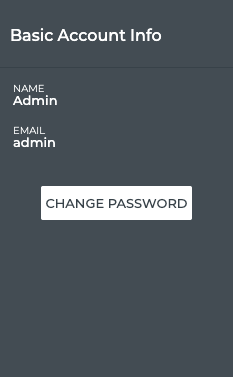
Locate the Basic Account Info card.
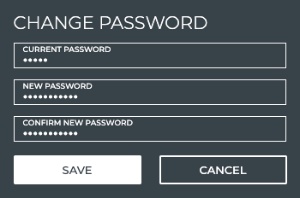
Click Change Password.
Enter your current password.
Enter and confirm a new password.
Click Save to change to the new password.
Manage Your Workbenches
You can view all of your workbenches in a list form, making it possible to manage various aspects of them. There are public and private workbenches. Public workbenches are visible by all users. Private workbenches are visible only by the user who created the workbench. From the Workbenches card, you can:
Specify a home workbench: This tells NetQ to open with that workbench when you log in instead of the default NetQ Workbench.
Search for a workbench: If you have a large number of workbenches, you can search for a particular workbench by name, or sort workbenches by their access type or cards that reside on them.
Delete a workbench: Perhaps there is one that you no longer use. You can remove workbenches that you have created (private workbenches). An administrative role is required to remove workbenches that are common to all users (public workbenches).
To manage your workbenches:
Click in the application header to open the User Settings options.
Click Profile & Preferences.
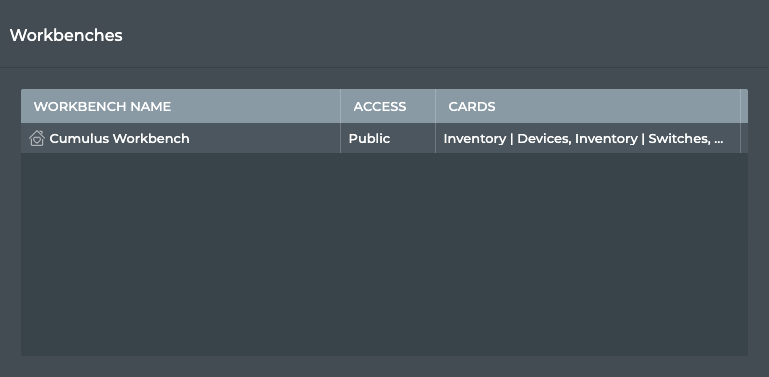
Locate the Workbenches card.
To specify a home workbench, click to the left of the desired workbench name. is placed there to indicate its status as your favorite workbench.
To search the workbench list by name, access type, and cards present on the workbench, click the relevant header and begin typing your search criteria.
To sort the workbench list, click the relevant header and click .
To delete a workbench, hover over the workbench name to view the Delete button. As an administrator, you can delete both private and public workbenches.
NetQ Command Line Overview
The NetQ CLI provides access to all network state and event information collected by the NetQ Agents. It behaves the same way most CLIs behave, with groups of commands used to display related information, the ability to use TAB completion when entering commands, and to get help for given commands and options. There are four categories of commands: check, show, config, and trace.
The NetQ command line interface only runs on switches and server hosts implemented with Intel x86 or ARM-based architectures.
CLI Access
When you install or upgrade NetQ, you can also install and enable the CLI on your NetQ server or appliance and hosts. Refer to the Install NetQ topic for details.
To access the CLI from a switch or server:
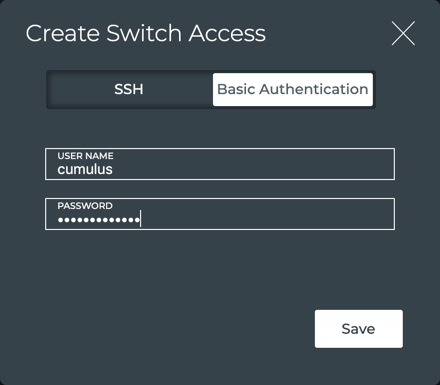
Log in to the device. This example uses the default username of cumulus and a hostname of switch.
<computer>:~<username>$ ssh cumulus@switch
Enter your password to reach the command prompt. The default password is CumulusLinux! For example:
Enter passphrase for key '/Users/<username>/.ssh/id_rsa': <enter CumulusLinux! here>
Welcome to Ubuntu 16.04.3 LTS (GNU/Linux 4.4.0-112-generic x86_64)
    * Documentation:  https://help.ubuntu.com
    * Management:     https://landscape.canonical.com
    * Support:        https://ubuntu.com/advantage
Last login: Tue Sep 15 09:28:12 2019 from 10.0.0.14
cumulus@switch:~$
Run commands. For example:
cumulus@switch:~$ netq show agents
cumulus@switch:~$ netq check bgp
Command Line Basics
This section describes the core structure and behavior of the NetQ CLI. It includes the following:
The NetQ command line has a flat structure as opposed to a modal structure. Thus, you can run all commands from the standard command prompt instead of only in a specific mode, at the same level.
Command Syntax
NetQ CLI commands all begin with netq. NetQ commands fall into one of four syntax categories: validation (check), monitoring (show), configuration, and trace.
netq check <network-protocol-or-service> [options]
netq show <network-protocol-or-service> [options]
netq config <action> <object> [options]
netq trace <destination> from <source> [options]
Symbols
Meaning
Parentheses ( )
Grouping of required parameters. Choose one.
Square brackets [ ]
Single or group of optional parameters. If more than one object or keyword is available, choose one.
Angle brackets < >
Required variable. Value for a keyword or option; enter according to your deployment nomenclature.
Pipe |
Separates object and keyword options, also separates value options; enter one object or keyword and zero or one value.
For example, in the netq check command:
[<hostname>] is an optional parameter with a variable value named hostname
<network-protocol-or-service> represents a number of possible key words, such as agents, bgp, evpn, and so forth
<options> represents a number of possible conditions for the given object, such as around, vrf, or json
Thus some valid commands are:
netq leaf02 check agents json
netq show bgp
netq config restart cli
netq trace 10.0.0.5 from 10.0.0.35
Command Output
The command output presents results in color for many commands. Results with errors appear in red, and warnings appear in yellow. Results without errors or warnings appear in either black or green. VTEPs appear in blue. A node in the pretty output appears in bold, and angle brackets (< >) wrap around a router interface. To view the output with only black text, run the netq config del color command. You can view output with colors again by running netq config add color.
All check and show commands have a default timeframe of now to one hour ago, unless you specify an approximate time using the around keyword or a range using the between keyword. For example, running netq check bgp shows the status of BGP over the last hour. Running netq show bgp around 3h shows the status of BGP three hours ago.
Command Prompts
NetQ code examples use the following prompts:
cumulus@switch:~$ Indicates the user cumulus is logged in to a switch to run the example command
cumulus@host:~$ Indicates the user cumulus is logged in to a host to run the example command
cumulus@netq-appliance:~$ Indicates the user cumulus is logged in to either the NetQ Appliance or NetQ Cloud Appliance to run the command
cumulus@hostname:~$ Indicates the user cumulus is logged in to a switch, host or appliance to run the example command
To use the NetQ CLI, the switches must be running the Cumulus Linux or SONiC operating system (OS), NetQ Platform or NetQ Collector software, the NetQ Agent, and the NetQ CLI. The hosts must be running CentOS, RHEL, or Ubuntu OS, the NetQ Agent, and the NetQ CLI. Refer to the Install NetQ topic for details.
Command Completion
As you enter commands, you can get help with the valid keywords or options using the Tab key. For example, using Tab completion with netq check displays the possible objects for the command, and returns you to the command prompt to complete the command.
cumulus@switch:~$ netq check <<press Tab>>
    agents      :  Netq agent
    bgp         :  BGP info
    cl-version  :  Cumulus Linux version
    clag        :  Cumulus Multi-chassis LAG
    evpn        :  EVPN
    interfaces  :  network interface port
    mlag        :  Multi-chassis LAG (alias of clag)
    mtu         :  Link MTU
    ntp         :  NTP
    ospf        :  OSPF info
    sensors     :  Temperature/Fan/PSU sensors
    vlan        :  VLAN
    vxlan       :  VXLAN data path
cumulus@switch:~$ netq check
Command Help
As you enter commands, you can get help with command syntax by entering help at various points within a command entry. For example, to find out what options are available for a BGP check, enter help after entering some of the netq check command. In this example, you can see that there are no additional required parameters and you can use three optional parameters — hostnames, vrf and around — with a BGP check.
The CLI stores commands issued within a session, which enables you to review and rerun commands that you already ran. At the command prompt, press the Up Arrow and Down Arrow keys to move back and forth through the list of commands previously entered. When you have found a given command, you can run the command by pressing Enter, just as you would if you had entered it manually. Optionally you can modify the command before you run it.
Command Categories
While the CLI has a flat structure, the commands can be conceptually grouped into these functional categories:
The netqcheck commands enable the network administrator to validate the current or historical state of the network by looking for errors and misconfigurations in the network. The commands run fabric-wide validations against various configured protocols and services to determine how well the network is operating. You can perform validation checks for the following:
agents: NetQ Agents operation on all switches and hosts
bgp: BGP (Border Gateway Protocol) operation across the network
fabric
clag: Cumulus Linux MLAG (multi-chassis LAG/link aggregation) operation
mtu: Link MTU (maximum transmission unit) consistency across paths
ntp: NTP (Network Time Protocol) operation
ospf: OSPF (Open Shortest Path First) operation
sensors: Temperature/Fan/PSU sensor operation
vlan: VLAN (Virtual Local Area Network) operation
vxlan: VXLAN (Virtual Extensible LAN) data path operation
The commands take the form of netq check <network-protocol-or-service> [options], where the options vary according to the protocol or service.
This example shows the output for the netq check bgp command, followed by the same command using the json option. If there were any failures, they would appear below the summary results or in the failedNodes section, respectively.
cumulus@switch:~$ netq check bgp
bgp check result summary:

Checked nodes       : 8
Total nodes         : 8
Rotten nodes        : 0
Failed nodes        : 0
Warning nodes       : 0

Additional summary:
Total Sessions      : 30
Failed Sessions     : 0

Session Establishment Test   : passed
Address Families Test        : passed
Router ID Test               : passed
The netq show commands enable the network administrator to view details about the current or historical configuration and status of the various protocols or services. You can view the configuration and status for the following:
address-history: Address history info for a IP address / prefix
agents: NetQ Agents status on switches and hosts
bgp: BGP status across the network fabric
cl-btrfs-info: BTRFS file system data for monitored Cumulus Linux switches
cl-manifest: Information about the versions of Cumulus Linux available on monitored switches
cl-pkg-info: Information about software packages installed on monitored switches
cl-resource: ACL and forwarding information
cl-ssd-util: SSD utilization information
clag: CLAG/MLAG status
dom: Digital Optical Monitoring
ethtool-stats: Interface statistics
events: Display changes over time
events-config: Events configured for suppression
evpn: EVPN status
interface-stats: Interface statistics
interface-utilization: Interface statistics plus utilization
interfaces: network interface port status
inventory: hardware component information
ip: IPv4 status
ipv6: IPv6 status
job-status: status of upgrade jobs running on the appliance or VM
kubernetes: Kubernetes cluster, daemon, pod, node, service and replication status
lldp: LLDP status
mac-commentary: MAC commentary info for a MAC address
mac-history: Historical information for a MAC address
macs: MAC table or address information
mlag: MLAG status (an alias for CLAG)
neighbor-history: Neighbor history info for an IP address
notification: Send notifications to Slack or PagerDuty
ntp: NTP status
opta-health: Display health of apps on the OPTA
opta-platform: NetQ Appliance version information and uptime
ospf: OSPF status
recommended-pkg-version: Current host information to be considered
resource-util: Display usage of memory, CPU and disk resources
roce-config: Display RoCE configuration
roce-counters: Displays RDMA over Converged Ethernet counters for a given switch
sensors: Temperature/Fan/PSU sensor status
services: System services status
tca: Threshold crossing alerts
trace: Control plane trace path across fabric
unit-tests: Show list of unit tests for netq check
validation: Schedule a validation check
vlan: VLAN status
vxlan: VXLAN data path status
wjh-drop: dropped packet data from NVIDIA® Mellanox® What Just Happened®
The commands take the form of netq [<hostname>] show <network-protocol-or-service> [options], where the options vary according to the protocol or service. You can restrict the commands from showing the information for all devices to showing information only for a selected device using the hostname option.
The following examples show the standard and filtered output for the netq show agents command.
cumulus@switch:~$ netq leaf01 show agents
Matching agents records:
Hostname          Status           NTP Sync Version                              Sys Uptime                Agent Uptime              Reinitialize Time          Last Changed
----------------- ---------------- -------- ------------------------------------ ------------------------- ------------------------- -------------------------- -------------------------
leaf01            Fresh            yes      3.2.0-cl4u30~1601410518.104fb9ed     Mon Sep 21 16:49:04 2020  Tue Sep 29 21:24:49 2020  Tue Sep 29 21:24:49 2020   Thu Oct  1 16:26:33 2020
Configuration Commands
Various commands, including netq config, netq notification, and netq install enable the network administrator to manage NetQ Agent and CLI server configuration, configure lifecycle management, set up container monitoring, and manage notifications.
NetQ Agent Configuration
The agent commands enable the network administrator to configure individual NetQ Agents. Refer to NetQ Components for a description of NetQ Agents, to Manage NetQ Agents, or to Install NetQ Agents for more detailed usage examples.
The agent configuration commands enable you to add and remove agents from switches and hosts, start and stop agent operations, debug the agent, specify default commands, and enable or disable a variety of monitoring features (including Kubernetes, sensors, FRR (FRRouting), CPU usage limit, and What Just Happened).
Commands apply to one agent at a time; you run them from the switch or host where the NetQ Agent resides.
This example shows how to view the NetQ Agent configuration:
cumulus@switch:~$ netq config show agent
netq-agent             value      default
---------------------  ---------  ---------
enable-opta-discovery  True       True
exhibitport
agenturl
server                 127.0.0.1  127.0.0.1
exhibiturl
vrf                    default    default
agentport              8981       8981
port                   31980      31980
After making configuration changes to your agents, you must restart the agent for the changes to take effect. Use the netq config restart agent command.
CLI Configuration
The netq config cli commands enable the network administrator to configure and manage the CLI component. These commands enable you to add or remove CLI (essentially enabling/disabling the service), start and restart it, and view the configuration of the service.
Commands apply to one device at a time, and you run them from the switch or host where you run the CLI.
The CLI configuration commands include:
netq config add cli server
netq config del cli server
netq config show cli premises [json]
netq config show (cli|all) [json]
netq config (status|restart) cli
netq config select cli premise
This example shows how to restart the CLI instance:
cumulus@switch~:$ netq config restart cli
This example shows how to enable the CLI on a NetQ On-premises appliance or virtual machine (VM):
cumulus@switch~:$ netq config add cli server 10.1.3.101
This example shows how to enable the CLI on a NetQ Cloud Appliance or VM for the Chicago premises and the default port:
netq config add cli server api.netq.cumulusnetworks.com access-key <user-access-key> secret-key <user-secret-key> premises chicago port 443
NetQ System Configuration Commands
You use the following commands to manage the NetQ system itself:
bootstrap: Loads the installation program onto the network switches and hosts in either a single server or server cluster arrangement.
decommission: Decommissions a switch or host.
install: Installs NetQ in standalone or cluster deployments; also used to install patch software.
upgrade bundle: Upgrades NetQ on NetQ On-premises Appliances or VMs.
This example shows how to bootstrap a single server or master server in a server cluster:
For information and examples on installing and upgrading the NetQ system, see Install NetQ and Upgrade NetQ.
Event Notification Commands
The notification configuration commands enable you to add, remove and show notification application integrations. These commands create the channels, filters, and rules needed to control event messaging. The commands include:
NetQ supports TCA events, a set of events that are triggered by crossing a user-defined threshold. You configure and manage TCA events using the following commands:
The netq lcm (lifecycle management) commands enable you to manage the deployment of NVIDIA product software onto your network devices (servers, appliances, and switches) in the most efficient way and with the most information about the process as possible. The LCM commands provide for:
Managing network OS and NetQ images in a local repository
Configuring switch access credentials for installations and upgrades
Managing switch inventory and roles
Upgrade NetQ (Agents and CLI) on switches with NetQ Agents
Install or upgrade NetQ Agents and CLI on switches with or without NetQ Agents all in a single job
Upgrade the network OS on switches with NetQ Agents
View a result history of upgrade attempts
This example shows the NetQ configuration profiles:
cumulus@switch:~$ netq lcm show netq-config
ID                        Name            Default Profile                VRF             WJH       CPU Limit Log Level Last Changed
------------------------- --------------- ------------------------------ --------------- --------- --------- --------- -------------------------
config_profile_3289efda36 NetQ default co Yes                            mgmt            Disable   Disable   info      Tue Apr 27 22:42:05 2021
db4065d56f91ebbd34a523b45 nfig
944fbfd10c5d75f9134d42023
eb2b
This example shows how to add a Cumulus Linux installation image to the NetQ repository on the switch:
The trace commands enable the network administrator to view the available paths between two nodes on the network currently and at a time in the past. You can perform a layer 2 or layer 3 trace, and view the output in one of three formats (json, pretty, and detail). JSON output provides the output in a JSON file format for ease of importing to other applications or software. Pretty output lines up the paths in a pseudo-graphical manner to help visualize multiple paths. Detail output is useful for traces with higher hop counts where the pretty output wraps lines, making it harder to interpret the results. The detail output displays a table with a row for each path.
The audience for managing deployments is network administrators who are responsible for installation, setup, and maintenance of NetQ in their data center or campus environment. NetQ offers the ability to monitor and manage your network infrastructure and operational health with simple tools based on open source Linux. This topic provides instructions and information about installing, backing up, and upgrading NetQ. It also contains instructions for integrating with an LDAP server and Grafana.
Before you begin, you should review the release notes for this version.
Install NetQ
The NetQ software contains several components that you must install, including the NetQ applications, the database, and the NetQ Agents. You can deploy NetQ in one of two ways:
Hosted on premises: Use this deployment model when you want to host a single NetQ site and have it be entirely contained on your premises. In this implementation, all NetQ components including the NetQ Platform software, hardware, and database are located on your premises. The NetQ applications and database are installed as a single entity, called the NetQ Platform, and are run on the NetQ On-premises Appliance or NetQ On-premises virtual machine (VM). Note that you are responsible for installing, configuring and maintaining all NetQ components. This deployment model is called the on-premises solution in this documentation. It is suitable for organizations with data residency requirements like GDPR (general data protection regulation).
Hosted remotely: Use this deployment model when you want to either set up multiple NetQ premises or use the NetQ Cloud service. In this implementation the NetQ aggregation and forwarding application software, called the NetQ Collector, is installed and run on the NetQ Cloud Appliance or NetQ Cloud VM on premises with a common database and all other applications installed in a single NetQ site or in the NetQ Cloud. In the multi-site implementation, you are responsible for all software, hardware, and the database. In the cloud service implementation, you are responsible for the on-premises NetQ Collector and NVIDIA is responsible for the data storage in the NetQ Cloud. This deployment model is called the remote solution in this documentation.
With either deployment model, the NetQ Agents reside on the switches and hosts they monitor in your network.
NetQ Data Flow
For the on-premises solution, the NetQ Agents collect and transmit data from the switches and hosts back to the NetQ On-premises Appliance or virtual machine running the NetQ Platform software, which in turn processes and stores the data in its database. This data is then provided for display through several user interfaces.
For the remote solution, multi-site NetQ implementation, the NetQ Agents at each premises collect and transmit data from the switches and hosts at that premises to its NetQ Cloud Appliance or virtual machine running the NetQ Collector software. The NetQ Collectors then transmit this data to the common NetQ Cloud Appliance or virtual machine and database at one of your premises for processing and storage.
For the remote solution, cloud service implementation, the NetQ Agents collect and transmit data from the switches and hosts to the NetQ Cloud Appliance or virtual machine running the NetQ Collector software. The NetQ Collector then transmits this data to the NVIDIA cloud-based infrastructure for further processing and storage.
For either remote solution, telemetry data is then provided for display through the same user interfaces as the on-premises solution. When using the cloud service implementation of the remote solution, the browser interface can be pointed to the local NetQ Cloud Appliance or VM, or directly to netq.cumulusnetworks.com.
Installation Choices
You must make several choices to determine what steps you need to perform to install the NetQ system:
You must determine whether you intend to deploy the solution fully on your premises or if you intend to deploy the remote solution.
You must decide whether you are going to deploy a virtual machine on your own hardware or use one of the NetQ appliances.
You must determine whether you want to install the software on a single server or as a server cluster.
If you have an existing on-premises solution and want to save your existing NetQ data, you must back up that data before installing the new software.
The documentation walks you through these choices and then provides the instructions specific to your selections.
Cluster Deployments
Deploying the NetQ servers in a cluster arrangement has many benefits even though it’s a more complex configuration. The primary benefits of having multiple servers that run the software and store the data are reduced potential downtime and increased availability.
The default clustering implementation has three servers: 1 master and 2 workers. However, NetQ supports up to 10 worker nodes in a cluster. When you configure the cluster, configure the NetQ Agents to connect to these three nodes in the cluster first by providing the IP addresses as a comma-separated list. If you later add more nodes to the cluster, you do not need to configure these nodes again.
The Agents connect to the server using gRPC.
Cluster Deployments and Kubernetes
NetQ also monitors Kubernetes containers. If the master node ever goes down, all NetQ services should continue to work. However, keep in mind that the master hosts the Kubernetes control plane so anything that requires connectivity with the Kubernetes cluster — such as upgrading NetQ or rescheduling pods to other workers if a worker goes down — will not work.
Cluster Deployments and Load Balancers
You need a load balancer for high availability for the NetQ API and the NetQ UI.
However, you need to be mindful of where you install the certificates for the admin UI (port 8443) and the NetQ UI (port 443); otherwise, you cannot access the NetQ UI.
If you are using a load balancer in your deployment, we recommend you install the certificates directly on the load balancer for SSL offloading. However, if you install the certificates on the master node, then configure the load balancer to allow for SSL passthrough.
Installation Workflow Summary
No matter which choices you made above, the installation workflow can be summarized as follows:
Prepare the physical server or virtual machine.
Install the software (NetQ Platform or NetQ Collector).
Install and configure the NetQ Agents on switches and hosts.
Install and configure the NetQ CLI on switches and hosts (optional, but useful).
This topic walks you through the NetQ System installation decisions and then provides installation steps based on those choices. If you are already comfortable with your installation choices, you can use the matrix in Install NetQ Quick Start to go directly to the installation steps.
To install NetQ 4.1, you must first decide whether you want to install the NetQ System in an on-premises or remote deployment. Both deployment options provide secure access to data and features useful for monitoring and troubleshooting your network, and each has its benefits.
It is common to select an on-premises deployment model if you want to host all required hardware and software at your location, and you have the in-house skill set to install, configure, and maintain it — including performing data backups, acquiring and maintaining hardware and software, and integration management. This model is also a good choice if you want very limited or no access to the Internet from switches and hosts in your network or you have data residency requirements like GDPR. Some companies only want complete control of the their network, and no outside impact.
If, however, you find that you want to host a multi-site on-premises deployment or use the NetQ Cloud service, you should select the remote deployment model. In the multi-site deployment, you host multiple small servers at each site and a large server and database at another site. In the cloud service deployment, you host only a small local server on your premises that connects to the NetQ Cloud service over selected ports or through a proxy server. The cloud service supports only data aggregation and forwarding locally, and the majority of the NetQ applications use a hosted deployment strategy, storing data in the cloud. NVIDIA handles the backups and maintenance of the application and storage. This remote cloud service model is often chosen when it is untenable to support deployment in-house or if you need the flexibility to scale quickly, while also reducing capital expenses.
Click the deployment model you want to use to continue with installation:
On-premises deployments of NetQ can use a single server or a server cluster. In either case, you can use either the NVIDIA Cumulus NetQ Appliance or your own server running a KVM or VMware virtual machine (VM). This topic walks you through the installation for each of these on-premises options.
The next installation step is to decide whether you are deploying a single server or a server cluster. Both options provide the same services and features. The biggest difference is in the number of servers you deploy and in the continued availability of services running on those servers should hardware failures occur.
A single server is easier to set up, configure and manage, but can limit your ability to scale your network monitoring quickly. Multiple servers is a bit more complicated, but you limit potential downtime and increase availability by having more than one server that can run the software and store the data.
Select the standalone single-server arrangements for smaller, simpler deployments. Be sure to consider the capabilities and resources needed on this server to support the size of your final deployment.
Select the server cluster arrangement to obtain scalability and high availability for your network. You can configure one master node and up to nine worker nodes.
Click the server arrangement you want to use to begin installation:
The next installation consideration is whether you want to deploy a single server or a server cluster cloud deployment. Both options provide the same services and features. The biggest difference is in the number of servers you intend to deploy and in the continued availability of services running on those servers should hardware failures occur.
A single server is easier to set up, configure and manage, but can limit your ability to scale your network monitoring quickly. Multiple servers is a bit more complicated, but you limit potential downtime and increase availability by having more than one server that can run the software and store the data.
Click the server arrangement you want to use to continue with installation:
Set Up Your VMware Virtual Machine for a Single On-premises Server
Follow these steps to setup and configure your VM on a single server in an on-premises deployment:
Verify that your system meets the VM requirements.
Resource
Minimum Requirements
Processor
Eight (8) virtual CPUs
Memory
64 GB RAM
Local disk storage
256 GB SSD with minimum disk IOPS of 1000 for a standard 4kb block size (Note: This must be an SSD; use of other storage options can lead to system instability and are not supported.)
Network interface speed
1 Gb NIC
Hypervisor
VMware ESXi™ 6.5 or later (OVA image) for servers running Cumulus Linux, CentOS, Ubuntu, and RedHat operating systems
Confirm that the needed ports are open for communications.
You must open the following ports on your NetQ on-premises server:
Open your hypervisor and set up your VM. You can use this example for reference or use your own hypervisor instructions.
VMware Example Configuration
This example shows the VM setup process using an OVA file with VMware ESXi.
Enter the address of the hardware in your browser.
Log in to VMware using credentials with root access.
Click Storage in the Navigator to verify you have an SSD installed.
Click Create/Register VM at the top of the right pane.
Select Deploy a virtual machine from an OVF or OVA file, and click Next.
Provide a name for the VM, for example NetQ.
Tip: Make note of the name used during install as this is needed in a later step.
Drag and drop the NetQ Platform image file you downloaded in Step 2 above.
Click Next.
Select the storage type and data store for the image to use, then click Next. In this example, only one is available.
Accept the default deployment options or modify them according to your network needs. Click Next when you are finished.
Review the configuration summary. Click Back to change any of the settings, or click Finish to continue with the creation of the VM.
The progress of the request is shown in the Recent Tasks window at the bottom of the application. This may take some time, so continue with your other work until the upload finishes.
Once completed, view the full details of the VM and hardware.
Log in to the VM and change the password.
Use the default credentials to log in the first time:
Username: cumulus
Password: cumulus
$ ssh cumulus@<ipaddr>
Warning: Permanently added '<ipaddr>' (ECDSA) to the list of known hosts.
Ubuntu 20.04 LTS
cumulus@<ipaddr>'s password:
You are required to change your password immediately (root enforced)
System information as of Thu Dec  3 21:35:42 UTC 2020
System load:  0.09              Processes:           120
Usage of /:   8.1% of 61.86GB   Users logged in:     0
Memory usage: 5%                IP address for eth0: <ipaddr>
Swap usage:   0%
WARNING: Your password has expired.
You must change your password now and login again!
Changing password for cumulus.
(current) UNIX password: cumulus
Enter new UNIX password:
Retype new UNIX password:
passwd: password updated successfully
Connection to <ipaddr> closed.
Log in again with your new password.
$ ssh cumulus@<ipaddr>
Warning: Permanently added '<ipaddr>' (ECDSA) to the list of known hosts.
Ubuntu 20.04 LTS
cumulus@<ipaddr>'s password:
  System information as of Thu Dec  3 21:35:59 UTC 2020
  System load:  0.07              Processes:           121
  Usage of /:   8.1% of 61.86GB   Users logged in:     0
  Memory usage: 5%                IP address for eth0: <ipaddr>
  Swap usage:   0%
Last login: Thu Dec  3 21:35:43 2020 from <local-ipaddr>
cumulus@ubuntu:~$
Verify the platform is ready for installation. Fix any errors indicated before installing the NetQ software.
cumulus@hostname:~$ sudo opta-check
Change the hostname for the VM from the default value.
The default hostname for the NetQ Virtual Machines is ubuntu. Change the hostname to fit your naming conventions while meeting Internet and Kubernetes naming standards.
Kubernetes requires that hostnames are composed of a sequence of labels concatenated with dots. For example, “en.wikipedia.org” is a hostname. Each label must be from 1 to 63 characters long. The entire hostname, including the delimiting dots, has a maximum of 253 ASCII characters.
The Internet standards (RFCs) for protocols specify that labels may contain only the ASCII letters a through z (in lower case), the digits 0 through 9, and the hyphen-minus character ('-').
Re-run the Bootstrap CLI. This example uses interface eth0. Replace this with your updated IP address, hostname or interface using the interface or ip-addr option.
Consider the following for container environments, and make adjustments as needed.
Flannel Virtual Networks
If you are using Flannel with a container environment on your network, you may need to change its default IP address ranges if they conflict with other addresses on your network. This can only be done one time during the first installation.
The address range is 10.244.0.0/16. NetQ overrides the original Flannel default, which is 10.1.0.0/16.
To change the default address range, use the CLI with the pod-ip-range option. For example:
Open your hypervisor and set up your VM. You can use this example for reference or use your own hypervisor instructions.
VMware Example Configuration
This example shows the VM setup process using an OVA file with VMware ESXi.
Enter the address of the hardware in your browser.
Log in to VMware using credentials with root access.
Click Storage in the Navigator to verify you have an SSD installed.
Click Create/Register VM at the top of the right pane.
Select Deploy a virtual machine from an OVF or OVA file, and click Next.
Provide a name for the VM, for example NetQ.
Tip: Make note of the name used during install as this is needed in a later step.
Drag and drop the NetQ Platform image file you downloaded in Step 2 above.
Click Next.
Select the storage type and data store for the image to use, then click Next. In this example, only one is available.
Accept the default deployment options or modify them according to your network needs. Click Next when you are finished.
Review the configuration summary. Click Back to change any of the settings, or click Finish to continue with the creation of the VM.
The progress of the request is shown in the Recent Tasks window at the bottom of the application. This may take some time, so continue with your other work until the upload finishes.
Once completed, view the full details of the VM and hardware.
Log in to the VM and change the password.
Use the default credentials to log in the first time:
Username: cumulus
Password: cumulus
$ ssh cumulus@<ipaddr>
Warning: Permanently added '<ipaddr>' (ECDSA) to the list of known hosts.
Ubuntu 20.04 LTS
cumulus@<ipaddr>'s password:
You are required to change your password immediately (root enforced)
System information as of Thu Dec  3 21:35:42 UTC 2020
System load:  0.09              Processes:           120
Usage of /:   8.1% of 61.86GB   Users logged in:     0
Memory usage: 5%                IP address for eth0: <ipaddr>
Swap usage:   0%
WARNING: Your password has expired.
You must change your password now and login again!
Changing password for cumulus.
(current) UNIX password: cumulus
Enter new UNIX password:
Retype new UNIX password:
passwd: password updated successfully
Connection to <ipaddr> closed.
Log in again with your new password.
$ ssh cumulus@<ipaddr>
Warning: Permanently added '<ipaddr>' (ECDSA) to the list of known hosts.
Ubuntu 20.04 LTS
cumulus@<ipaddr>'s password:
  System information as of Thu Dec  3 21:35:59 UTC 2020
  System load:  0.07              Processes:           121
  Usage of /:   8.1% of 61.86GB   Users logged in:     0
  Memory usage: 5%                IP address for eth0: <ipaddr>
  Swap usage:   0%
Last login: Thu Dec  3 21:35:43 2020 from <local-ipaddr>
cumulus@ubuntu:~$
Verify the platform is ready for installation. Fix any errors indicated before installing the NetQ software.
cumulus@hostname:~$ sudo opta-check-cloud
Change the hostname for the VM from the default value.
The default hostname for the NetQ Virtual Machines is ubuntu. Change the hostname to fit your naming conventions while meeting Internet and Kubernetes naming standards.
Kubernetes requires that hostnames are composed of a sequence of labels concatenated with dots. For example, “en.wikipedia.org” is a hostname. Each label must be from 1 to 63 characters long. The entire hostname, including the delimiting dots, has a maximum of 253 ASCII characters.
The Internet standards (RFCs) for protocols specify that labels may contain only the ASCII letters a through z (in lower case), the digits 0 through 9, and the hyphen-minus character ('-').
Allow about five to ten minutes for this to complete, and only then continue to the next step.
If this step fails for any reason, you can run netq bootstrap reset and then try again.
If you have changed the IP address or hostname of the NetQ Cloud VM after this step, you need to re-register this address with NetQ as follows:
Reset the VM.
cumulus@hostname:~$ netq bootstrap reset
Re-run the Bootstrap CLI. This example uses interface eth0. Replace this with your updated IP address, hostname or interface using the interface or ip-addr option.
Consider the following for container environments, and make adjustments as needed.
Flannel Virtual Networks
If you are using Flannel with a container environment on your network, you may need to change its default IP address ranges if they conflict with other addresses on your network. This can only be done one time during the first installation.
The address range is 10.244.0.0/16. NetQ overrides the original Flannel default, which is 10.1.0.0/16.
To change the default address range, use the CLI with the pod-ip-range option. For example:
Set Up Your VMware Virtual Machine for an On-premises Server Cluster
First configure the VM on the master node, and then configure the VM on each worker node.
Follow these steps to setup and configure your VM cluster for an on-premises deployment:
Verify that your master node meets the VM requirements.
Resource
Minimum Requirements
Processor
Eight (8) virtual CPUs
Memory
64 GB RAM
Local disk storage
256 GB SSD with minimum disk IOPS of 1000 for a standard 4kb block size (Note: This must be an SSD; use of other storage options can lead to system instability and are not supported.)
Network interface speed
1 Gb NIC
Hypervisor
VMware ESXi™ 6.5 or later (OVA image) for servers running Cumulus Linux, CentOS, Ubuntu, and RedHat operating systems
Confirm that the needed ports are open for communications.
You must open the following ports on your NetQ on-premises servers:
Port or Protocol Number
Protocol
Component Access
4
IP Protocol
Calico networking (IP-in-IP Protocol)
22
TCP
SSH
80
TCP
Nginx
179
TCP
Calico networking (BGP)
443
TCP
NetQ UI
2379
TCP
etcd datastore
4789
UDP
Calico networking (VxLAN)
5000
TCP
Docker registry
6443
TCP
kube-apiserver
30001
TCP
DPU communication
31980
TCP
NetQ Agent communication
31982
TCP
NetQ Agent SSL communication
32708
TCP
API Gateway
Additionally, for internal cluster communication, you must open these ports:
Open your hypervisor and set up your VM. You can use this example for reference or use your own hypervisor instructions.
VMware Example Configuration
This example shows the VM setup process using an OVA file with VMware ESXi.
Enter the address of the hardware in your browser.
Log in to VMware using credentials with root access.
Click Storage in the Navigator to verify you have an SSD installed.
Click Create/Register VM at the top of the right pane.
Select Deploy a virtual machine from an OVF or OVA file, and click Next.
Provide a name for the VM, for example NetQ.
Tip: Make note of the name used during install as this is needed in a later step.
Drag and drop the NetQ Platform image file you downloaded in Step 2 above.
Click Next.
Select the storage type and data store for the image to use, then click Next. In this example, only one is available.
Accept the default deployment options or modify them according to your network needs. Click Next when you are finished.
Review the configuration summary. Click Back to change any of the settings, or click Finish to continue with the creation of the VM.
The progress of the request is shown in the Recent Tasks window at the bottom of the application. This may take some time, so continue with your other work until the upload finishes.
Once completed, view the full details of the VM and hardware.
Log in to the VM and change the password.
Use the default credentials to log in the first time:
Username: cumulus
Password: cumulus
$ ssh cumulus@<ipaddr>
Warning: Permanently added '<ipaddr>' (ECDSA) to the list of known hosts.
Ubuntu 20.04 LTS
cumulus@<ipaddr>'s password:
You are required to change your password immediately (root enforced)
System information as of Thu Dec  3 21:35:42 UTC 2020
System load:  0.09              Processes:           120
Usage of /:   8.1% of 61.86GB   Users logged in:     0
Memory usage: 5%                IP address for eth0: <ipaddr>
Swap usage:   0%
WARNING: Your password has expired.
You must change your password now and login again!
Changing password for cumulus.
(current) UNIX password: cumulus
Enter new UNIX password:
Retype new UNIX password:
passwd: password updated successfully
Connection to <ipaddr> closed.
Log in again with your new password.
$ ssh cumulus@<ipaddr>
Warning: Permanently added '<ipaddr>' (ECDSA) to the list of known hosts.
Ubuntu 20.04 LTS
cumulus@<ipaddr>'s password:
  System information as of Thu Dec  3 21:35:59 UTC 2020
  System load:  0.07              Processes:           121
  Usage of /:   8.1% of 61.86GB   Users logged in:     0
  Memory usage: 5%                IP address for eth0: <ipaddr>
  Swap usage:   0%
Last login: Thu Dec  3 21:35:43 2020 from <local-ipaddr>
cumulus@ubuntu:~$
Verify the master node is ready for installation. Fix any errors indicated before installing the NetQ software.
cumulus@hostname:~$ sudo opta-check
Change the hostname for the VM from the default value.
The default hostname for the NetQ Virtual Machines is ubuntu. Change the hostname to fit your naming conventions while meeting Internet and Kubernetes naming standards.
Kubernetes requires that hostnames are composed of a sequence of labels concatenated with dots. For example, “en.wikipedia.org” is a hostname. Each label must be from 1 to 63 characters long. The entire hostname, including the delimiting dots, has a maximum of 253 ASCII characters.
The Internet standards (RFCs) for protocols specify that labels may contain only the ASCII letters a through z (in lower case), the digits 0 through 9, and the hyphen-minus character ('-').
Re-run the Bootstrap CLI. This example uses interface eth0. Replace this with your updated IP address, hostname or interface using the interface or ip-addr option.
Consider the following for container environments, and make adjustments as needed.
Flannel Virtual Networks
If you are using Flannel with a container environment on your network, you may need to change its default IP address ranges if they conflict with other addresses on your network. This can only be done one time during the first installation.
The address range is 10.244.0.0/16. NetQ overrides the original Flannel default, which is 10.1.0.0/16.
To change the default address range, use the CLI with the pod-ip-range option. For example:
Provide a password using the password option if required. Allow about five to ten minutes for this to complete, and only then continue to the next step.
If this step fails for any reason, you can run netq bootstrap reset [purge-db|keep-db] on the new worker node and then try again.
Repeat Steps 10 through 14 for each additional worker node you want in your cluster.
The final step is to install and activate the NetQ software. You can do this using the Admin UI or the CLI.
Click the installation and activation method you want to use to complete installation:
Open your hypervisor and set up your VM. You can use this example for reference or use your own hypervisor instructions.
VMware Example Configuration
This example shows the VM setup process using an OVA file with VMware ESXi.
Enter the address of the hardware in your browser.
Log in to VMware using credentials with root access.
Click Storage in the Navigator to verify you have an SSD installed.
Click Create/Register VM at the top of the right pane.
Select Deploy a virtual machine from an OVF or OVA file, and click Next.
Provide a name for the VM, for example NetQ.
Tip: Make note of the name used during install as this is needed in a later step.
Drag and drop the NetQ Platform image file you downloaded in Step 2 above.
Click Next.
Select the storage type and data store for the image to use, then click Next. In this example, only one is available.
Accept the default deployment options or modify them according to your network needs. Click Next when you are finished.
Review the configuration summary. Click Back to change any of the settings, or click Finish to continue with the creation of the VM.
The progress of the request is shown in the Recent Tasks window at the bottom of the application. This may take some time, so continue with your other work until the upload finishes.
Once completed, view the full details of the VM and hardware.
Log in to the VM and change the password.
Use the default credentials to log in the first time:
Username: cumulus
Password: cumulus
$ ssh cumulus@<ipaddr>
Warning: Permanently added '<ipaddr>' (ECDSA) to the list of known hosts.
Ubuntu 20.04 LTS
cumulus@<ipaddr>'s password:
You are required to change your password immediately (root enforced)
System information as of Thu Dec  3 21:35:42 UTC 2020
System load:  0.09              Processes:           120
Usage of /:   8.1% of 61.86GB   Users logged in:     0
Memory usage: 5%                IP address for eth0: <ipaddr>
Swap usage:   0%
WARNING: Your password has expired.
You must change your password now and login again!
Changing password for cumulus.
(current) UNIX password: cumulus
Enter new UNIX password:
Retype new UNIX password:
passwd: password updated successfully
Connection to <ipaddr> closed.
Log in again with your new password.
$ ssh cumulus@<ipaddr>
Warning: Permanently added '<ipaddr>' (ECDSA) to the list of known hosts.
Ubuntu 20.04 LTS
cumulus@<ipaddr>'s password:
  System information as of Thu Dec  3 21:35:59 UTC 2020
  System load:  0.07              Processes:           121
  Usage of /:   8.1% of 61.86GB   Users logged in:     0
  Memory usage: 5%                IP address for eth0: <ipaddr>
  Swap usage:   0%
Last login: Thu Dec  3 21:35:43 2020 from <local-ipaddr>
cumulus@ubuntu:~$
Verify the master node is ready for installation. Fix any errors indicated before installing the NetQ software.
cumulus@hostname:~$ sudo opta-check-cloud
Change the hostname for the VM from the default value.
The default hostname for the NetQ Virtual Machines is ubuntu. Change the hostname to fit your naming conventions while meeting Internet and Kubernetes naming standards.
Kubernetes requires that hostnames are composed of a sequence of labels concatenated with dots. For example, “en.wikipedia.org” is a hostname. Each label must be from 1 to 63 characters long. The entire hostname, including the delimiting dots, has a maximum of 253 ASCII characters.
The Internet standards (RFCs) for protocols specify that labels may contain only the ASCII letters a through z (in lower case), the digits 0 through 9, and the hyphen-minus character ('-').
Allow about five to ten minutes for this to complete, and only then continue to the next step.
If this step fails for any reason, you can run netq bootstrap reset and then try again.
If you have changed the IP address or hostname of the NetQ Cloud VM after this step, you need to re-register this address with NetQ as follows:
Reset the VM.
cumulus@hostname:~$ netq bootstrap reset
Re-run the Bootstrap CLI. This example uses interface eth0. Replace this with your updated IP address, hostname or interface using the interface or ip-addr option.
Consider the following for container environments, and make adjustments as needed.
Flannel Virtual Networks
If you are using Flannel with a container environment on your network, you may need to change its default IP address ranges if they conflict with other addresses on your network. This can only be done one time during the first installation.
The address range is 10.244.0.0/16. NetQ overrides the original Flannel default, which is 10.1.0.0/16.
To change the default address range, use the CLI with the pod-ip-range option. For example:
Provide a password using the password option if required. Allow about five to ten minutes for this to complete, and only then continue to the next step.
If this step fails for any reason, you can run netq bootstrap reset on the new worker node and then try again.
Repeat Steps 10 through 14 for each additional worker node you want in your cluster.
The final step is to install and activate the NetQ software. You can do this using the Admin UI or the CLI.
Click the installation and activation method you want to use to complete installation:
Set Up Your KVM Virtual Machine for a Single On-premises Server
Follow these steps to setup and configure your VM on a single server in an on-premises deployment:
Verify that your system meets the VM requirements.
Resource
Minimum Requirements
Processor
Eight (8) virtual CPUs
Memory
64 GB RAM
Local disk storage
256 GB SSD with minimum disk IOPS of 1000 for a standard 4kb block size (Note: This must be an SSD; use of other storage options can lead to system instability and are not supported.)
Network interface speed
1 Gb NIC
Hypervisor
KVM/QCOW (QEMU Copy on Write) image for servers running CentOS, Ubuntu, and RedHat operating systems
Confirm that the needed ports are open for communications.
You must open the following ports on your NetQ on-premises server:
Copy the QCOW2 image to a directory where you want to run it.
Tip: Copy, instead of moving, the original QCOW2 image that was downloaded to avoid re-downloading it again later should you need to perform this process again.
Replace the disk path value with the location where the QCOW2 image is to reside. Replace network model value (eth0 in the above example) with the name of the interface where the VM is connected to the external network.
Or, for a Bridged VM, where the VM attaches to a bridge which has already been setup to allow for external access:
Replace network bridge value (br0 in the above example) with the name of the (pre-existing) bridge interface where the VM is connected to the external network.
Make note of the name used during install as this is needed in a later step.
Watch the boot process in another terminal window.
$ virsh console netq_ts
Log in to the VM and change the password.
Use the default credentials to log in the first time:
Username: cumulus
Password: cumulus
$ ssh cumulus@<ipaddr>
Warning: Permanently added '<ipaddr>' (ECDSA) to the list of known hosts.
Ubuntu 20.04 LTS
cumulus@<ipaddr>'s password:
You are required to change your password immediately (root enforced)
System information as of Thu Dec  3 21:35:42 UTC 2020
System load:  0.09              Processes:           120
Usage of /:   8.1% of 61.86GB   Users logged in:     0
Memory usage: 5%                IP address for eth0: <ipaddr>
Swap usage:   0%
WARNING: Your password has expired.
You must change your password now and login again!
Changing password for cumulus.
(current) UNIX password: cumulus
Enter new UNIX password:
Retype new UNIX password:
passwd: password updated successfully
Connection to <ipaddr> closed.
Log in again with your new password.
$ ssh cumulus@<ipaddr>
Warning: Permanently added '<ipaddr>' (ECDSA) to the list of known hosts.
Ubuntu 20.04 LTS
cumulus@<ipaddr>'s password:
  System information as of Thu Dec  3 21:35:59 UTC 2020
  System load:  0.07              Processes:           121
  Usage of /:   8.1% of 61.86GB   Users logged in:     0
  Memory usage: 5%                IP address for eth0: <ipaddr>
  Swap usage:   0%
Last login: Thu Dec  3 21:35:43 2020 from <local-ipaddr>
cumulus@ubuntu:~$
Verify the platform is ready for installation. Fix any errors indicated before installing the NetQ software.
cumulus@hostname:~$ sudo opta-check
Change the hostname for the VM from the default value.
The default hostname for the NetQ Virtual Machines is ubuntu. Change the hostname to fit your naming conventions while meeting Internet and Kubernetes naming standards.
Kubernetes requires that hostnames are composed of a sequence of labels concatenated with dots. For example, “en.wikipedia.org” is a hostname. Each label must be from 1 to 63 characters long. The entire hostname, including the delimiting dots, has a maximum of 253 ASCII characters.
The Internet standards (RFCs) for protocols specify that labels may contain only the ASCII letters a through z (in lower case), the digits 0 through 9, and the hyphen-minus character ('-').
Re-run the Bootstrap CLI. This example uses interface eth0. Replace this with your updated IP address, hostname or interface using the interface or ip-addr option.
Consider the following for container environments, and make adjustments as needed.
Flannel Virtual Networks
If you are using Flannel with a container environment on your network, you may need to change its default IP address ranges if they conflict with other addresses on your network. This can only be done one time during the first installation.
The address range is 10.244.0.0/16. NetQ overrides the original Flannel default, which is 10.1.0.0/16.
To change the default address range, use the CLI with the pod-ip-range option. For example:
Copy the QCOW2 image to a directory where you want to run it.
Tip: Copy, instead of moving, the original QCOW2 image that was downloaded to avoid re-downloading it again later should you need to perform this process again.
Replace the disk path value with the location where the QCOW2 image is to reside. Replace network model value (eth0 in the above example) with the name of the interface where the VM is connected to the external network.
Or, for a Bridged VM, where the VM attaches to a bridge which has already been setup to allow for external access:
Replace network bridge value (br0 in the above example) with the name of the (pre-existing) bridge interface where the VM is connected to the external network.
Make note of the name used during install as this is needed in a later step.
Watch the boot process in another terminal window.
$ virsh console netq_ts
Log in to the VM and change the password.
Use the default credentials to log in the first time:
Username: cumulus
Password: cumulus
$ ssh cumulus@<ipaddr>
Warning: Permanently added '<ipaddr>' (ECDSA) to the list of known hosts.
Ubuntu 20.04 LTS
cumulus@<ipaddr>'s password:
You are required to change your password immediately (root enforced)
System information as of Thu Dec  3 21:35:42 UTC 2020
System load:  0.09              Processes:           120
Usage of /:   8.1% of 61.86GB   Users logged in:     0
Memory usage: 5%                IP address for eth0: <ipaddr>
Swap usage:   0%
WARNING: Your password has expired.
You must change your password now and login again!
Changing password for cumulus.
(current) UNIX password: cumulus
Enter new UNIX password:
Retype new UNIX password:
passwd: password updated successfully
Connection to <ipaddr> closed.
Log in again with your new password.
$ ssh cumulus@<ipaddr>
Warning: Permanently added '<ipaddr>' (ECDSA) to the list of known hosts.
Ubuntu 20.04 LTS
cumulus@<ipaddr>'s password:
  System information as of Thu Dec  3 21:35:59 UTC 2020
  System load:  0.07              Processes:           121
  Usage of /:   8.1% of 61.86GB   Users logged in:     0
  Memory usage: 5%                IP address for eth0: <ipaddr>
  Swap usage:   0%
Last login: Thu Dec  3 21:35:43 2020 from <local-ipaddr>
cumulus@ubuntu:~$
Verify the platform is ready for installation. Fix any errors indicated before installing the NetQ software.
cumulus@hostname:~$ sudo opta-check-cloud
Change the hostname for the VM from the default value.
The default hostname for the NetQ Virtual Machines is ubuntu. Change the hostname to fit your naming conventions while meeting Internet and Kubernetes naming standards.
Kubernetes requires that hostnames are composed of a sequence of labels concatenated with dots. For example, “en.wikipedia.org” is a hostname. Each label must be from 1 to 63 characters long. The entire hostname, including the delimiting dots, has a maximum of 253 ASCII characters.
The Internet standards (RFCs) for protocols specify that labels may contain only the ASCII letters a through z (in lower case), the digits 0 through 9, and the hyphen-minus character ('-').
Allow about five to ten minutes for this to complete, and only then continue to the next step.
If this step fails for any reason, you can run netq bootstrap reset and then try again.
If you have changed the IP address or hostname of the NetQ Cloud VM after this step, you need to re-register this address with NetQ as follows:
Reset the VM.
cumulus@hostname:~$ netq bootstrap reset
Re-run the Bootstrap CLI. This example uses interface eth0. Replace this with your updated IP address, hostname or interface using the interface or ip-addr option.
Consider the following for container environments, and make adjustments as needed.
Flannel Virtual Networks
If you are using Flannel with a container environment on your network, you may need to change its default IP address ranges if they conflict with other addresses on your network. This can only be done one time during the first installation.
The address range is 10.244.0.0/16. NetQ overrides the original Flannel default, which is 10.1.0.0/16.
To change the default address range, use the CLI with the pod-ip-range option. For example:
Set Up Your KVM Virtual Machine for an On-premises Server Cluster
First configure the VM on the master node, and then configure the VM on each worker node.
Follow these steps to setup and configure your VM on a cluster of servers in an on-premises deployment:
Verify that your master node meets the VM requirements.
Resource
Minimum Requirements
Processor
Eight (8) virtual CPUs
Memory
64 GB RAM
Local disk storage
256 GB SSD with minimum disk IOPS of 1000 for a standard 4kb block size (Note: This must be an SSD; use of other storage options can lead to system instability and are not supported.)
Network interface speed
1 Gb NIC
Hypervisor
KVM/QCOW (QEMU Copy on Write) image for servers running CentOS, Ubuntu, and RedHat operating systems
Confirm that the needed ports are open for communications.
You must open the following ports on your NetQ on-premises servers:
Port or Protocol Number
Protocol
Component Access
4
IP Protocol
Calico networking (IP-in-IP Protocol)
22
TCP
SSH
80
TCP
Nginx
179
TCP
Calico networking (BGP)
443
TCP
NetQ UI
2379
TCP
etcd datastore
4789
UDP
Calico networking (VxLAN)
5000
TCP
Docker registry
6443
TCP
kube-apiserver
30001
TCP
DPU communication
31980
TCP
NetQ Agent communication
31982
TCP
NetQ Agent SSL communication
32708
TCP
API Gateway
Additionally, for internal cluster communication, you must open these ports:
Copy the QCOW2 image to a directory where you want to run it.
Tip: Copy, instead of moving, the original QCOW2 image that was downloaded to avoid re-downloading it again later should you need to perform this process again.
Replace the disk path value with the location where the QCOW2 image is to reside. Replace network model value (eth0 in the above example) with the name of the interface where the VM is connected to the external network.
Or, for a Bridged VM, where the VM attaches to a bridge which has already been setup to allow for external access:
Replace network bridge value (br0 in the above example) with the name of the (pre-existing) bridge interface where the VM is connected to the external network.
Make note of the name used during install as this is needed in a later step.
Watch the boot process in another terminal window.
$ virsh console netq_ts
Log in to the VM and change the password.
Use the default credentials to log in the first time:
Username: cumulus
Password: cumulus
$ ssh cumulus@<ipaddr>
Warning: Permanently added '<ipaddr>' (ECDSA) to the list of known hosts.
Ubuntu 20.04 LTS
cumulus@<ipaddr>'s password:
You are required to change your password immediately (root enforced)
System information as of Thu Dec  3 21:35:42 UTC 2020
System load:  0.09              Processes:           120
Usage of /:   8.1% of 61.86GB   Users logged in:     0
Memory usage: 5%                IP address for eth0: <ipaddr>
Swap usage:   0%
WARNING: Your password has expired.
You must change your password now and login again!
Changing password for cumulus.
(current) UNIX password: cumulus
Enter new UNIX password:
Retype new UNIX password:
passwd: password updated successfully
Connection to <ipaddr> closed.
Log in again with your new password.
$ ssh cumulus@<ipaddr>
Warning: Permanently added '<ipaddr>' (ECDSA) to the list of known hosts.
Ubuntu 20.04 LTS
cumulus@<ipaddr>'s password:
  System information as of Thu Dec  3 21:35:59 UTC 2020
  System load:  0.07              Processes:           121
  Usage of /:   8.1% of 61.86GB   Users logged in:     0
  Memory usage: 5%                IP address for eth0: <ipaddr>
  Swap usage:   0%
Last login: Thu Dec  3 21:35:43 2020 from <local-ipaddr>
cumulus@ubuntu:~$
Verify the master node is ready for installation. Fix any errors indicated before installing the NetQ software.
cumulus@hostname:~$ sudo opta-check
Change the hostname for the VM from the default value.
The default hostname for the NetQ Virtual Machines is ubuntu. Change the hostname to fit your naming conventions while meeting Internet and Kubernetes naming standards.
Kubernetes requires that hostnames are composed of a sequence of labels concatenated with dots. For example, “en.wikipedia.org” is a hostname. Each label must be from 1 to 63 characters long. The entire hostname, including the delimiting dots, has a maximum of 253 ASCII characters.
The Internet standards (RFCs) for protocols specify that labels may contain only the ASCII letters a through z (in lower case), the digits 0 through 9, and the hyphen-minus character ('-').
Add the same NEW_HOSTNAME value to /etc/hosts on your VM for the localhost entry. Example:
127.0.0.1 localhost NEW_HOSTNAME
Run the Bootstrap CLI on the master node. Be sure to replace the eth0 interface used in this example with the interface on the server used to listen for NetQ Agents.
Re-run the Bootstrap CLI. This example uses interface eth0. Replace this with your updated IP address, hostname or interface using the interface or ip-addr option.
Consider the following for container environments, and make adjustments as needed.
Flannel Virtual Networks
If you are using Flannel with a container environment on your network, you may need to change its default IP address ranges if they conflict with other addresses on your network. This can only be done one time during the first installation.
The address range is 10.244.0.0/16. NetQ overrides the original Flannel default, which is 10.1.0.0/16.
To change the default address range, use the CLI with the pod-ip-range option. For example:
Provide a password using the password option if required. Allow about five to ten minutes for this to complete, and only then continue to the next step.
If this step fails for any reason, you can run netq bootstrap reset [purge-db|keep-db] on the new worker node and then try again.
Repeat Steps 10 through 14 for each additional worker node you want in your cluster.
The final step is to install and activate the NetQ software. You can do this using the Admin UI or the CLI.
Click the installation and activation method you want to use to complete installation:
Copy the QCOW2 image to a directory where you want to run it.
Tip: Copy, instead of moving, the original QCOW2 image that was downloaded to avoid re-downloading it again later should you need to perform this process again.
Replace the disk path value with the location where the QCOW2 image is to reside. Replace network model value (eth0 in the above example) with the name of the interface where the VM is connected to the external network.
Or, for a Bridged VM, where the VM attaches to a bridge which has already been setup to allow for external access:
Replace network bridge value (br0 in the above example) with the name of the (pre-existing) bridge interface where the VM is connected to the external network.
Make note of the name used during install as this is needed in a later step.
Watch the boot process in another terminal window.
$ virsh console netq_ts
Log in to the VM and change the password.
Use the default credentials to log in the first time:
Username: cumulus
Password: cumulus
$ ssh cumulus@<ipaddr>
Warning: Permanently added '<ipaddr>' (ECDSA) to the list of known hosts.
Ubuntu 20.04 LTS
cumulus@<ipaddr>'s password:
You are required to change your password immediately (root enforced)
System information as of Thu Dec  3 21:35:42 UTC 2020
System load:  0.09              Processes:           120
Usage of /:   8.1% of 61.86GB   Users logged in:     0
Memory usage: 5%                IP address for eth0: <ipaddr>
Swap usage:   0%
WARNING: Your password has expired.
You must change your password now and login again!
Changing password for cumulus.
(current) UNIX password: cumulus
Enter new UNIX password:
Retype new UNIX password:
passwd: password updated successfully
Connection to <ipaddr> closed.
Log in again with your new password.
$ ssh cumulus@<ipaddr>
Warning: Permanently added '<ipaddr>' (ECDSA) to the list of known hosts.
Ubuntu 20.04 LTS
cumulus@<ipaddr>'s password:
  System information as of Thu Dec  3 21:35:59 UTC 2020
  System load:  0.07              Processes:           121
  Usage of /:   8.1% of 61.86GB   Users logged in:     0
  Memory usage: 5%                IP address for eth0: <ipaddr>
  Swap usage:   0%
Last login: Thu Dec  3 21:35:43 2020 from <local-ipaddr>
cumulus@ubuntu:~$
Verify the master node is ready for installation. Fix any errors indicated before installing the NetQ software.
cumulus@hostname:~$ sudo opta-check-cloud
Change the hostname for the VM from the default value.
The default hostname for the NetQ Virtual Machines is ubuntu. Change the hostname to fit your naming conventions while meeting Internet and Kubernetes naming standards.
Kubernetes requires that hostnames are composed of a sequence of labels concatenated with dots. For example, “en.wikipedia.org” is a hostname. Each label must be from 1 to 63 characters long. The entire hostname, including the delimiting dots, has a maximum of 253 ASCII characters.
The Internet standards (RFCs) for protocols specify that labels may contain only the ASCII letters a through z (in lower case), the digits 0 through 9, and the hyphen-minus character ('-').
Allow about five to ten minutes for this to complete, and only then continue to the next step.
If this step fails for any reason, you can run netq bootstrap reset and then try again.
If you have changed the IP address or hostname of the NetQ Cloud VM after this step, you need to re-register this address with NetQ as follows:
Reset the VM.
cumulus@hostname:~$ netq bootstrap reset
Re-run the Bootstrap CLI. This example uses interface eth0. Replace this with your updated IP address, hostname or interface using the interface or ip-addr option.
Consider the following for container environments, and make adjustments as needed.
Flannel Virtual Networks
If you are using Flannel with a container environment on your network, you may need to change its default IP address ranges if they conflict with other addresses on your network. This can only be done one time during the first installation.
The address range is 10.244.0.0/16. NetQ overrides the original Flannel default, which is 10.1.0.0/16.
To change the default address range, use the CLI with the pod-ip-range option. For example:
Provide a password using the password option if required. Allow about five to ten minutes for this to complete, and only then continue to the next step.
If this step fails for any reason, you can run netq bootstrap reset on the new worker node and then try again.
Repeat Steps 10 through 14 for each additional worker node you want in your cluster.
The final step is to install and activate the NetQ software. You can do this using the Admin UI or the CLI.
Click the installation and activation method you want to use to complete installation:
This topic describes how to prepare your single, NetQ On-premises Appliance for installation of the NetQ Platform software.
Each system shipped to you contains:
Your NVIDIA Cumulus NetQ On-premises Appliance (a Supermicro 6019P-WTR server)
Hardware accessories, such as power cables and rack mounting gear (note that network cables and optics ship separately)
Information regarding your order
For more detail about hardware specifications (including LED layouts and FRUs like the power supply or fans, and accessories like included cables) or safety and environmental information, refer to the user manual and quick reference guide.
Install the Appliance
After you unbox the appliance:
Mount the appliance in the rack.
Connect it to power following the procedures described in your appliance's user manual.
Connect the Ethernet cable to the 1G management port (eno1).
Power on the appliance.
If your network runs DHCP, you can configure NetQ over the network. If DHCP is not enabled, then you configure the appliance using the console cable provided.
Configure the Password, Hostname and IP Address
Change the password and specify the hostname and IP address for the appliance before installing the NetQ software.
Log in to the appliance using the default login credentials:
Username: cumulus
Password: cumulus
Change the password using the passwd command:
cumulus@hostname:~$ passwd
Changing password for cumulus.
(current) UNIX password: cumulus
Enter new UNIX password:
Retype new UNIX password:
passwd: password updated successfully
The default hostname for the NetQ On-premises Appliance is netq-appliance. Change the hostname to fit your naming conventions while meeting Internet and Kubernetes naming standards.
Kubernetes requires that hostnames comprise a sequence of labels concatenated with dots. For example, en.wikipedia.org is a hostname. Each label must be from 1 to 63 characters long. The entire hostname, including the delimiting dots, has a maximum of 253 ASCII characters.
The Internet standards (RFCs) for protocols specify that labels can contain only the ASCII letters a through z (in lower case), the digits 0 through 9, and the hyphen-minus character ('-').
The appliance contains two Ethernet ports. It uses port eno1 for out-of-band management. This is where NetQ Agents should send the telemetry data collected from your monitored switches and hosts. By default, eno1 uses DHCPv4 to get its IP address. You can view the assigned IP address using the following command:
cumulus@hostname:~$ ip -4 -brief addr show eno1
eno1             UP             10.20.16.248/24
Alternately, you can configure the interface with a static IP address by editing the /etc/netplan/01-ethernet.yaml Ubuntu Netplan configuration file.
For example, to set your network interface eno1 to a static IP address of 192.168.1.222 with gateway 192.168.1.1 and DNS server as 8.8.8.8 and 8.8.4.4:
# This file describes the network interfaces available on your system
# For more information, see netplan(5).
network:
    version: 2
    renderer: networkd
    ethernets:
        eno1:
            dhcp4: no
            addresses: [192.168.1.222/24]
            gateway4: 192.168.1.1
            nameservers:
                addresses: [8.8.8.8,8.8.4.4]
Apply the settings.
cumulus@hostname:~$ sudo netplan apply
Verify NetQ Software and Appliance Readiness
Now that the appliance is up and running, verify that the software is available and the appliance is ready for installation.
Verify that the needed packages are present and of the correct release, version 4.1 and update 34.
cumulus@hostname:~$ dpkg -l | grep netq
ii  netq-agent   4.1.0-ub18.04u36~1638992139.2c18daee_amd64   Cumulus NetQ Telemetry Agent for Ubuntu
ii  netq-apps    4.1.0-ub18.04u36~1638992139.2c18daee_amd64   Cumulus NetQ Fabric Validation Application for Ubuntu
Verify the installation images are present and of the correct release, version 4.1.
cumulus@hostname:~$ cd /mnt/installables/
cumulus@hostname:/mnt/installables$ ls
NetQ-4.1.0.tgz  netq-bootstrap-4.1.0.tgz
Verify the appliance is ready for installation. Fix any errors indicated before installing the NetQ software.
cumulus@hostname:~$ sudo opta-check
Run the Bootstrap CLI. Be sure to replace the eno1 interface used in this example with the interface or IP address on the appliance used to listen for NetQ Agents.
Allow about five to ten minutes for this to complete, and only then continue to the next step.
If this step fails for any reason, you can run netq bootstrap reset [purge-db|keep-db] and then try again.
If you have changed the IP address or hostname of the NetQ On-premises Appliance after this step, you need to re-register this address with NetQ as follows:
Reset the appliance, indicating whether you want to purge any NetQ DB data or keep it.
Re-run the Bootstrap CLI on the appliance. This example uses interface eno1. Replace this with your updated IP address, hostname or interface using the interface or ip-addr option.
Consider the following for container environments, and make adjustments as needed.
Flannel Virtual Networks
If you are using Flannel with a container environment on your network, you may need to change its default IP address ranges if they conflict with other addresses on your network. This can only be done one time during the first installation.
The address range is 10.244.0.0/16. NetQ overrides the original Flannel default, which is 10.1.0.0/16.
To change the default address range, use the CLI with the pod-ip-range option. For example:
This topic describes how to prepare your single, NetQ Cloud Appliance for installation of the NetQ Collector software.
Each system shipped to you contains:
Your NVIDIA Cumulus NetQ Cloud Appliance (a Supermicro SuperServer E300-9D)
Hardware accessories, such as power cables and rack mounting gear (note that network cables and optics ship separately)
Information regarding your order
If you’re looking for hardware specifications (including LED layouts and FRUs like the power supply or fans and accessories like included cables) or safety and environmental information, check out the appliance’s user manual.
Install the Appliance
After you unbox the appliance:
Mount the appliance in the rack.
Connect it to power following the procedures described in your appliance's user manual.
Connect the Ethernet cable to the 1G management port (eno1).
Power on the appliance.
If your network runs DHCP, you can configure NetQ over the network. If DHCP is not enabled, then you configure the appliance using the console cable provided.
Configure the Password, Hostname and IP Address
Log in to the appliance using the default login credentials:
Username: cumulus
Password: cumulus
Change the password using the passwd command:
cumulus@hostname:~$ passwd
Changing password for cumulus.
(current) UNIX password: cumulus
Enter new UNIX password:
Retype new UNIX password:
passwd: password updated successfully
The default hostname for the NetQ Cloud Appliance is netq-appliance. Change the hostname to fit your naming conventions while meeting Internet and Kubernetes naming standards.
Kubernetes requires that hostnames comprise a sequence of labels concatenated with dots. For example, en.wikipedia.org is a hostname. Each label must be from 1 to 63 characters long. The entire hostname, including the delimiting dots, has a maximum of 253 ASCII characters.
The Internet standards (RFCs) for protocols specify that labels can contain only the ASCII letters a through z (in lower case), the digits 0 through 9, and the hyphen-minus character ('-').
The appliance contains two Ethernet ports. It uses port eno1 for out-of-band management. This is where NetQ Agents should send the telemetry data collected from your monitored switches and hosts. By default, eno1 uses DHCPv4 to get its IP address. You can view the assigned IP address using the following command:
cumulus@hostname:~$ ip -4 -brief addr show eno1
eno1             UP             10.20.16.248/24
Alternately, you can configure the interface with a static IP address by editing the /etc/netplan/01-ethernet.yaml Ubuntu Netplan configuration file.
For example, to set your network interface eno1 to a static IP address of 192.168.1.222 with gateway 192.168.1.1 and DNS server as 8.8.8.8 and 8.8.4.4:
# This file describes the network interfaces available on your system
# For more information, see netplan(5).
network:
    version: 2
    renderer: networkd
    ethernets:
        eno1:
            dhcp4: no
            addresses: [192.168.1.222/24]
            gateway4: 192.168.1.1
            nameservers:
                addresses: [8.8.8.8,8.8.4.4]
Apply the settings.
cumulus@hostname:~$ sudo netplan apply
Verify NetQ Software and Appliance Readiness
Now that the appliance is up and running, verify that the software is available and the appliance is ready for installation.
Verify that the needed packages are present and of the correct release, version 4.1.
cumulus@hostname:~$ dpkg -l | grep netq
ii  netq-agent   4.1.0-ub18.04u36~1638992139.2c18daee_amd64   Cumulus NetQ Telemetry Agent for Ubuntu
ii  netq-apps    4.1.0-ub18.04u36~1638992139.2c18daee_amd64   Cumulus NetQ Fabric Validation Application for Ubuntu
Verify the installation images are present and of the correct release, version 4.1.
cumulus@hostname:~$ cd /mnt/installables/
cumulus@hostname:/mnt/installables$ ls
NetQ-4.1.0-opta.tgz  netq-bootstrap-4.1.0.tgz
Verify the appliance is ready for installation. Fix any errors indicated before installing the NetQ software.
cumulus@hostname:~$ sudo opta-check-cloud
Run the Bootstrap CLI. Be sure to replace the eno1 interface used in this example with the interface or IP address on the appliance used to listen for NetQ Agents.
Allow about five to ten minutes for this to complete, and only then continue to the next step.
If this step fails for any reason, you can run netq bootstrap reset and then try again.
If you have changed the IP address or hostname of the NetQ Cloud Appliance after this step, you need to re-register this address with NetQ as follows:
Reset the appliance.
cumulus@hostname:~$ netq bootstrap reset
Re-run the Bootstrap CLI on the appliance. This example uses interface eno1. Replace this with your updated IP address, hostname or interface using the interface or ip-addr option.
Consider the following for container environments, and make adjustments as needed.
Flannel Virtual Networks
If you are using Flannel with a container environment on your network, you may need to change its default IP address ranges if they conflict with other addresses on your network. This can only be done one time during the first installation.
The address range is 10.244.0.0/16. NetQ overrides the original Flannel default, which is 10.1.0.0/16.
To change the default address range, use the CLI with the pod-ip-range option. For example:
This topic describes how to prepare your cluster of NetQ On-premises Appliances for installation of the NetQ Platform software.
Each system shipped to you contains:
Your NVIDIA Cumulus NetQ On-premises Appliance (a Supermicro 6019P-WTR server)
Hardware accessories, such as power cables and rack mounting gear (note that network cables and optics ship separately)
Information regarding your order
For more detail about hardware specifications (including LED layouts and FRUs like the power supply or fans, and accessories like included cables) or safety and environmental information, refer to the user manual and quick reference guide.
Install Each Appliance
After you unbox the appliance:
Mount the appliance in the rack.
Connect it to power following the procedures described in your appliance's user manual.
Connect the Ethernet cable to the 1G management port (eno1).
Power on the appliance.
If your network runs DHCP, you can configure NetQ over the network. If DHCP is not enabled, then you configure the appliance using the console cable provided.
Configure the Password, Hostname and IP Address
Change the password and specify the hostname and IP address for each appliance before installing the NetQ software.
Log in to the appliance that you intend to use as your master node using the default login credentials:
Username: cumulus
Password: cumulus
Change the password using the passwd command:
cumulus@hostname:~$ passwd
Changing password for cumulus.
(current) UNIX password: cumulus
Enter new UNIX password:
Retype new UNIX password:
passwd: password updated successfully
The default hostname for the NetQ On-premises Appliance is netq-appliance. Change the hostname to fit your naming conventions while meeting Internet and Kubernetes naming standards.
Kubernetes requires that hostnames comprise a sequence of labels concatenated with dots. For example, “en.wikipedia.org” is a hostname. Each label must be from 1 to 63 characters long. The entire hostname, including the delimiting dots, has a maximum of 253 ASCII characters.
The Internet standards (RFCs) for protocols specify that labels can contain only the ASCII letters a through z (in lower case), the digits 0 through 9, and the hyphen-minus character ('-').
The appliance contains two Ethernet ports. It uses port eno1 for out-of-band management. This is where NetQ Agents should send the telemetry data collected from your monitored switches and hosts. By default, eno1 uses DHCPv4 to get its IP address. You can view the assigned IP address using the following command:
cumulus@hostname:~$ ip -4 -brief addr show eno1
eno1             UP             10.20.16.248/24
Alternately, you can configure the interface with a static IP address by editing the /etc/netplan/01-ethernet.yaml Ubuntu Netplan configuration file.
For example, to set your network interface eno1 to a static IP address of 192.168.1.222 with gateway 192.168.1.1 and DNS server as 8.8.8.8 and 8.8.4.4:
# This file describes the network interfaces available on your system
# For more information, see netplan(5).
network:
    version: 2
    renderer: networkd
    ethernets:
        eno1:
            dhcp4: no
            addresses: [192.168.1.222/24]
            gateway4: 192.168.1.1
            nameservers:
                addresses: [8.8.8.8,8.8.4.4]
Apply the settings.
cumulus@hostname:~$ sudo netplan apply
Repeat these steps for each of the worker node appliances.
Verify NetQ Software and Appliance Readiness
Now that the appliances are up and running, verify that the software is available and the appliance is ready for installation.
On the master node, verify that the needed packages are present and of the correct release, version 4.1.
cumulus@hostname:~$ dpkg -l | grep netq
ii  netq-agent   4.1.0-ub18.04u36~1638992139.2c18daee_amd64   Cumulus NetQ Telemetry Agent for Ubuntu
ii  netq-apps    4.1.0-ub18.04u36~1638992139.2c18daee_amd64   Cumulus NetQ Fabric Validation Application for Ubuntu
Verify the installation images are present and of the correct release, version 4.1.
cumulus@hostname:~$ cd /mnt/installables/
cumulus@hostname:/mnt/installables$ ls
NetQ-4.1.0.tgz  netq-bootstrap-4.1.0.tgz
Verify the master node is ready for installation. Fix any errors indicated before installing the NetQ software.
cumulus@hostname:~$ sudo opta-check
Run the Bootstrap CLI. Be sure to replace the eno1 interface used in this example with the interface or IP address on the appliance used to listen for NetQ Agents.
Allow about five to ten minutes for this to complete, and only then continue to the next step.
If this step fails for any reason, you can run netq bootstrap reset [purge-db|keep-db] and then try again.
If you have changed the IP address or hostname of the NetQ On-premises Appliance after this step, you need to re-register this address with NetQ as follows:
Reset the appliance, indicating whether you want to purge any NetQ DB data or keep it.
Re-run the Bootstrap CLI on the appliance. This example uses interface eno1. Replace this with your updated IP address, hostname or interface using the interface or ip-addr option.
Consider the following for container environments, and make adjustments as needed.
Flannel Virtual Networks
If you are using Flannel with a container environment on your network, you may need to change its default IP address ranges if they conflict with other addresses on your network. This can only be done one time during the first installation.
The address range is 10.244.0.0/16. NetQ overrides the original Flannel default, which is 10.1.0.0/16.
To change the default address range, use the CLI with the pod-ip-range option. For example:
Provide a password using the password option if required. Allow about five to ten minutes for this to complete, and only then continue to the next step.
Repeat Steps 5-10 for each additional worker node (NetQ On-premises Appliance).
The final step is to install and activate the NetQ software on each appliance in your cluster. You can do this using the Admin UI or the NetQ CLI.
Click the installation and activation method you want to use to complete installation:
This topic describes how to prepare your cluster of NetQ Cloud Appliances for installation of the NetQ Collector software.
Each system shipped to you contains:
Your NVIDIA Cumulus NetQ Cloud Appliance (a Supermicro SuperServer E300-9D)
Hardware accessories, such as power cables and rack mounting gear (note that network cables and optics ship separately)
Information regarding your order
For more detail about hardware specifications (including LED layouts and FRUs like the power supply or fans and accessories like included cables) or safety and environmental information, refer to the user manual.
Install Each Appliance
After you unbox the appliance:
Mount the appliance in the rack.
Connect it to power following the procedures described in your appliance's user manual.
Connect the Ethernet cable to the 1G management port (eno1).
Power on the appliance.
If your network runs DHCP, you can configure NetQ over the network. If DHCP is not enabled, then you configure the appliance using the console cable provided.
Configure the Password, Hostname and IP Address
Change the password and specify the hostname and IP address for each appliance before installing the NetQ software.
Log in to the appliance that you intend to use as your master node using the default login credentials:
Username: cumulus
Password: cumulus
Change the password using the passwd command:
cumulus@hostname:~$ passwd
Changing password for cumulus.
(current) UNIX password: cumulus
Enter new UNIX password:
Retype new UNIX password:
passwd: password updated successfully
The default hostname for the NetQ Cloud Appliance is netq-appliance. Change the hostname to fit your naming conventions while meeting Internet and Kubernetes naming standards.
Kubernetes requires that hostnames comprise a sequence of labels concatenated with dots. For example, en.wikipedia.org is a hostname. Each label must be from 1 to 63 characters long. The entire hostname, including the delimiting dots, has a maximum of 253 ASCII characters.
The Internet standards (RFCs) for protocols specify that labels can contain only the ASCII letters a through z (in lower case), the digits 0 through 9, and the hyphen-minus character ('-').
The appliance contains two Ethernet ports. It uses port eno1 for out-of-band management. This is where NetQ Agents should send the telemetry data collected from your monitored switches and hosts. By default, eno1 uses DHCPv4 to get its IP address. You can view the assigned IP address using the following command:
cumulus@hostname:~$ ip -4 -brief addr show eno1
eno1 UP 10.20.16.248/24
Alternately, you can configure the interface with a static IP address by editing the /etc/netplan/01-ethernet.yaml Ubuntu Netplan configuration file.
For example, to set your network interface eno1 to a static IP address of 192.168.1.222 with gateway 192.168.1.1 and DNS server as 8.8.8.8 and 8.8.4.4:
# This file describes the network interfaces available on your system
# For more information, see netplan(5).
network:
version: 2
renderer: networkd
ethernets:
eno1:
dhcp4: no
addresses: [192.168.1.222/24]
gateway4: 192.168.1.1
nameservers:
addresses: [8.8.8.8,8.8.4.4]
Apply the settings.
cumulus@hostname:~$ sudo netplan apply
Repeat these steps for each of the worker node appliances.
Verify NetQ Software and Appliance Readiness
Now that the appliances are up and running, verify that the software is available and each appliance is ready for installation.
On the master NetQ Cloud Appliance, verify that the needed packages are present and of the correct release, version 4.1.
cumulus@hostname:~$ dpkg -l | grep netq
ii  netq-agent   4.1.0-ub18.04u36~1638992139.2c18daee_amd64   Cumulus NetQ Telemetry Agent for Ubuntu
ii  netq-apps    4.1.0-ub18.04u36~1638992139.2c18daee_amd64   Cumulus NetQ Fabric Validation Application for Ubuntu
Verify the installation images are present and of the correct release, version 4.1.
cumulus@hostname:~$ cd /mnt/installables/
cumulus@hostname:/mnt/installables$ ls
NetQ-4.1.0-opta.tgz netq-bootstrap-4.1.0.tgz
Verify the master NetQ Cloud Appliance is ready for installation. Fix any errors indicated before installing the NetQ software.
cumulus@hostname:~$ sudo opta-check-cloud
Run the Bootstrap CLI. Be sure to replace the eno1 interface used in this example with the interface or IP address on the appliance used to listen for NetQ Agents.
Allow about five to ten minutes for this to complete, and only then continue to the next step.
If this step fails for any reason, you can run netq bootstrap reset and then try again.
If you have changed the IP address or hostname of the NetQ Cloud Appliance after this step, you need to re-register this address with NetQ as follows:
Reset the appliance.
cumulus@hostname:~$ netq bootstrap reset
Re-run the Bootstrap CLI on the appliance. This example uses interface eno1. Replace this with your updated IP address, hostname or interface using the interface or ip-addr option.
Consider the following for container environments, and make adjustments as needed.
Flannel Virtual Networks
If you are using Flannel with a container environment on your network, you may need to change its default IP address ranges if they conflict with other addresses on your network. This can only be done one time during the first installation.
The address range is 10.244.0.0/16. NetQ overrides the original Flannel default, which is 10.1.0.0/16.
To change the default address range, use the CLI with the pod-ip-range option. For example:
Provide a password using the password option if required. Allow about five to ten minutes for this to complete, and only then continue to the next step.
If this step fails for any reason, you can run netq bootstrap reset on the new worker node and then try again.
Repeat Steps 5-10 for each additional worker NetQ Cloud Appliance.
The final step is to install and activate the NetQ software on each appliance in your cluster. You can do this using the Admin UI or the CLI.
Click the installation and activation method you want to use to complete installation:
Prepare Your Existing NetQ Appliances for a NetQ 4.1 Deployment
This topic describes how to prepare a NetQ 3.3.x or earlier NetQ Appliance before installing NetQ 4.1. The steps are the same for both the on-premises and cloud appliances. The only difference is the software you download for each platform. After you complete the steps included here, you are ready to perform a fresh installation of NetQ 4.1.
The figure below summarizes the preparation workflow:
To prepare your appliance:
Verify that your appliance is a supported hardware model.
For on-premises solutions using the NetQ On-premises Appliance, optionally back up your NetQ data.
Run the backup script to create a backup file in /opt/<backup-directory>.
Be sure to replace the backup-directory option with the name of the directory you want to use for the backup file. This location must be somewhere that is off of the appliance to avoid it being overwritten during these preparation steps.
You should install the Ubuntu OS on the SSD disk. Select Micron SSD with ~900 GB at step #9 in the Ubuntu instructions.
Set the default username to cumulus and password to CumulusLinux!.
When prompted, select Install SSH server.
Configure networking.
Ubuntu uses Netplan for network configuration. You can give your appliance an IP address using DHCP or a static address.
Create and/or edit the /etc/netplan/01-ethernet.yaml Netplan configuration file.
# This file describes the network interfaces available on your system
# For more information, see netplan(5).
network:
version: 2
renderer: networkd
ethernets:
eno1:
dhcp4: yes
Apply the settings.
$ sudo netplan apply
Create and/or edit the /etc/netplan/01-ethernet.yaml Netplan configuration file.
In this example the interface, eno1, has a static IP address of 192.168.1.222 with a gateway at 192.168.1.1 and DNS server at 8.8.8.8 and 8.8.4.4.
# This file describes the network interfaces available on your system
# For more information, see netplan(5).
network:
    version: 2
    renderer: networkd
    ethernets:
        eno1:
            dhcp4: no
            addresses: [192.168.1.222/24]
            gateway4: 192.168.1.1
            nameservers:
                addresses: [8.8.8.8,8.8.4.4]
Create the file /etc/apt/sources.list.d/cumulus-host-ubuntu-bionic.list and add
the following line:
root@ubuntu:~# vi /etc/apt/sources.list.d/cumulus-apps-deb-bionic.list
...
deb [arch=amd64] https://apps3.cumulusnetworks.com/repos/deb bionic netq-latest
...
The use of netq-latest in this example means that a get to the repository always retrieves the latest version of NetQ; this applies even for major version updates. If you want to keep the repository on a specific version — such as netq-4.1 — use that instead.
On the NVIDIA Application Hub, log in to your account and select NVIDIA Licensing Portal.
Select Software Downloads from the menu.
Click Product Family and select NetQ.
Select the relevant software for your appliance:
If you are installing NetQ Platform software for a NetQ On-premises Appliance, select NetQ SW 4.1 Appliance to download the NetQ-4.1.0.tgz file. If you are upgrading NetQ software for a NetQ Cloud Appliance, select NetQ SW 4.1 Appliance Cloud to download the NetQ-4.1.0-opta.tgz file.
Copy these two files, netq-bootstrap-4.1.0.tgz and either NetQ-4.1.0.tgz (on-premises) or NetQ-4.1.0-opta.tgz (cloud), to the /mnt/installables/ directory on the appliance.
Verify that the needed files are present and of the correct release. This example shows on-premises files. The only difference for cloud files is that it should list NetQ-4.1.0-opta.tgz instead of NetQ-4.1.0.tgz.
```
cumulus@<hostname>:~$ dpkg -l | grep netq
ii  netq-agent   4.1.0-ub18.04u33~1614767175.886b337_amd64   NVIDIA NetQ Telemetry Agent for Ubuntu
ii  netq-apps    4.1.0-ub18.04u33~1614767175.886b337_amd64   NVIDIA NetQ Fabric Validation Application for Ubuntu

cumulus@<hostname>:~$ cd /mnt/installables/
cumulus@<hostname>:/mnt/installables$ ls
NetQ-4.1.0.tgz  netq-bootstrap-4.1.0.tgz
```
Run the bootstrap CLI on your appliance. Be sure to replace the eth0 interface used in this example with the interface or IP address on the appliance used to listen for NetQ Agents.
If you are creating a server cluster, you need to prepare each of those appliances as well. Repeat these steps if you are using a previously deployed appliance or refer to Install the NetQ System for a new appliance.
You can install the NetQ software using the Admin UI, which you use for either a default basic installation or an advanced installation.
This is the final set of steps for installing NetQ. If you have not already performed the installation preparation steps, go to Install the NetQ System before continuing here.
Install NetQ
To install NetQ:
Log in to your NetQ On-premises Appliance, NetQ Cloud Appliance, the master node of your cluster, or VM.
In your browser address field, enter https://<hostname-or-ipaddr>:8443.
Enter your NetQ credentials to enter the application. The default username is admin and the default password in admin.
Then click Sign In.
Click Begin Installation.
Choose an installation type: basic or advanced.
Read the descriptions carefully to be sure to select the correct type. Then follow these instructions based on your selection.
Select Basic Install, then click .
Select a deployment type.
Choose which type of deployment model you want to use. Both options provide secure access to data and features useful for monitoring and troubleshooting your network.
Install the NetQ software according to your deployment type.
Enter or upload the NetQ 4.1.0 tarball.
Click once you are ready to install.
NOTE: You cannot stop the installation once it has begun.
NOTE: You cannot stop the installation once it has begun.
Monitor the progress of the installation job. Click Details for a job to see more granular progress.
Installation Results
If the installation succeeds, you are directed to the Health page of the Admin UI. Refer to View NetQ System Health.
If the installation fails, a failure indication is given.
Click to download a json file with a description why the installation failed.
Can the error can be resolved by moving to the advanced configuration flow?
No: close the Admin UI, resolve the error, run netq boostrap reset and netq bootstrap master commands, then reopen the Admin UI to start installation again.
Yes: click to be taken to the advanced installation flow and retry the failed task. Refer to the Advanced tab for instructions.
Select Advanced Install, then click .
Select your deployment type.
Choose the deployment model you want to use. Both options provide secure access to data and features useful for monitoring and troubleshooting your network.
Monitor the initialization of the master node. When complete, click .
Self-hosted, on-premises deployment
Remote-hosted, multi-site or cloud deployment
For on-premises (self-hosted) deployments only, select your install method. For cloud deployments, skip to step E.
Choose between restoring data from a previous version of NetQ or performing a fresh installation.
If you are moving from a standalone to a server cluster arrangement, you can only restore your data one time. After the data has been converted to the cluster schema, it cannot be returned to the single server format.
Fresh Install: Continue with step E.
Maintain Existing Data (on-premises only): If you have created a backup of your NetQ data, choose this option. Enter the restoration filename in the field provided and click or upload it.
Select your server arrangement.
Select whether you want to deploy your infrastructure as a single stand-alone server or as a cluster of servers.
Monitor the master configuration. When complete click .
Use the private IP addresses that you assigned to the nodes being used as worker nodes to add the worker nodes to the server cluster.
Click Add Worker Node. Enter the unique private IP address for the first worker node. It cannot be the same as the master node or other worker nodes. Click Add.
Monitor the progress. When complete click .
Repeat these steps for the second worker node.
Click Create Cluster. When complete click .
If either of the add worker jobs fail, an indication is given. For example, the IP address provided for the worker node was unreachable. You can see this by clicking to open the error file.
You install the NetQ software using the installation files (NetQ-4.1.0-tgz for on-premises deployments or NetQ-4.1.0-opta.tgz for cloud deployments) that you downloaded and stored previously.
For on-premises: Accept the path and filename suggested, or modify these to reflect where you stored your installation file, then click . Alternately, upload the file.
For cloud: Accept the path and filename suggested, or modify these to reflect where you stored your installation file. Enter your configuration key. The configuration key is obtained during first login to the NetQ Cloud and premise activation, and it can also be accessed from the Premise menu. Then click .
If the installation fails, a failure indication is given. For example:
Click to download an error file in JSON format, or click to return to the previous step.
Activate NetQ.
This final step activates the software and enables you to view the health of your NetQ system. For remote deployments, you must enter your configuration key. The configuration key is obtained during first login to the NetQ Cloud and premise activation, and it can also be accessed from the Premise menu.
View NetQ System Health
When the installation and activation is complete, the NetQ System Health dashboard is visible for tracking the status of key components in the system. The cards displayed represent the deployment chosen:
Server Arrangement
Deployment Type
Node Card/s
Pod Card
Kafka Card
Zookeeper Card
Cassandra Card
Standalone server
On-premises
Master
Yes
Yes
Yes
Yes
Standalone server
Cloud
Master
Yes
No
No
No
Server cluster
On-premises
Master, 2+ Workers
Yes
Yes
Yes
Yes
Server cluster
Cloud
Master, 2+ Workers
Yes
No
No
No
Self-hosted, on-premises deployment
Remote-hosted, mulit-site or cloud, deployment
If you have deployed an on-premises solution, you can add a custom signed certificate. Refer to Install a Certificate for instructions.
Click Open NetQ to enter the NetQ UI application.
Install NetQ Using the CLI
You can now install the NetQ software using the NetQ CLI.
This is the final set of steps for installing NetQ. If you have not already performed the installation preparation steps, go to Install the NetQ System before continuing here.
Install the NetQ System
To install NetQ, log in to your NetQ platform server, NetQ Appliance, NetQ Cloud Appliance or the master node of your cluster.
Then, to install the software, choose the tab for the type of deployment:
Run the following command on your NetQ platform server or NetQ Appliance:
cumulus@hostname:~$ netq install standalone full interface eth0 bundle /mnt/installables/NetQ-4.1.0.tgz
Run the following commands on your master node, using the IP addresses of your worker nodes:
You can specify the IP address instead of the interface name here: use ip-addr <IP address> in place of interface <ifname> above.
Run the netq show opta-health command to verify all applications are operating properly. Allow 10-15 minutes for all applications to come up and report their status.
If any of the applications or services display Status as DOWN after 30 minutes, open a support ticket and attach the output of the opta-support command.
Install the OPTA Server
To install the OPTA server, choose the tab for the type of deployment:
Run the following command on your NetQ Cloud Appliance with the config-key sent by NVIDIA in an email titled “A new site has been added to your NVIDIA Cumulus NetQ account."
Run the following commands on your master NetQ Cloud Appliance with the config-key sent by NVIDIA in an email titled “A new site has been added to your NVIDIA Cumulus NetQ account."
After installing your NetQ Platform or Collector software, the next step is to install NetQ switch software for all switches and host servers that you want to monitor in your network. This includes the NetQ Agent and, optionally, the NetQ CLI. While the CLI is optional, it can be very useful to be able to access a switch or host through the command line for troubleshooting or device management. The NetQ Agent sends the telemetry data on a switch or host to your NetQ Platform or Collector on your NetQ On-premises or Cloud Appliance or VM.
After installing your NetQ software, you should install the NetQ 4.1 Agents on each switch you want to monitor. You can install NetQ Agents on switches and servers running:
Cumulus Linux 3.3.2-3.7.x, 4.0.0 and later
SONiC 202012 and later
CentOS 7
RHEL 7.1
Ubuntu 18.04
Prepare for NetQ Agent Installation
For switches running Cumulus Linux and SONiC, you need to:
Install and configure NTP, if needed
Obtain NetQ software packages
For servers running RHEL, CentOS, or Ubuntu, you need to:
Verify you installed the minimum package versions
Verify the server is running lldpd
Install and configure NTP, if needed
Obtain NetQ software packages
If your network uses a proxy server for external connections, you should first
configure a global proxy so apt-get can access the software package in the NVIDIA networking repository.
Verify NTP Is Installed and Configured
Verify that
NTP is running on the switch. The switch must be in time synchronization with the NetQ Platform or NetQ Appliance to enable useful statistical analysis.
cumulus@switch:~$ sudo systemctl status ntp
[sudo] password for cumulus:
● ntp.service - LSB: Start NTP daemon
        Loaded: loaded (/etc/init.d/ntp; bad; vendor preset: enabled)
        Active: active (running) since Fri 2018-06-01 13:49:11 EDT; 2 weeks 6 days ago
          Docs: man:systemd-sysv-generator(8)
        CGroup: /system.slice/ntp.service
                └─2873 /usr/sbin/ntpd -p /var/run/ntpd.pid -g -c /var/lib/ntp/ntp.conf.dhcp -u 109:114
If NTP is not installed, install and configure it before continuing.
If NTP is not running:
Verify the IP address or hostname of the NTP server in the /etc/ntp.conf file, and then
Reenable and start the NTP service using the systemctl [enable|start] ntp commands
If you are running NTP in your out-of-band management network with VRF, specify the VRF (ntp@<vrf-name> versus just ntp) in the above commands.
Obtain NetQ Agent Software Package
To install the NetQ Agent you need to install netq-agent on each switch or host. This is available from the NVIDIA networking repository.
To obtain the NetQ Agent package:
Edit the /etc/apt/sources.list file to add the repository for NetQ.
Note that NetQ has a separate repository from Cumulus Linux.
cumulus@switch:~$ sudo nano /etc/apt/sources.list
...
deb https://apps3.cumulusnetworks.com/repos/deb CumulusLinux-3 netq-4.1
...
You can use the deb https://apps3.cumulusnetworks.com/repos/deb CumulusLinux-3 netq-latest repository if you want to always retrieve the latest posted version of NetQ.
Cumulus Linux 4.4 and above includes the netq-agent package by default.
To add the repository, uncomment or add the following line in /etc/apt/sources.list:
cumulus@switch:~$ sudo nano /etc/apt/sources.list
...
deb https://apps3.cumulusnetworks.com/repos/deb CumulusLinux-4 netq-4.1
...
You can use the deb https://apps3.cumulusnetworks.com/repos/deb CumulusLinux-4 netq-latest repository if you want to always retrieve the latest posted version of NetQ.
Add the apps3.cumulusnetworks.com authentication key to Cumulus Linux:
Verify that
NTP is running on the switch. The switch must be in time synchronization with the NetQ Platform or NetQ Appliance to enable useful statistical analysis.
admin@switch:~$ sudo systemctl status ntp
● ntp.service - Network Time Service
     Loaded: loaded (/lib/systemd/system/ntp.service; enabled; vendor preset: enabled)
     Active: active (running) since Tue 2021-06-08 14:56:16 UTC; 2min 18s ago
       Docs: man:ntpd(8)
    Process: 1444909 ExecStart=/usr/lib/ntp/ntp-systemd-wrapper (code=exited, status=0/SUCCESS)
   Main PID: 1444921 (ntpd)
      Tasks: 2 (limit: 9485)
     Memory: 1.9M
     CGroup: /system.slice/ntp.service
             └─1444921 /usr/sbin/ntpd -p /var/run/ntpd.pid -x -u 106:112
If NTP is not installed, install and configure it before continuing.
If NTP is not running:
Verify the IP address or hostname of the NTP server in the /etc/sonic/config_db.json file, and then
Reenable and start the NTP service using the sudo config reload -n command
Verify NTP is operating correctly. Look for an asterisk (*) or a plus sign (+) that indicates the clock synchronized with NTP.
admin@switch:~$ show ntp
MGMT_VRF_CONFIG is not present.
synchronised to NTP server (104.194.8.227) at stratum 3
   time correct to within 2014 ms
   polling server every 64 s
     remote           refid      st t when poll reach   delay   offset  jitter
==============================================================================
-144.172.118.20  139.78.97.128    2 u   26   64  377   47.023  -1798.1 120.803
+208.67.75.242   128.227.205.3    2 u   32   64  377   72.050  -1939.3  97.869
+216.229.4.66    69.89.207.99     2 u  160   64  374   41.223  -1965.9  83.585
*104.194.8.227   164.67.62.212    2 u   33   64  377    9.180  -1934.4  97.376
Obtain NetQ Agent Software Package
To install the NetQ Agent you need to install netq-agent on each switch or host. This is available from the NVIDIA networking repository.
Note that NetQ has a separate repository from SONiC.
To obtain the NetQ Agent package:
Install the wget utility so you can install the GPG keys in step 3.
Before you install the NetQ Agent on a Red Hat or CentOS server, make sure you install and run at least the minimum versions of the following packages:
iproute-3.10.0-54.el7_2.1.x86_64
lldpd-0.9.7-5.el7.x86_64
ntp-4.2.6p5-25.el7.centos.2.x86_64
ntpdate-4.2.6p5-25.el7.centos.2.x86_64
Verify the Server is Running lldpd and wget
Make sure you are running lldpd, not lldpad. CentOS does not include lldpd by default, nor does it include wget; however,the installation requires it.
To install this package, run the following commands:
If NTP is not already installed and configured, follow these steps:
Install
NTP on the server, if not already installed. Servers must be in time synchronization with the NetQ Platform or NetQ Appliance to enable useful statistical analysis.
root@ubuntu:~# sudo apt-get install ntp
Configure the network time server.
Open the /etc/ntp.conf file in your text editor of choice.
Under the Server section, specify the NTP server IP address or hostname.
Create the file /etc/apt/sources.list.d/cumulus-host-ubuntu-bionic.list and add the following line:
root@ubuntu:~# vi /etc/apt/sources.list.d/cumulus-apps-deb-bionic.list
...
deb [arch=amd64] https://apps3.cumulusnetworks.com/repos/deb bionic netq-latest
...
The use of netq-latest in these examples means that a get to the repository always retrieves the latest version of NetQ, even for a major version update. If you want to keep the repository on a specific version — such as netq-4.1 — use that instead.
Install NetQ Agent
After completing the preparation steps, you can successfully install the agent onto your switch or host.
To install the NetQ Agent (this example uses Cumulus Linux but the steps are the same for SONiC):
Update the local apt repository, then install the NetQ software on the switch.
Continue with NetQ Agent Configuration in the next section.
Configure NetQ Agent
After you install the NetQ Agents on the switches you want to monitor, you must configure them to obtain useful and relevant data.
The NetQ Agent is aware of and communicates through the designated VRF. If you do not specify one, it uses the default VRF (named default). If you later change the VRF configured for the NetQ Agent (using a lifecycle management configuration profile, for example), you might cause the NetQ Agent to lose communication.
Two methods are available for configuring a NetQ Agent:
Edit the configuration file on the switch, or
Use the NetQ CLI
Configure NetQ Agents Using a Configuration File
You can configure the NetQ Agent in the netq.yml configuration file contained in the /etc/netq/ directory.
Open the netq.yml file using your text editor of choice. For example:
sudo nano /etc/netq/netq.yml
Locate the netq-agent section, or add it.
Set the parameters for the agent as follows:
port: 31980 (default configuration)
server: IP address of the NetQ Appliance or VM where the agent should send its collected data
If you configured the NetQ CLI, you can use it to configure the NetQ Agent to send telemetry data to the NetQ Appliance or VM. To configure the NetQ CLI, refer to Install NetQ CLI.
A couple of additional options are available for configuring the NetQ Agent. If you are using VRFs, you can configure the agent to communicate over a specific VRF. You can also configure the agent to use a particular port.
Configure the Agent to Use a VRF
By default, NetQ uses the default VRF for communication between the NetQ Appliance or VM and NetQ Agents. While optional, NVIDIA strongly recommends that you configure NetQ Agents to communicate with the NetQ Appliance or VM only via a
VRF, including a
management VRF. To do so, you need to specify the VRF name when configuring the NetQ Agent. For example, if you configured the management VRF and you want the agent to communicate with the NetQ Appliance or VM over it, configure the agent like this:
If you later change the VRF configured for the NetQ Agent (using a lifecycle management configuration profile, for example), you might cause the NetQ Agent to lose communication.
Configure the Agent to Communicate over a Specific Port
By default, NetQ uses port 31980 for communication between the NetQ Appliance or VM and NetQ Agents. If you want the NetQ Agent to communicate with the NetQ Appliance or VM via a different port, you need to specify the port number when configuring the NetQ Agent, like this:
sudo netq config add agent server 192.168.1.254 port 7379
sudo netq config restart agent
Install NetQ CLI
When installing NetQ 4.1, you are not required to install the NetQ CLI on your NetQ Appliances or VMs, or monitored switches and hosts, but it provides new features, important bug fixes, and the ability to manage your network from multiple points in the network.
After installing your NetQ software and the NetQ 4.1 Agent on each switch you want to monitor, you can also install the NetQ CLI on switches running:
Cumulus Linux version 3.3.2-3.7.x, 4.0.0 and later
SONiC 202012 and later
CentOS 7
RHEL 7.1
Ubuntu 18.04
If your network uses a proxy server for external connections, you should first
configure a global proxy so apt-get can access the software package in the NetQ repository.
Prepare for NetQ CLI Installation on a RHEL, CentOS or Ubuntu Server
For servers running RHEL 7, CentOS or Ubuntu OS, you need to:
Verify you installed the minimum service packages versions
Verify the server is running lldpd
Install and configure NTP, if needed
Obtain NetQ software packages
You do not take any of these steps on Cumulus Linux or SONiC.
Verify Service Package Versions
iproute-3.10.0-54.el7_2.1.x86_64
lldpd-0.9.7-5.el7.x86_64
ntp-4.2.6p5-25.el7.centos.2.x86_64
ntpdate-4.2.6p5-25.el7.centos.2.x86_64
iproute 1:4.3.0-1ubuntu3.16.04.1 all
iproute2 4.3.0-1ubuntu3 amd64
lldpd 0.7.19-1 amd64
ntp 1:4.2.8p4+dfsg-3ubuntu5.6 amd64
Verify What CentOS and Ubuntu Are Running
For CentOS and Ubuntu, make sure you are running lldpd, not lldpad. CentOS and Ubuntu do not include lldpd by default, even though the installation requires it. In addition, CentOS does not include wget, even though the installation requires it.
To install this package, run the following commands:
If you are running NTP in your out-of-band management network with VRF, specify the VRF (ntp@<vrf-name> versus just ntp) in the above commands.
Verify NTP is operating correctly. Look for an asterisk (*) or a plus sign (+) that indicates the clock synchronized with NTP.
root@rhel7:~# ntpq -pn
remote           refid            st t when poll reach   delay   offset  jitter
==============================================================================
+173.255.206.154 132.163.96.3     2 u   86  128  377   41.354    2.834   0.602
+12.167.151.2    198.148.79.209   3 u  103  128  377   13.395   -4.025   0.198
2a00:7600::41    .STEP.          16 u    - 1024    0    0.000    0.000   0.000
\*129.250.35.250 249.224.99.213   2 u  101  128  377   14.588   -0.299   0.243
Install
NTP on the server, if not already installed. Servers must be in time synchronization with the NetQ Platform or NetQ Appliance to enable useful statistical analysis.
root@ubuntu:~# sudo apt-get install ntp
Configure the network time server.
Open the /etc/ntp.conf file in your text editor of choice.
Under the Server section, specify the NTP server IP address or hostname.
Create the file /etc/apt/sources.list.d/cumulus-host-ubuntu-bionic.list and add the following line:
root@ubuntu:~# vi /etc/apt/sources.list.d/cumulus-apps-deb-bionic.list
...
deb [arch=amd64] https://apps3.cumulusnetworks.com/repos/deb bionic netq-latest
...
The use of netq-latest in these examples means that a get to the repository always retrieves the latest version of NetQ, even for a major version update. If you want to keep the repository on a specific version — such as netq-4.1 — use that instead.
Install NetQ CLI
A simple process installs the NetQ CLI on a switch or host.
To install the NetQ CLI you need to install netq-apps on each switch. This is available from the NVIDIA networking repository.
If your network uses a proxy server for external connections, you should first
configure a global proxy so apt-get can access the software package in the NVIDIA networking repository.
To obtain the NetQ Agent package:
Edit the /etc/apt/sources.list file to add the repository for NetQ.
Note that NetQ has a separate repository from Cumulus Linux.
cumulus@switch:~$ sudo nano /etc/apt/sources.list
...
deb https://apps3.cumulusnetworks.com/repos/deb CumulusLinux-3 netq-4.1
...
You can use the deb https://apps3.cumulusnetworks.com/repos/deb CumulusLinux-4 netq-latest repository if you want to always retrieve the latest posted version of NetQ.
Cumulus Linux 4.4 and above includes the netq-apps package by default.
To add the repository, uncomment or add the following line in /etc/apt/sources.list:
cumulus@switch:~$ sudo nano /etc/apt/sources.list
...
deb https://apps3.cumulusnetworks.com/repos/deb CumulusLinux-4 netq-4.1
...
You can use the deb https://apps3.cumulusnetworks.com/repos/deb CumulusLinux-4 netq-latest repository if you want to always retrieve the latest posted version of NetQ.
Update the local apt repository and install the software on the switch.
Continue with NetQ CLI configuration in the next section.
To install the NetQ CLI you need to install netq-apps on each switch. This is available from the NVIDIA networking repository.
If your network uses a proxy server for external connections, you should first
configure a global proxy so apt-get can access the software package in the NVIDIA networking repository.
To obtain the NetQ Agent package:
Edit the /etc/apt/sources.list file to add the repository for NetQ.
You should see version 4.1.0 and update 36 in the results. For example:
Continue with NetQ CLI configuration in the next section.
Configure the NetQ CLI
Two methods are available for configuring the NetQ CLI:
Run NetQ CLI commands on the switch
Edit the configuration file on the switchtext=“Configure CLI Using File”>}}
By default, you do not configure the NetQ CLI during the NetQ installation. The configuration resides in the /etc/netq/netq.yml file.
While the CLI is not configured, you can run only netq config commands and netq help commands, and you must use sudo to run them.
At minimum, you need to configure the NetQ CLI and NetQ Agent to communicate with the telemetry server. To do so, configure the NetQ Agent and the NetQ CLI so that they are running in the VRF where the routing tables have connectivity to the telemetry server. Typically this is the management VRF.
To configure the NetQ CLI, run the following command, then restart the NetQ CLI. This example assumes the telemetry server is reachable via the IP address 10.0.1.1 over port 32000 and the management VRF (mgmt).
sudo netq config add cli server 10.0.1.1 vrf mgmt port 32000
sudo netq config restart cli
Restarting the CLI stops the current running instance of netqd and starts netqd in the specified VRF.
The steps to configure the CLI are different depending on whether you installed the NetQ software for an on-premises or cloud deployment. Follow the instructions for your deployment type.
To access and configure the CLI for your on-premise NetQ deployment, you must have your username and password to access the NetQ UI to generate AuthKeys. These keys provide authorized access (access key) and user authentication (secret key).
To generate AuthKeys:
In your Internet browser, enter your on-premise NetQ appliance hostnme or IP address into the address field to open the NetQ UI login page.
Enter your username and password.
Click (Main Menu), select Management under Admin.
Click Manage on the User Accounts card.
Select your user and click above the table.
Copy these keys to a safe place.
The secret key is only shown once. If you do not copy these, you will need to regenerate them and reconfigure CLI access.
You can also save these keys to a YAML file for easy reference, and to avoid having to type or copy the key values. You can:
store the file wherever you like, for example in /home/cumulus/ or /etc/netq
name the file whatever you like, for example credentials.yml, creds.yml, or keys.yml
Restart the CLI afterward to activate the configuration.
This example uses the individual access key, a premises of datacenterwest, and the default Cloud address, port and VRF. Be sure to replace the key values with your generated keys if you are using this example on your server.
This example uses an optional keys file. Be sure to replace the keys filename and path with the full path and name of your keys file, and the datacenterwest premises name with your premises name if you are using this example on your server.
If you have multiple premises and want to query data from a different premises than you originally configured, rerun the netq config add cli server command with the desired premises name. You can only view the data for one premises at a time with the CLI.
To access and configure the CLI on your NetQ Cloud Appliance or VM, you must have your username and password to access the NetQ UI to generate AuthKeys. These keys provide authorized access (access key) and user authentication (secret key). Your credentials and NetQ Cloud addresses were obtained during first login to the NetQ Cloud and premise activation.
To generate AuthKeys:
In your Internet browser, enter netq.cumulusnetworks.com into the address field to open the NetQ UI login page.
Enter your username and password.
Click (Main Menu), select Management under Admin.
Click Manage on the User Accounts card.
Select your user and click above the table.
Copy these keys to a safe place.
The secret key is only shown once. If you do not copy these, you will need to regenerate them and reconfigure CLI access.
You can also save these keys to a YAML file for easy reference, and to avoid having to type or copy the key values. You can:
store the file wherever you like, for example in /home/cumulus/ or /etc/netq
name the file whatever you like, for example credentials.yml, creds.yml, or keys.yml
Restart the CLI afterward to activate the configuration.
This example uses the individual access key, a premises of datacenterwest, and the default Cloud address, port and VRF. Be sure to replace the key values with your generated keys if you are using this example on your server.
sudo netq config add cli server api.netq.cumulusnetworks.com access-key 123452d9bc2850a1726f55534279dd3c8b3ec55e8b25144d4739dfddabe8149e secret-key /vAGywae2E4xVZg8F+HtS6h6yHliZbBP6HXU3J98765= premises datacenterwest
Successfully logged into NetQ cloud at api.netq.cumulusnetworks.com:443
Updated cli server api.netq.cumulusnetworks.com vrf default port 443. Please restart netqd (netq config restart cli)

sudo netq config restart cli
Restarting NetQ CLI... Success!
This example uses an optional keys file. Be sure to replace the keys filename and path with the full path and name of your keys file, and the datacenterwest premises name with your premises name if you are using this example on your server.
sudo netq config add cli server api.netq.cumulusnetworks.com cli-keys-file /home/netq/nq-cld-creds.yml premises datacenterwest
Successfully logged into NetQ cloud at api.netq.cumulusnetworks.com:443
Updated cli server api.netq.cumulusnetworks.com vrf default port 443. Please restart netqd (netq config restart cli)

sudo netq config restart cli
Restarting NetQ CLI... Success!
If you have multiple premises and want to query data from a different premises than you originally configured, rerun the netq config add cli server command with the desired premises name. You can only view the data for one premises at a time with the CLI.
Configure NetQ CLI Using Configuration File
You can configure the NetQ CLI in the netq.yml configuration file contained in the /etc/netq/ directory.
Open the netq.yml file using your text editor of choice. For example:
sudo nano /etc/netq/netq.yml
Locate the netq-cli section, or add it.
Set the parameters for the CLI.
Specify the following parameters:
netq-user: User who can access the CLI
server: IP address of the NetQ server or NetQ Appliance
port (default): 32708
Your YAML configuration file should be similar to this:
This topic describes how to configure deployment options that you can perform only after you finish installing or upgrading NetQ.
Install a Custom Signed Certificate
The NetQ UI ships with a self-signed certificate that is sufficient for non-production environments or cloud deployments. For on-premises deployments, however, you receive a warning from your browser that this default certificate is not trusted when you first log in to the NetQ UI. You can avoid this by installing your own signed certificate.
You need the following items to perform the certificate installation:
A valid X509 certificate.
A private key file for the certificate.
A DNS record name configured to access the NetQ UI.
The FQDN should match the common name of the certificate. If you use a wild card in the common name — for example, if the common name of the certificate is *.example.com — then the NetQ telemetry server should reside on a subdomain of that domain, accessible via a URL like netq.example.com.
NetQ is running.
You can verify this by running the netq show opta-health command.
You can install a certificate using the Admin UI or the NetQ CLI.
Enter https://<hostname-or-ipaddr-of-netq-appliance-or-vm>:8443 in your browser address bar to open the Admin UI.
From the Health page, click Settings.
Click Edit.
Enter the hostname, certificate and certificate key in the relevant fields.
Click Lock.
Log in to the NetQ On-premises Appliance or VM via SSH and copy your certificate and key file there.
Generate a Kubernetes secret called netq-gui-ingress-tls.
cumulus@netq-ts:~$ kubectl create secret tls netq-gui-ingress-tls \
    --namespace default \
    --key <name of your key file>.key \
    --cert <name of your cert file>.crt
Verify that you created the secret successfully.
cumulus@netq-ts:~$ kubectl get secret

NAME                               TYPE                                  DATA   AGE
netq-gui-ingress-tls               kubernetes.io/tls                     2      5s
Update the ingress rule file to install self-signed certificates.
A message like the one here appears if your ingress rule is successfully configured.
Your custom certificate should now be working. Verify this by opening the NetQ UI at https://<your-hostname-or-ipaddr> in your browser.
Update Your Cloud Activation Key
You use the cloud activation key (called the config-key) to access the cloud services, not the authorization keys you use for configuring the CLI. NVIDIA provides the key when you set up your premises.
On occasion, you might want to update your cloud service activation key. For example, if you mistyped the key during installation and now your existing key does not work, or you received a new key for your premises from NVIDIA.
Update the activation key using the Admin UI or NetQ CLI:
Open the Admin UI by entering https://<master-hostname-or-ipaddress>:8443 in your browser address field.
Click Settings.
Click Activation.
Click Edit.
Enter your new configuration key in the designated entry field.
Click Apply.
Run the following command on your standalone or master NetQ Cloud Appliance or VM replacing text-opta-key with your new key.
Installation of NetQ with a server cluster sets up the master and two worker nodes. To expand your cluster to include up to a total of 10 nodes, use the Admin UI.
To add more worker nodes:
Prepare the nodes. Refer to the relevant server cluster instructions in Install the NetQ System.
Open the Admin UI by entering https://<master-hostname-or-ipaddress>:8443 in your browser address field.
This opens the Health dashboard for NetQ.
Click Cluster to view your current configuration.
On-premises deployment
This opens the Cluster dashboard, with the details about each node in the cluster.
Click Add Worker Node.
Enter the private IP address of the node you want to add.
Click Add.
Monitor the progress of the three jobs by clicking next to the jobs.
On completion, a card for the new node is added to the Cluster dashboard.
If the addition fails for any reason, download the log file by clicking , run netq bootstrap reset on this new worker node, and then try again.
Repeat this process to add more worker nodes as needed.
Add More Nodes Using the CLI
You can add additional nodes to your server cluster on-premise and cloud deployments using the CLI:
Run the following CLI command to add a new worker node for on-premise deployments:
netq install cluster add-worker <text-worker-01>
Run the following CLI command to add a new worker node for cloud deployments:
This topic describes how to upgrade from your current NetQ 2.4.1-3.3.1 installation to the NetQ 4.1 release to take advantage of new capabilities and bug fixes (refer to the release notes).
You must upgrade your NetQ On-premises or Cloud Appliances or virtual machines (VMs). While NetQ 2.x Agents are compatible with NetQ 3.x, upgrading NetQ Agents is always recommended. If you want access to new and updated commands, you can upgrade the CLI on your physical servers or VMs, and monitored switches and hosts as well.
To complete the upgrade for either an on-premises or a cloud deployment:
The first step in upgrading your NetQ installation to NetQ 4.1 is to upgrade your NetQ appliances or VMs. This topic describes how to upgrade this for both on-premises and remote deployments.
Prepare for Upgrade
You must complete the following three important steps to prepare to upgrade your NetQ Platform:
Download the necessary software tarballs
Update the Debian packages on physical server and VMs
For Cloud VM deployments, increase the root volume disk image size
Optionally, you can choose to back up your NetQ Data before performing the upgrade.
To complete the preparation:
For on-premises deployments only, optionally back up your NetQ data. Refer to Back Up and Restore NetQ.
If you are upgrading NetQ Platform software for a NetQ On-premises Appliance or VM, select NetQ SW 4.1 Appliance to download the NetQ-4.1.0.tgz file. If you are upgrading NetQ software for a NetQ Cloud Appliance or VM, select NetQ SW 4.1 Appliance Cloud to download the NetQ-4.1.0-opta.tgz file.
If prompted, agree to the license agreement and proceed with the download.
For enterprise customers, if you do not see a link to the NVIDIA Licensing Portal on the NVIDIA Application Hub, contact NVIDIA support.
cumulus@<hostname>:~$ sudo apt-get install -y netq-agent netq-apps
Reading package lists... Done
Building dependency tree
Reading state information... Done
...
The following NEW packages will be installed:
netq-agent netq-apps
...
Fetched 39.8 MB in 3s (13.5 MB/s)
...
Unpacking netq-agent (4.1.0-ub18.04u33~1621860085.c5a5d7e) ...
...
Unpacking netq-apps (4.1.0-ub18.04u33~1621860085.c5a5d7e) ...
Setting up netq-apps (4.1.0-ub18.04u33~1621860085.c5a5d7e) ...
Setting up netq-agent (4.1.0-ub18.04u33~1621860085.c5a5d7e) ...
Processing triggers for rsyslog (8.32.0-1ubuntu4) ...
Processing triggers for man-db (2.8.3-2ubuntu0.1) ...
If upgrading from version 3.1.0 or earlier
If you are upgrading NetQ as a VM in the cloud from version 3.1.0 or earlier, you must increase the root volume disk image size for proper operation of the lifecycle management feature.
Check the size of the existing disk in the VM to confirm it is 32 GB. In this example, the number of 1 MB blocks is 31583, or 32 GB.
cumulus@netq-310-cloud:~$ df -hm /
Filesystem     1M-blocks  Used Available Use% Mounted on
/dev/sda1          31583  4771     26797  16% /
Shutdown the VM.
Shutting down VMware VM using Shut down button in ESX
After the VM is shutdown (Shut down button is grayed out), click Edit.
In the Edit settings > Virtual Hardware > Hard disk field, change the 32 to 64 on the server hosting the VM.
Click Save.
Start the VM, log back in.
From step 1 we know the name of the root disk is /dev/sda1. Use that to run the following commands on the partition.
cumulus@netq-310-cloud:~$ sudo growpart /dev/sda 1
CHANGED: partition=1 start=227328 old: size=66881503 end=67108831 new: size=133990367,end=134217695

cumulus@netq-310-cloud:~$ sudo resize2fs /dev/sda1
resize2fs 1.44.1 (24-Mar-2018)
Filesystem at /dev/sda1 is mounted on /; on-line resizing required
old_desc_blocks = 4, new_desc_blocks = 8
The filesystem on /dev/sda1 is now 16748795 (4k) blocks long.
Verify the disk is now configured with 64 GB. In this example, the number of 1 MB blocks is now 63341, or 64 GB.
cumulus@netq-310-cloud:~$ df -hm /
Filesystem     1M-blocks  Used Available Use% Mounted on
/dev/sda1          63341  4772     58554   8% /
Check the size of the existing hard disk in the VM to confirm it is 32 GB. In this example, the number of 1 MB blocks is 31583, or 32 GB.
cumulus@netq-310-cloud:~$ df -hm /
Filesystem     1M-blocks  Used Available Use% Mounted on
/dev/vda1          31583  1192     30375   4% /
Shutdown the VM.
Check the size of the existing disk on the server hosting the VM to confirm it is 32 GB. In this example, the size appears in the virtual size field.
root@server:/var/lib/libvirt/images# qemu-img info netq-3.1.0-ubuntu-18.04-tscloud-qemu.qcow2
image: netq-3.1.0-ubuntu-18.04-tscloud-qemu.qcow2
file format: qcow2
virtual size: 32G (34359738368 bytes)
disk size: 1.3G
cluster_size: 65536
Format specific information:
    compat: 1.1
    lazy refcounts: false
    refcount bits: 16
    corrupt: false
root@server:/var/lib/libvirt/images# qemu-img info netq-3.1.0-ubuntu-18.04-tscloud-qemu.qcow2
image: netq-3.1.0-ubuntu-18.04-tscloud-qemu.qcow2
file format: qcow2
virtual size: 64G (68719476736 bytes)
disk size: 1.3G
cluster_size: 65536
Format specific information:
    compat: 1.1
    lazy refcounts: false
    refcount bits: 16
    corrupt: false
Start the VM and log back in.
From step 1 you know the name of the root disk is /dev/vda 1. Use that to run the following commands on the partition.
cumulus@netq-310-cloud:~$ sudo growpart /dev/vda 1
CHANGED: partition=1 start=227328 old: size=66881503 end=67108831 new: size=133990367,end=134217695

cumulus@netq-310-cloud:~$ sudo resize2fs /dev/vda1
resize2fs 1.44.1 (24-Mar-2018)
Filesystem at /dev/vda1 is mounted on /; on-line resizing required
old_desc_blocks = 4, new_desc_blocks = 8
The filesystem on /dev/vda1 is now 16748795 (4k) blocks long.
Verify the disk is now configured with 64 GB. In this example, the number of 1 MB blocks is now 63341, or 64 GB.
cumulus@netq-310-cloud:~$ df -hm /
Filesystem     1M-blocks  Used Available Use% Mounted on
/dev/vda1          63341  1193     62132   2% /
You can now upgrade your appliance using the NetQ Admin UI, in the next section. Alternately, you can upgrade using the CLI here: Upgrade Your Platform Using the NetQ CLI.
Run the Upgrade
Verify the following items before upgrading NetQ. For cluster deployments, verify steps 1 and 3 on all nodes in the cluster:
Check if enough disk space is available before you proceed with the upgrade:
cumulus@netq-appliance:~$ df -h /
Filesystem      Size  Used Avail Use% Mounted on
/dev/sda1       248G   70G  179G  28% /
cumulus@netq-appliance:~$
The recommended Use% to proceed with installation is under 70%.
You can delete previous software tarballs in the /mnt/installables/ directory to regain some space.
If you can not bring disk space to under 70% usage, contact the NVIDIA support team.
Run the netq show opta-health command and check that all pods are in the READY state. If not, contact the NVIDIA support team.
If you are upgrading from NetQ 4.0.1 or previous verisons, check if the certificates have expired:
If you are upgrading from NetQ 3.1.1 or later, after completing the preparation steps, upgrading your NetQ On-premises or Cloud Appliances or VMs is simple using the Admin UI.
To upgrade your NetQ software:
Run the bootstrap CLI to upgrade the Admin UI application.
Open the Admin UI by entering http://<hostname-or-ipaddress>:8443 in your browser address field.
Enter your NetQ credentials to enter the application.
The default username is admin and the default password in admin.
On-premises deployment
Remote (cloud) deployment
Click Upgrade in the upper right corner.
Enter NetQ-4.1.0.tgz or NetQ-4.1.0-opta.tgz and click .
The is only visible after you enter your tar file information.
Monitor the progress. Click to monitor each step in the jobs.
The following example is for an on-premises upgrade. The jobs for a cloud upgrade are slightly different.
When it completes, click to be returned to the Health dashboard.
Upgrade NetQ Agents
NVIDIA strongly recommends that you upgrade your NetQ Agents when you install or upgrade to a new release. If you are using NetQ Agent 2.4.0 update 24 or earlier, you must upgrade to ensure proper operation.
The following instructions apply to both Cumulus Linux 3.x and 4.x, and for both on-premises and remote deployments.
You should see version 4.1.0 and update 36 in the results. For example:
root@rhel7:~# rpm -q -netq-agent
You should see version 4.1.0 and update 36 in the results. For example:
If you see an older version, upgrade the NetQ Agent, as described above.
Upgrade NetQ CLI
While it is not required to upgrade the NetQ CLI on your monitored switches and hosts when you upgrade to NetQ 4.1, doing so gives you access to new features and important bug fixes. Refer to the release notes for details.
You should back up your NetQ data according to your company policy. Typically this includes after key configuration changes and on a scheduled basis.
These topics describe how to back up and also restore your NetQ data for the NetQ On-premises Appliance and VMs.
These procedures do not apply to your NetQ Cloud Appliance or VM. The NetQ cloud service handles data backups automatically.
Back Up Your NetQ Data
NetQ stores its data in a Cassandra database. You perform backups by running scripts provided with the software and located in the /usr/sbin directory. When you run a backup, it creates a single tar file named netq_master_snapshot_<timestamp>.tar.gz on a local drive that you specify. NetQ supports only one backup file currently, and includes the entire set of data tables. A new backuup replaces the previous backup.
If you select the rollback option during the lifecycle management upgrade process (the default behavior), LCM automatically creates a backup.
To manually create a backup:
Run the backup script to create a backup file in /opt/<backup-directory> being sure to replace the backup-directory option with the name of the directory you want to use for the backup file.
You can abbreviate the backup and localdir options of this command to -b and -l to reduce typing. If the backup directory identified does not already exist, the script creates the directory during the backup process.
This is a sample of what you see as the script is running:
[Fri 26 Jul 2019 02:35:35 PM UTC] - Received Inputs for backup ...
[Fri 26 Jul 2019 02:35:36 PM UTC] - Able to find cassandra pod: cassandra-0
[Fri 26 Jul 2019 02:35:36 PM UTC] - Continuing with the procedure ...
[Fri 26 Jul 2019 02:35:36 PM UTC] - Removing the stale backup directory from cassandra pod...
[Fri 26 Jul 2019 02:35:36 PM UTC] - Able to successfully cleanup up /opt/backuprestore from cassandra pod ...
[Fri 26 Jul 2019 02:35:36 PM UTC] - Copying the backup script to cassandra pod ....
/opt/backuprestore/createbackup.sh: line 1: cript: command not found
[Fri 26 Jul 2019 02:35:48 PM UTC] - Able to exeute /opt/backuprestore/createbackup.sh script on cassandra pod
[Fri 26 Jul 2019 02:35:48 PM UTC] - Creating local directory:/tmp/backuprestore/ ...
Directory /tmp/backuprestore/ already exists..cleaning up
[Fri 26 Jul 2019 02:35:48 PM UTC] - Able to copy backup from cassandra pod  to local directory:/tmp/backuprestore/ ...
[Fri 26 Jul 2019 02:35:48 PM UTC] - Validate the presence of backup file in directory:/tmp/backuprestore/
[Fri 26 Jul 2019 02:35:48 PM UTC] - Able to find backup file:netq_master_snapshot_2019-07-26_14_35_37_UTC.tar.gz
[Fri 26 Jul 2019 02:35:48 PM UTC] - Backup finished successfully!
Verify the backup file creation was successful.
cumulus@switch:~$ cd /opt/<backup-directory>
cumulus@switch:~/opt/<backup-directory># ls
netq_master_snapshot_2019-06-04_07_24_50_UTC.tar.gz
To create a scheduled backup, add ./backuprestore.sh --backup --localdir /opt/<backup-directory> to an existing cron job, or create a new one.
Restore Your NetQ Data
You can restore NetQ data using the backup file you created above in Back Up Your NetQ Data. You can restore your instance to the same NetQ Platform or NetQ Appliance or to a new platform or appliance. You do not need to stop the server where the backup file resides to perform the restoration, but logins to the NetQ UI fail during the restoration process. The restore option of the backup script, copies the data from the backup file to the database, decompresses it, verifies the restoration, and starts all necessary services. You should not see any data loss as a result of a restore operation.
To restore NetQ on the same hardware where the backup file resides:
Run the restore script being sure to replace the backup-directory option with the name of the directory where the backup file resides.
You can abbreviate the restore and localdir options of this command to -r and -l to reduce typing.
This is a sample of what you see while the script is running:
[Fri 26 Jul 2019 02:37:49 PM UTC] - Received Inputs for restore ...
WARNING: Restore procedure wipes out the existing contents of Database.
   Once the Database is restored you loose the old data and cannot be recovered.
"Do you like to continue with Database restore:[Y(yes)/N(no)]. (Default:N)"
You must answer the above question to continue the restoration. After entering Y or yes, the output continues as follows:
[Fri 26 Jul 2019 02:37:50 PM UTC] - Able to find cassandra pod: cassandra-0
[Fri 26 Jul 2019 02:37:50 PM UTC] - Continuing with the procedure ...
[Fri 26 Jul 2019 02:37:50 PM UTC] - Backup local directory:/tmp/backuprestore/ exists....
[Fri 26 Jul 2019 02:37:50 PM UTC] - Removing any stale restore directories ...
Copying the file for restore to cassandra pod ....
[Fri 26 Jul 2019 02:37:50 PM UTC] - Able to copy the local directory contents to cassandra pod in /tmp/backuprestore/.
[Fri 26 Jul 2019 02:37:50 PM UTC] - copying the script to cassandra pod in dir:/tmp/backuprestore/....
Executing the Script for restoring the backup ...
/tmp/backuprestore//createbackup.sh: line 1: cript: command not found
[Fri 26 Jul 2019 02:40:12 PM UTC] - Able to exeute /tmp/backuprestore//createbackup.sh script on cassandra pod
[Fri 26 Jul 2019 02:40:12 PM UTC] - Restore finished successfully!
To restore NetQ on new hardware:
Copy the backup file from /opt/<backup-directory> on the older hardware to the backup directory on the new hardware.
Run the restore script on the new hardware, being sure to replace the backup-directory option with the name of the directory where the backup file resides.
After you have completed the installation of NetQ,
you might want to configure some of the additional capabilities that NetQ
offers or integrate it with third-party software or hardware.
This topic describes how to:
Integrate with your LDAP server to use existing user accounts in NetQ
Integrate with Grafana to view interface statistics graphically
Integrate NetQ with Your LDAP Server
With this release and an administrator role, you can integrate the NetQ role-based access control (RBAC) with your lightweight directory access protocol (LDAP) server in on-premises deployments. NetQ maintains control over role-based permissions for the NetQ application. Currently there are two roles, admin and user. With the RBAC integration, LDAP handles user authentication and your directory service, such as Microsoft Active Directory, Kerberos, OpenLDAP, and Red Hat Directory Service. A copy of each user from LDAP is stored in the local NetQ database.
Integrating with an LDAP server does not prevent you from configuring local users (stored and managed in the NetQ database) as well.
Read Get Started to become familiar with LDAP configuration parameters, or skip to Create an LDAP Configuration if you are already an LDAP expert.
Get Started
LDAP integration requires information about how to connect to your LDAP server, the type of authentication you plan to use, bind credentials, and, optionally, search attributes.
Provide Your LDAP Server Information
To connect to your LDAP server, you need the URI and bind credentials. The URI identifies the location of the LDAP server. It comprises a FQDN (fully qualified domain name) or IP address, and the port of the LDAP server where the LDAP client can connect. For example: myldap.mycompany.com or 192.168.10.2. Typically you use port 389 for connection over TCP or UDP. In production environments, you deploy a secure connection with SSL. In this case, the port used is typically 636. Setting the Enable SSL toggle automatically sets the server port to 636.
Specify Your Authentication Method
Two methods of user authentication are available: anonymous and basic.
Anonymous: LDAP client does not require any authentication. The user can access all resources anonymously. This is not commonly used for production environments.
Basic: (Also called Simple) LDAP client must provide a bind DN and password to authenticate the connection. When selected, the Admin credentials appear: Bind DN and Bind Password. You define the distinguished name (DN) using a string of variables. Some common variables include:
Syntax
Description or Usage
cn
Common name
ou
Organizational unit or group
dc
Domain name
dc
Domain extension
Bind DN: DN of user with administrator access to query the LDAP server; used for binding with the server. For example, uid =admin,ou=ntwkops,dc=mycompany,dc=com.
Bind Password: Password associated with Bind DN.
The Bind DN and password get sent as clear text. Only users with these credentials can perform LDAP operations.
If you are unfamiliar with the configuration of your LDAP server, contact your administrator to ensure you select the appropriate authentication method and credentials.
Define User Attributes
You need the following two attributes to define a user entry in a directory:
Base DN: Location in directory structure where search begins. For example, dc=mycompany,dc=com.
User ID: Type of identifier used to specify an LDAP user. This can vary depending on the authentication service you are using. For example, you can use the user ID (UID) or email address with OpenLDAP, whereas you might use the sAMAccountName with Active Directory.
Optionally, you can specify the first name, last name, and email address of the user.
Set Search Attributes
While optional, specifying search scope indicates where to start and how deep a given user can search within the directory. You specify the data to search for in the search query.
Search scope options include:
Subtree: Search for users from base, subordinates at any depth (default)
Base: Search for users at the base level only; no subordinates
One Level: Search for immediate children of user; not at base or for any descendants
Subordinate: Search for subordinates at any depth of user; but not at base
A typical search query for users could be {userIdAttribute}={userId}.
Now that you are familiar with the various LDAP configuration parameters, you can configure the integration of your LDAP server with NetQ using the instructions in the next section.
Create an LDAP Configuration
You can configure one LDAP server per bind DN (distinguished name). After you configure LDAP, you can validate the connectivity (and configuration) and save the configuration.
To create an LDAP configuration:
Click , then select Management under Admin.
Locate the LDAP Server Info card, and click Configure LDAP.
Fill out the LDAP Server Configuration form according to your particular configuration. Refer to Overview for details about the various parameters.
Note: Items with an asterisk (*) are required. All others are optional.
Click Save to complete the configuration, or click Cancel to discard the configuration.
LDAP config cannot be changed once configured. If you need to change the configuration, you must delete the current LDAP configuration and create a new one. Note that if you change the LDAP server configuration, all users created against that LDAP server remain in the NetQ database and continue to be visible, but are no longer viable. You must manually delete those users if you do not want to see them.
Example LDAP Configurations
A variety of example configurations are provided here. Scenarios 1-3 are based on using an OpenLDAP or similar authentication service. Scenario 4 is based on using the Active Directory service for authentication.
Scenario 1: Base Configuration
In this scenario, we are configuring the LDAP server with anonymous authentication, a User ID based on an email address, and a search scope of base.
Parameter
Value
Host Server URL
ldap1.mycompany.com
Host Server Port
389
Authentication
Anonymous
Base DN
dc=mycompany,dc=com
User ID
email
Search Scope
Base
Search Query
{userIdAttribute}={userId}
Scenario 2: Basic Authentication and Subset of Users
In this scenario, we are configuring the LDAP server with basic authentication, for access only by the persons in the network operators group, and a limited search scope.
Parameter
Value
Host Server URL
ldap1.mycompany.com
Host Server Port
389
Authentication
Basic
Admin Bind DN
uid =admin,ou=netops,dc=mycompany,dc=com
Admin Bind Password
nqldap!
Base DN
dc=mycompany,dc=com
User ID
UID
Search Scope
One Level
Search Query
{userIdAttribute}={userId}
Scenario 3: Scenario 2 with Widest Search Capability
In this scenario, we are configuring the LDAP server with basic authentication, for access only by the persons in the network administrators group, and an unlimited search scope.
Parameter
Value
Host Server URL
192.168.10.2
Host Server Port
389
Authentication
Basic
Admin Bind DN
uid =admin,ou=netadmin,dc=mycompany,dc=com
Admin Bind Password
1dap*netq
Base DN
dc=mycompany, dc=net
User ID
UID
Search Scope
Subtree
Search Query
userIdAttribute}={userId}
Scenario 4: Scenario 3 with Active Directory Service
In this scenario, we are configuring the LDAP server with basic authentication, for access only by the persons in the given Active Directory group, and an unlimited search scope.
Parameter
Value
Host Server URL
192.168.10.2
Host Server Port
389
Authentication
Basic
Admin Bind DN
cn=netq,ou=45,dc=mycompany,dc=com
Admin Bind Password
nq&4mAd!
Base DN
dc=mycompany, dc=net
User ID
sAMAccountName
Search Scope
Subtree
Search Query
{userIdAttribute}={userId}
Add LDAP Users to NetQ
Click , then select Management under Admin.
Locate the User Accounts card, and click Manage.
On the User Accounts tab, click Add User.
Select LDAP User.
Enter the user’s ID.
Enter your administrator password.
Click Search.
If the user is found, the email address, first and last name fields are automatically filled in on the Add New User form. If searching is not enabled on the LDAP server, you must enter the information manually.
If the fields are not automatically filled in, and searching is enabled on the LDAP server, you might require changes to the mapping file.
Select the NetQ user role for this user, admin or user, in the User Type dropdown.
Enter your admin password, and click Save, or click Cancel to discard the user account.
LDAP user passwords are not stored in the NetQ database and are always authenticated against LDAP.
Repeat these steps to add additional LDAP users.
Remove LDAP Users from NetQ
You can remove LDAP users in the same manner as local users.
Click , then select Management under Admin.
Locate the User Accounts card, and click Manage.
Select the user or users you want to remove.
Click in the Edit menu.
If you delete an LDAP user in LDAP it is not automatically deleted from NetQ; however, the login credentials for these LDAP users stop working immediately.
Integrate NetQ with Grafana
Switches collect statistics about the performance of their interfaces. The NetQ Agent on each switch collects these statistics every 15 seconds and then sends them to your NetQ Appliance or Virtual Machine.
NetQ collects statistics for physical interfaces; it does not collect statistics for virtual interfaces, such as bonds, bridges, and VXLANs.
NetQ displays:
Transmit with tx_ prefix: bytes, carrier, colls, drop, errs, packets
Receive with rx_ prefix: bytes, drop, errs, frame, multicast, packets
You can use Grafana version 6.x or 7.x, an open source analytics and monitoring tool, to view these statistics. The fastest way to achieve this is by installing Grafana on an application server or locally per user, and then installing the NetQ plugin.
If you do not have Grafana installed already, refer to grafana.com for instructions on installing and configuring the Grafana tool.
Install NetQ Plugin for Grafana
Use the Grafana CLI to install the NetQ plugin. For more detail about this command, refer to the Grafana CLI documentation.
The Grafana plugin comes unsigned. Before you can install it, you need to update the grafana.ini file then restart the Grafana service:
Edit /etc/grafana/grafana.ini and add allow_loading_unsigned_plugins = netq-dashboard to the file.
Cumulus in the Cloud (CITC): plugin.air.netq.cumulusnetworks.com
Select procdevstats from the Module dropdown.
Enter your credentials (the ones used to log in).
For NetQ cloud deployments only, if you have more than one premises configured, you can select the premises you want to view, as follows:
If you leave the Premises field blank, the first premises name is selected by default
If you enter a premises name, that premises is selected for viewing
Note: If multiple premises are configured with the same name, then the first premises of that name is selected for viewing
Click Save & Test.
Create Your NetQ Dashboard
With the data source configured, you can create a dashboard with the transmit and receive statistics of interest to you.
Create a Dashboard
Click to open a blank dashboard.
Click (Dashboard Settings) at the top of the dashboard.
Add Variables
Click Variables.
Enter hostname into the Name field.
Enter hostname into the Label field.
Select Net-Q from the Data source list.
Select On Dashboard Load from the Refresh list.
Enter hostname into the Query field.
Click Add.
You should see a preview at the bottom of the hostname values.
Click Variables to add another variable for the interface name.
Enter ifname into the Name field.
Enter ifname into the Label field.
Select Net-Q from the Data source list.
Select On Dashboard Load from the Refresh list.
Enter ifname into the Query field.
Click Add.
You should see a preview at the bottom of the ifname values.
Click Variables to add another variable for metrics.
Enter metrics into the Name field.
Enter metrics into the Label field.
Select Net-Q from the Data source list.
Select On Dashboard Load from the Refresh list.
Enter metrics into the Query field.
Click Add.
You should see a preview at the bottom of the metrics values.
Add Charts
Now that the variables are defined, click to return to the new dashboard.
Click Add Query.
Select Net-Q from the Query source list.
Select the interface statistic you want to view from the Metric list.
Click the General icon.
Select hostname from the Repeat list.
Set any other parameters around how to display the data.
Return to the dashboard.
Select one or more hostnames from the hostname list.
Select one or more interface names from the ifname list.
Select one or more metrics to display for these hostnames and interfaces from the metrics list.
This example shows a dashboard with two hostnames, two interfaces, and one metric selected. The more values you select from the variable options, the more charts appear on your dashboard.
Analyze the Data
Once you have your dashboard configured, you can start analyzing the data. Review the statistics, looking for peaks and valleys, unusual patterns, and so forth. Explore the data more by modifying the data view in one of several ways using the dashboard tool set:
Select a different time period for the data by clicking the forward or back arrows. The default time range is dependent on the width of your browser window.
Zoom in on the dashboard by clicking the magnifying glass.
Manually refresh the dashboard data, or set an automatic refresh rate for the dashboard from the down arrow.
Add additional panels
Click any chart title to edit or remove it from the dashboard
Rename the dashboard by clicking the cog wheel and entering the new name
Uninstall NetQ
You can remove the NetQ software from your system server and switches when necessary.
Remove the NetQ Agent and CLI
Use the apt-get purge command to remove the NetQ agent or CLI package from a Cumulus Linux switch or an Ubuntu host.
cumulus@switch:~$ sudo apt-get update
cumulus@switch:~$ sudo apt-get purge netq-agent netq-apps
Reading package lists... Done
Building dependency tree
Reading state information... Done
The following packages will be REMOVED:
  netq-agent* netq-apps*
0 upgraded, 0 newly installed, 2 to remove and 0 not upgraded.
After this operation, 310 MB disk space will be freed.
Do you want to continue? [Y/n] Y
Creating pre-apt snapshot... 2 done.
(Reading database ... 42026 files and directories currently installed.)
Removing netq-agent (3.0.0-cl3u27~1587646213.c5bc079) ...
/usr/sbin/policy-rc.d returned 101, not running 'stop netq-agent.service'
Purging configuration files for netq-agent (3.0.0-cl3u27~1587646213.c5bc079) ...
dpkg: warning: while removing netq-agent, directory '/etc/netq/config.d' not empty so not removed
Removing netq-apps (3.0.0-cl3u27~1587646213.c5bc079) ...
/usr/sbin/policy-rc.d returned 101, not running 'stop netqd.service'
Purging configuration files for netq-apps (3.0.0-cl3u27~1587646213.c5bc079) ...
dpkg: warning: while removing netq-apps, directory '/etc/netq' not empty so not removed
Processing triggers for man-db (2.7.0.2-5) ...
grep: extra.services.enabled: No such file or directory
Creating post-apt snapshot... 3 done.
If you only want to remove the agent or the CLI, but not both, specify just the relevant package in the apt-get purge command.
To verify the removal of the packages from the switch, run:
cumulus@switch:~$ dpkg-query -l netq-agent
dpkg-query: no packages found matching netq-agent
cumulus@switch:~$ dpkg-query -l netq-apps
dpkg-query: no packages found matching netq-apps
Use the yum remove command to remove the NetQ agent or CLI package from a RHEL7 or CentOS host.
Verify the removal of the packages from the switch.
cumulus@switch:~$ dpkg-query -l netq-agent
dpkg-query: no packages found matching netq-agent
cumulus@switch:~$ dpkg-query -l netq-apps
dpkg-query: no packages found matching netq-apps
Delete the virtual machine according to the usual VMware or KVM practice.
Delete a virtual machine from the host computer using one of the following methods:
Right-click the name of the virtual machine in the Favorites list, then select Delete from Disk
Select the virtual machine and choose VM > Delete from disk
Delete a virtual machine from the host computer using one of the following methods:
Run virsch undefine <vm-domain> --remove-all-storage
Run virsh undefine <vm-domain> --wipe-storage
Manage Configurations
A network has many configurations that you must manage. From initial configuration and provisioning of devices to events and notifications, administrators and operators are responsible for setting up and managing the configuration of the network. The topics in this section provide instructions for managing the NetQ UI, physical and software inventory, events and notifications, and for provisioning your devices and network.
As an administrator, you can manage access to and various application-wide settings for the NetQ UI from a single location.
Individual users have the ability to set preferences specific to their workspaces. You can read about that in Set User Preferences.
NetQ Management Workbench
You access the NetQ Management workbench from the main menu. For users responsible for maintaining the application, this is a good place to start each day.
To open the workbench, click , and select Management under Admin. The cards available vary slightly between the on-premises and cloud deployments. The on-premises management dashboard has an LDAP Server Info card, which the cloud version does not. The cloud management dashboard has an SSO Config card, which the on-premises version does not.
On-premises NetQ Management Dashboard
Cloud NetQ Management Dashboard
Manage User Accounts
From the NetQ Management workbench, you can view the number of users with accounts in the system. As an administrator, you can also add, modify, and delete user accounts using the User Accounts card.
Add New User Account
For each user that monitors at least one aspect of your data center
network, a user account is needed. Adding a local user is described here. Refer to Integrate NetQ with Your LDAP server for instructions for adding LDAP users.
To add a new user account:
Click Manage on the User Accounts card to open the User Accounts tab.
Click Add User.
Enter the user’s email address, along with their first and last name.
Be especially careful entering the email address as you cannot change it once you save the account. If you save a mistyped email address, you must delete the account and create a new one.
Select the user type: Admin or User.
Enter your password in the Admin Password field (only users with administrative permissions can add users).
Create a password for the user.
Enter a password for the user.
Re-enter the user password. If you do not enter a matching password, it will be underlined in red.
Click Save to create the user account, or Cancel to discard the user account.
By default the User Accounts table is sorted by Role.
Repeat these steps to add all of your users.
Edit a User Name
If a user’s first or last name was incorrectly entered, you can fix them easily.
To change a user name:
Click Manage on the User Accounts card to open the User Accounts tab.
Click the checkbox next to the account you want to edit.
Click above the account list.
Modify the first and/or last name as needed.
Enter your admin password.
Click Save to commit the changes or Cancel to discard them.
Change a User’s Password
Should a user forget his password or for security reasons, you can change a password for a particular user account.
To change a password:
Click Manage on the User Accounts card to open the User Accounts tab.
Click the checkbox next to the account you want to edit.
Click above the account list.
Click Reset Password.
Enter your admin password.
Enter a new password for the user.
Re-enter the user password. Tip: If the password you enter does not match, Save is gray (not activated).
Click Save to commit the change, or Cancel to discard the change.
Change a User’s Access Permissions
If a particular user has only standard user permissions and they need administrator permissions to perform their job (or the opposite, they have administrator permissions, but only need user permissions), you can modify their access rights.
To change access permissions:
Click Manage on the User Accounts card to open the User Accounts tab.
Click the checkbox next to the account you want to edit.
Click above the account list.
Select the appropriate user type from the dropdown list.
Enter your admin password.
Click Save to commit the change, or Cancel to discard the change.
Correct a Mistyped User ID (Email Address)
You cannot edit a user’s email address, because this is the identifier the system uses for authentication. If you need to change an email address, you must create a new one for this user. Refer to Add New User Account. You should delete the incorrect user account. Select the user account, and click .
Export a List of User Accounts
You can export user account information at any time using the User Accounts tab.
To export information for one or more user accounts:
Click Manage on the User Accounts card to open the User Accounts tab.
Select one or more accounts that you want to export by clicking the checkbox next to them. Alternately select all accounts by clicking .
Click to export the selected user accounts.
Delete a User Account
NetQ application administrators should remove user accounts associated with users that are no longer using the application.
To delete one or more user accounts:
Click Manage on the User Accounts card to open the User Accounts tab.
Select one or more accounts that you want to remove by clicking the checkbox next to them.
Click to remove the accounts.
Manage User Login Policies
NetQ application administrators can configure a session expiration time and the number of times users can refresh before requiring users to re-login to the NetQ application.
To configure these login policies:
Click (main menu), and select Management under the Admin column.
Locate the Login Management card.
Click Manage.
Select how long a user can be logged in before logging in again; 30 minutes, 1, 3, 5, 6, or 8 hours. Default for on-premises deployments is 6 hours. Default for cloud deployments is 30 minutes.
Indicate the amount of time in seconds the application can be refreshed before the user must log in again. Default is 1440 seconds (1 day).
Enter your admin password.
Click Update to save the changes, or click Cancel to discard them.
The Login Management card shows the configuration.
Monitor User Activity
NetQ application administrators can audit user activity in the application using the Activity Log.
To view the log, click (main menu), then click Activity Log under the Admin column.
Click to filter the log by username, action, resource, and time period.
Click to export the log a page at a time.
Manage Scheduled Traces
From the NetQ Management workbench, you can view the number of traces scheduled to run in the system. A set of default traces are provided with the NetQ GUI. As an administrator, you can run one or more scheduled traces, add new scheduled traces, and edit or delete existing traces.
Add a Scheduled Trace
You can create a scheduled trace to provide regular status about a particularly important connection between a pair of devices in your network or for temporary troubleshooting.
To add a trace:
Click Manage on the Scheduled Traces card to open the Scheduled Traces tab.
Click Add Trace to open the large New Trace Request card.
Enter source and destination addresses.
For layer 2 traces, the source must be a hostname and the destination must be a MAC address. For layer 3 traces, the source can be a hostname or IP address, and the destination must be an IP address.
Specify a VLAN for a layer 2 trace or (optionally) a VRF for a layer 3 trace.
Set the schedule for the trace, by selecting how often to run the trace and when to start it the first time.
Click Save As New to add the trace. You are prompted to enter a name for the trace in the Name field.
If you want to run the new trace right away for a baseline, select the trace you just added from the dropdown list, and click Run Now.
Delete a Scheduled Trace
If you do not want to run a given scheduled trace any longer, you can remove it.
To delete a scheduled trace:
Click Manage on the Scheduled Trace card to open the Scheduled Traces tab.
Select at least one trace by clicking on the checkbox next to the trace.
Click .
Export a Scheduled Trace
You can export a scheduled trace configuration at any time using the Scheduled Traces tab.
To export one or more scheduled trace configurations:
Click Manage on the Scheduled Trace card to open the Scheduled Traces tab.
Select one or more traces by clicking on the checkbox next to the trace. Alternately, click to select all traces.
Click to export the selected traces.
Manage Scheduled Validations
From the NetQ Management workbench, you can view the total number of validations scheduled to run in the system. A set of default scheduled validations are provided and pre-configured with the NetQ UI. These are not included in the total count. As an administrator, you can view and export the configurations for all scheduled validations, or add a new validation.
View Scheduled Validation Configurations
You can view the configuration of a scheduled validation at any time. This can be useful when you are trying to determine if the validation request needs to be modified to produce a slightly different set of results (editing or cloning) or if it would be best to create a new one.
To view the configurations:
Click Manage on the Scheduled Validations card to open the Scheduled Validations tab.
Click in the top right to return to your NetQ Management cards.
Add a Scheduled Validation
You can add a scheduled validation at any time using the Scheduled Validations tab.
To add a scheduled validation:
Click Manage on the Scheduled Validations card to open the Scheduled Validations tab.
Click Add Validation to open the large Validation Request card.
You can remove a scheduled validation that you created (one of the 15 allowed) at any time. You cannot remove the default scheduled validations included with NetQ.
To remove a scheduled validation:
Click Manage on the Scheduled Validations card to open the Scheduled Validations tab.
Select one or more validations that you want to delete.
Click above the validations list.
Export Scheduled Validation Configurations
You can export one or more scheduled validation configurations at any time using the Scheduled Validations tab.
To export a scheduled validation:
Click Manage on the Scheduled Validations card to open the Scheduled Validations tab.
Select one or more validations by clicking the checkbox next to the validation. Alternately, click to select all validations.
Click to export selected validations.
Manage Threshold Crossing Rules
NetQ supports a set of events that are triggered by crossing a user-defined threshold, called TCA events. These events allow detection and prevention of network failures for selected ACL resources, digital optics, forwarding resources, interface errors and statistics, link flaps, resource utilization, RoCE (RDMA over converged Ethernet), sensor and WJH events. A complete list of supported events can be found in the TCA Event Messages Reference.
NetQ supports Slack, PagerDuty, and syslog notification channels for reporting system and threshold-based events. You can access channel configuration in one of two ways:
Click Manage on the Channels card
Click , and then click Channels in the Notifications column
Managing premises involves renaming existing premises or creating multiple premises.
Configure Multiple Premises
The NetQ Management dashboard provides the ability to configure a single NetQ UI and CLI for monitoring data from multiple premises. This eliminates the need to log in to each premises to view the data.
There are two ways to implement a multi-site on-premises deployment.
Full NetQ deployment at each premises
NetQ appliance or VM running NetQ Platform software with a database
Each premises has its own NetQ UI and CLI and operates independently
The NetQ appliance or VM at one of the deployments acts as the primary premises for the premises in the other deployments (similar to a proxy)
A list of these secondary premises is stored with the primary deployment
Full NetQ deployment at primary site and smaller deployment at secondary sites
The NetQ appliance or VM at one of the deployments acts as the primary premises for the premises in the other deployments (similar to a proxy)
The primary premises runs the NetQ Platform software (including the NetQ UI and CLI) and houses the database
All other deployments are secondary premises; they run the NetQ Controller software and send their data to the primary premises for storage and processing
A list of these secondary premises is stored with the primary deployment
After the multiple premises are configured, you can view this list of premises in the NetQ UI at the primary premises, change the name of premises on the list, and delete premises from the list.
To configure secondary premises so that you can view their data using the primary site NetQ UI, follow the instructions for the relevant deployment type of the secondary premises.
In this deployment model, each NetQ deployment can be installed separately. The data is stored and can be viewed from the NetQ UI at each premises.
To configure a these premises so that their data can be viewed from one premises:
On the workbench, under Premises, click .
Click Manage Premises.
Click External Premises.
Click Add External Premises.
Enter the IP address for the API gateway on the NetQ appliance or VM for one of the secondary premises.
Enter the access credentials for this host.
Click Next.
Select the premises you want to connect.
Click Finish.
Add more secondary premises by clicking and repeating Steps 8-12.
In this deployment model, the data is stored and can be viewed only from the NetQ UI at the primary premises.
The primary NetQ premises must be installed before the secondary premises can be added. For the secondary premises, create the premises here, then install them.
On the workbench, under Premises, click .
Click Manage Premises. Your primary premises (OPID0) is shown by default.
Click (Add Premises).
Enter the name of one of the secondary premises you want to add.
Click Done.
Select the premises you just created.
Click to generate a configuration key.
Click Copy to save the key to a safe place, or click e-mail to send it to yourself or other administrator as appropriate.
Click Done.
Repeat steps 6-11 to add more secondary premises.
Follow the steps in the Admin UI to install and complete the configuration of these secondary premises, using these keys to activate and connect these premises to the primary NetQ premises.
Rename a Premises
To rename an existing premises:
On the workbench, under Premises, click , then click Manage Premises.
To rename an external premises, click External Premises.
On the right side of the screen, select a premises to rename, then click .
Enter the new name for the premises, then click Done.
System Server Information
You can easily view the configuration of the physical server or VM from the NetQ Management dashboard.
To view the server information:
Click .
Select Management from the Admin column.
Locate the System Server Info card.
If no data is present on this card, it is likely that the NetQ Agent on your server or VM is not running properly or the underlying streaming services are impaired.
Integrate with Your LDAP Server
For on-premises deployments you can integrate your LDAP server with NetQ to provide access to NetQ using LDAP user accounts instead of ,or in addition to, the NetQ user accounts. Refer to Integrate NetQ with Your LDAP Server for more detail.
Integrate with Your Microsoft Azure or Google Cloud for SSO
You can integrate your NetQ Cloud deployment with a Microsoft Azure Active Directory (AD) or Google Cloud authentication server to support single sign-on (SSO) to NetQ. NetQ supports integration with SAML (Security Assertion Markup Language) or OAuth (Open Authorization). Multi-factor authentication (MFA) is also supported. Only one SSO configuration can be configured at a time. You must enable the configuration for the configuration to take effect.
Configure Support
To integrate your authentication server:
Click .
Select Management from the Admin column.
Locate the SSO Config card.
Click Manage.
Click the type of SSO to be integrated:
Open ID: Choose this option to integrate using OAuth with OpenID Connect
SAML: Choose this option to integrate using SAML
Specify the required parameters.
You need several pieces of data from your Microsoft Azure or Google account and authentication server to complete the integration. Open your account for easy cut and paste of this data into the NetQ form.
Enter your administrator password. This is required when creating a new configuration.
Enter a unique name for the SSO configuration.
Copy the identifier for your Resource Server into the Client ID field.
Copy the secret key for your Resource Server into the Client Secret field.
Copy the URL of the authorization application into the Authorization Endpoint field.
Copy the URL of the authorization token into the Token Endpoint field.
This example shows a Microsoft Azure AD integration.
Click Test to verify you are sent to the right place and can login. If it is not working, you are logged out. Check your specification and retest the configuration until it is working properly.
Click Close. The SSO Config card reflects the configuration.
To require users to log in to NetQ using this SSO configuration, click change under the current Disabled status.
Enter your administrator password.
Click Submit to enable the configuration. The SSO card reflects this new status.
Enter your administrator password.
Enter a unique name for the SSO configuration.
Copy the URL for the authorization server login page into the Login URL field.
Copy the name of the authorization server into the Identity Provider Identifier field.
Copy the name of the application server into the Service Provider Identifier field.
Optionally, copy a claim into the Email Claim Key field. When left blank, the user email address is captured.
Click Test to verify you are sent to the right place and can login. If it is not working, you are logged out. Check your specification and retest the configuration until it is working properly.
Click Close. The SSO Config card reflects the configuration.
To require users to log in to NetQ using this SSO configuration, click change under the current Disabled status.
Enter your administrator password.
Click Submit to enable the configuration. The SSO card reflects this new status.
Modify Integrations
You can change the specifications for SSO integration with your authentication server at any time, including changing to an alternate SSO type, disabling the existing configuration, or reconfiguring the current configuration.
Change SSO Type
To choose a different SSO type:
Click .
Select Management from the Admin column.
Locate the SSO Config card.
Click Disable.
Click Yes.
Click Manage.
Select the desired SSO type and complete the form with the relevant data for that SSO type.
copy the redirect URL on the success dialog into your identity provider configuration.
Click Test to verify proper login operation. Modify your specification and retest the configuration until it is working properly.
Click Update.
Disable SSO Configuration
To disable the existing SSO configuration:
Click .
Select Management from the Admin column.
Locate the SSO Config card.
Click Disable.
Click Yes to disable the configuration, or Cancel to keep it enabled.
Edit the SSO Configuration
To edit the existing SSO configuration:
Click .
Select Management from the Admin column.
Locate the SSO Config card.
Modify any of the fields as needed.
Click Test to verify proper login operation. Modify your specification and retest the configuration until it is working properly.
Click Update.
Provision Your Devices and Network
NetQ enables you to provision your switches using the lifecycle management feature in the NetQ UI or the NetQ CLI. Also included here are management procedures for NetQ Agents and optional post-installation configurations.
Manage Switches through Their Lifecycle
Only administrative users can perform the tasks described in this topic.
As an administrator, you want to manage the deployment of NVIDIA product software onto your network devices (servers, appliances, and switches) in the most efficient way and with the most information about the process as possible.
Using the NetQ UI or CLI, lifecycle management enables you to:
Manage Cumulus Linux and NetQ images in a local repository
Configure switch access credentials (required for installations and upgrades)
Manage Cumulus Linux switch inventory and roles
Create snapshots of the network state at various times
Create Cumulus Linux switch configurations, with or without network templates
Create NetQ configuration profiles
Upgrade NetQ (Agents and CLI) on Cumulus Linux switches with NetQ Agents version 2.4.x or later
Install or upgrade NetQ (Agents and CLI) on Cumulus Linux switches with or without NetQ Agents; all in a single job
Upgrade Cumulus Linux 3.x to later 3.x or 4.x on switches with NetQ Agents version 2.4.x or later (includes upgrade of NetQ to 3.x)
View a result history of upgrade attempts
This feature is fully enabled for on-premises deployments and fully disabled for cloud deployments. Contact your local NVIDIA sales representative or submit a support ticket to activate LCM on cloud deployments.
Access Lifecycle Management Features
To manage the various lifecycle management features using the NetQ UI, open the Manage Switch Assets page in one of the following ways:
Click , then select Manage Switches
Click in a workbench header
Click (Switches) in a workbench header, then select Manage switches
The Manage Switch Assets view provides access to switch management, image management, and configuration management features as well as job history. Each tab provides cards that let the administrator manage the relevant aspect of switch assets.
To manage the various lifecycle management features using the NetQ CLI, use the netq lcm command set.
LCM Summary
This table summarizes the UI cards and CLI commands available for the LCM feature.
Function
Description
NetQ UI Cards
NetQ CLI Commands
Switch Management
Discover switches, view switch inventory, assign roles, set user access credentials, perform software installation and upgrade networkwide
Switches
Access
netq lcm show switches
netq lcm add role
netq lcm upgrade
netq lcm add/del/show credentials
netq lcm discover
Image Management
View, add, and remove images for software installation and upgrade
Cumulus Linux Images
NetQ Images
netq lcm add/del/show netq-image
netq lcm add/del/show cl-images
netq lcm add/show default-version
Configuration Management
Set up templates for software installation and upgrade, configure and assign switch settings networkwide
NetQ Configurations
Network Templates
Switch Configurations
netq lcm show netq-config
Job History
View the results of installation, upgrade, and configuration assignment jobs
CL Upgrade History
NetQ Install and Upgrade History
Config Assignment History
netq lcm show status
netq lcm show upgrade-jobs
Manage NetQ and Network OS Images
You manage NetQ and network OS (Cumulus Linux and SONiC) images with LCM. You manage them in a similar manner.
You can upload Cumulus Linux and SONiC binary images to a local LCM repository for upgrading your switches. You can upload NetQ Debian packages to the local LCM repository for installation or upgrade. You can upload images from an external drive.
The network OS and NetQ images are available in several variants based on the software version (x.y.z), the CPU architecture (ARM, x86), platform (based on ASIC vendor), SHA checksum, and so forth. When LCM discovers Cumulus Linux switches running NetQ in your network, it extracts the metadata needed to select the appropriate image for a given switch. Similarly, LCM discovers and extracts the metadata from NetQ images.
The Cumulus Linux Images and NetQ Images cards in the NetQ UI provide a summary of image status in LCM. They show the total number of images in the repository, a count of missing images, and the starting points for adding and managing your images.
The netq lcm show cl-images and netq lcm show netq-images commands also display a summary of the Cumulus Linux or NetQ images, respectively, uploaded to the LCM repo on the NetQ appliance or VM.
Default Version Assignment
You can assign a specific OS or NetQ version as the default version to use during installation or upgrade of switches. It is recommended that you choose the newest version that you intend to install or upgrade on all, or the majority, of your switches. The default selection can be overridden during individual installation and upgrade job creation if an alternate version is needed for a given set of switches.
Missing Images
You should upload images for each network OS and NetQ version currently installed in your inventory so you can support rolling back to a known good version should an installation or upgrade fail. The NetQ UI prompts you to upload any missing images to the repository.
For example, if you have both Cumulus Linux 3.7.3 and 3.7.11 versions, some running on ARM and some on x86 architectures, then LCM verifies the presence of each of these images. If only the 3.7.3 x86, 3.7.3 ARM, and 3.7.11 x86 images are in the repository, the NetQ UI would list the 3.7.11 ARM image as missing. For NetQ, you need both the netq-apps and netq-agent packages for each release variant.
If you have specified a default network OS and/or NetQ version, the NetQ UI also verifies that the necessary versions of the default image are available based on the known switch inventory, and if not, lists those that are missing.
While you do not have to upload images that NetQ determines to be missing, not doing so might cause failures when you attempt to upgrade your switches.
Upload Images
For fresh installations of NetQ 4.1, no images have yet been uploaded to the LCM repository. If you are upgrading from NetQ 3.0.x-3.2.x, the Cumulus Linux images you have previously added are still present.
In preparation for Cumulus Linux upgrades, the recommended image upload flow is:
In a fresh NetQ install, add images that match your current inventory: Upload Missing Images
Use the following instructions to upload missing network OS and NetQ images.
For network OS images:
On the Manage Switch Assets page, Click Upgrade, then click Image Management.
On the Cumulus Linux Images card, click the View # missing CL images link to see what images you need. This opens the list of missing images.
If you have already specified a default image, you must click Manage and then Missing to see the missing images.
Select one or more of the missing images and make note of the version, ASIC vendor, and CPU architecture for each.
Note the Disk Space Utilized information in the header to verify that you have enough space to upload disk images.
Download the network OS disk images (.bin files) needed for upgrade from the Cumulus Software downloads page, selecting the appropriate version, CPU, and ASIC. Place them in an accessible part of your local network.
Back in the UI, click (Add Image) above the table.
Provide the .bin file from an external drive that matches the criteria for the selected image(s), either by dragging and dropping onto the dialog or by selecting from a directory.
Click Import.
On successful completion, you receive confirmation of the upload and the Disk Space Utilization is updated.
If the upload was not successful, an Image Import Failed message appears. Close the Import Image dialog and try uploading the file again.
Click Done.
Click Uploaded to verify the image is in the repository.
Click to return to the LCM dashboard.
The Cumulus Linux Images card now shows the number of images you uploaded.
Download the network OS disk images (.bin files) needed for upgrade from the Cumulus Software downloads page, selecting the appropriate version, CPU, and ASIC. Place them in an accessible part of your local network.
Upload the images to the LCM repository. This example uses a Cumulus Linux 4.2.0 disk image.
Repeat Step 2 for each image you need to upload to the LCM repository.
For NetQ images:
Click Upgrade, then click Image Management.
On the NetQ Images card, click the View # missing NetQ images link to see what images you need. This opens the list of missing images.
If you have already specified a default image, you must click Manage and then Missing to see the missing images.
Select one or all of the missing images and make note of the OS version, CPU architecture, and image type. Remember that you need both netq-apps and neta-agent for NetQ to perform the installation or upgrade.
Download the NetQ debian packages needed for upgrade from the NetQ repository, selecting the appropriate OS version and architecture. Place the files in an accessible part of your local network.
Back in the UI, click (Add Image) above the table.
Provide the .deb file(s) from an external drive that matches the criteria for the selected image, either by dragging and dropping it onto the dialog or by selecting it from a directory.
Click Import.
On successful completion, you receive confirmation of the upload.
If the upload was not successful, an Image Import Failed message appears. Close the Import Image dialog and try uploading the file again.
Click Done.
Click Uploaded to verify the images are in the repository.
After you upload all the missing images, the Missing list is empty.
Click to return to the LCM dashboard.
The NetQ Images card now shows the number of images you uploaded.
Download the NetQ Debian packages needed for upgrade from the My Mellanox support page, selecting the appropriate version and hypervisor/platform. Place them in an accessible part of your local network.
Upload the images to the LCM repository. This example uploads the two packages (netq-agent and netq-apps) needed for NetQ version 4.0.0 for a NetQ appliance or VM running Ubuntu 18.04 with an x86 architecture.
To upload the network OS or NetQ images that you want to use for upgrade, first download the Cumulus Linux or SONiC disk images (.bin files) and NetQ Debian packages needed for upgrade from the Downloads Center and NetQ repository, respectively. Place them in an accessible part of your local network.
If you are upgrading the network OS on switches with different ASIC vendors or CPU architectures, you need more than one image. For NetQ, you need both the netq-apps and netq-agent packages for each variant.
Then continue with the instructions here based on whether you want to use the NetQ UI or CLI.
Click Upgrade, then click Image Management.
Click Add Image on the Cumulus Linux Images or NetQ Images card.
Provide one or more images from an external drive, either by dragging and dropping onto the dialog or by selecting from a directory.
Click Import.
Monitor the progress until it completes. Click Done.
Click to return to the LCM dashboard.
The NetQ Images card is updated to show the number of additional images you uploaded.
Use the netq lcm add cl-image <text-image-path> and netq lcm add netq-image <text-image-path> commands to upload the images. Run the relevant command for each image that needs to be uploaded.
Lifecycle management does not have a default network OS or NetQ upgrade version specified automatically. With the NetQ UI, you can specify the version that is appropriate for your network to ease the upgrade process.
To specify a default version in the NetQ UI:
Click Upgrade, then click Image Management.
Click the Click here to set the default CL version link in the middle of the Cumulus Linux Images card, or click the Click here to set the default NetQ version link in the middle of the NetQ Images card.
Select the version you want to use as the default for switch upgrades.
Click Save. The default version is now displayed on the relevant Images card.
In the CLI, you can check which version of the network OS or NetQ is the default.
To see which version of Cumulus Linux is the default, run netq lcm show default-version cl-images:
cumulus@switch:~$ netq lcm show default-version cl-images
ID                        Name            CL Version  CPU      ASIC            Last Changed
------------------------- --------------- ----------- -------- --------------- -------------------------
image_cc97be3955042ca4185 cumulus-linux-4 4.2.0       x86_64   VX              Tue Jan  5 22:10:59 2021
7c4d0fe95296bcea3e372b437 .2.0-vx-amd64-1
a535a4ad23ca300d52c3      594775435.dirty
                          zc24426ca.bin
To see which version of NetQ is the default, run netq lcm show default-version netq-images:
cumulus@switch:~$ netq lcm show default-version netq-images
ID                        Name            NetQ Version  CL Version  CPU      Image Type           Last Changed
------------------------- --------------- ------------- ----------- -------- -------------------- -------------------------
image_d23a9e006641c675ed9 netq-agent_4.0. 4.0.0         cl4u32      x86_64   NETQ_AGENT           Tue Jan  5 22:23:50 2021
e152948a9d1589404e8b83958 0-cl4u32_160939
d53eb0ce7698512e7001      1187.7df4e1d2_a
                          md64.deb
image_68db386683c796d8642 netq-apps_4.0.0 4.0.0         cl4u32      x86_64   NETQ_CLI             Tue Jan  5 22:23:54 2021
2f2172c103494fef7a820d003 -cl4u32_1609391
de71647315c5d774f834      187.7df4e1d2_am
                          d64.deb
Export Images
You can export a listing of the network OS and NetQ images stored in the LCM repository for reference.
To export image listings:
Open the LCM dashboard.
Click Upgrade, then click Image Management.
Click Manage on the Cumulus Linux Images or NetQ Images card.
Optionally, use the filter option above the table on the Uploaded tab to narrow down a large listing of images.
Click above the table.
Choose the export file type and click Export.
Use the json option with the netq lcm show cl-images command to output a list of the Cumulus Linux image files stored in the LCM repository.
You must have switch access credentials to install and upgrade software on a switch. You can choose between basic authentication (SSH username/password) and SSH (Public/Private key) authentication. These credentials apply to all switches. If some of your switches have alternate access credentials, you must change them or modify the credential information before attempting installations or upgrades with the lifecycle management feature.
Specify Switch Credentials
Switch access credentials are not specified by default. You must add these.
To specify access credentials:
Open the LCM dashboard.
Click the Click here to add Switch access link on the Access card.
Select the authentication method you want to use; SSH or Basic Authentication. Basic authentication is selected by default.
Be sure to use credentials for a user account that has permission to configure switches.
The default credentials for Cumulus Linux have changed from cumulus/CumulusLinux! to cumulus/cumulus for releases 4.2 and later. For details, read Cumulus Linux User Accounts.
Enter a username.
Enter a password.
Click Save.
The Access card now indicates your credential configuration.
You must have sudoer permission to properly configure switches when using the SSH key method.
Create a pair of SSH private and public keys.
ssh-keygen -t rsa -C "<USER>"
Copy the SSH public key to each switch that you want to upgrade using one of the following methods:
Manually copy the SSH public key to the /home/<USER>/.ssh/authorized_keys file on each switch, or
Run ssh-copy-id USER@<switch_ip> on the server where you generated the SSH key pair for each switch
Copy the SSH private key into the entry field in the Create Switch Access card.
For security, your private key is stored in an encrypted format, and only provided to internal processes while encrypted.
The Access card now indicates your credential configuration.
The default credentials for Cumulus Linux have changed from cumulus/CumulusLinux! to cumulus/cumulus for releases 4.2 and later. For details, read Cumulus Linux User Accounts.
To configure SSH authentication using a public/private key:
You must have sudoer permission to properly configure switches when using the SSH Key method.
If the keys do not yet exist, create a pair of SSH private and public keys.
ssh-keygen -t rsa -C "<USER>"
Copy the SSH public key to each switch that you want to upgrade using one of the following methods:
Manually copy the SSH public key to the /home/<USER>/.ssh/authorized_keys file on each switch, or
Run ssh-copy-id USER@<switch_ip> on the server where you generated the SSH key pair for each switch
To change the basic authentication credentials, run the add credentials command with the new username and/or password. This example changes the password for the cumulus account created above:
You can remove the access credentials for switches using the NetQ CLI. Note that without valid credentials, you cannot upgrade your switches.
To remove the credentials, run netq lcm del credentials. Verify their removal by running netq lcm show credentials.
Manage Switch Inventory and Roles
On initial installation, the lifecycle management feature provides an inventory of switches that have been automatically discovered by NetQ and are available for software installation or upgrade through NetQ. This includes all switches running Cumulus Linux 3.6 or later, SONiC 202012 or later, and NetQ Agent 2.4 or later in your network. You assign network roles to switches and select switches for software installation and upgrade from this inventory listing.
View the LCM Switch Inventory
You can view the switch inventory from the NetQ UI and the NetQ CLI.
A count of the switches NetQ was able to discover and the network OS versions that are running on those switches is available from the LCM dashboard.
To view a list of all switches known to lifecycle management, click Manage on the Switches card.
Review the list:
Sort the list by any column; hover over column title and click to toggle between ascending and descending order
Filter the list: click and enter parameter value of interest
If you have more than one network OS version running on your switches, you can click a version segment on the Switches card graph to open a list of switches pre-filtered by that version.
To view a list of all switches known to lifecycle management, run:
netq lcm show switches [version <text-cumulus-linux-version>] [json]
Use the version option to only show switches with a given network OS version, X.Y.Z.
This example shows all switches known by lifecycle management.
This listing is the starting point for network OS upgrades or NetQ installations and upgrades. If the switches you want to upgrade are not present in the list, you can:
Work with the list you have and add them later
Verify the missing switches are reachable using ping
Verify the NetQ Agent is fresh and version 2.4.0 or later for switches that already have the agent installed (click , then click Agents or run netq show agents)
Install NetQ on the switch (refer to Install NetQ)
Upgrade any NetQ Agents if needed (refer to Upgrade NetQ Agents for instructions)
Role Management
Four pre-defined switch roles are available based on the Clos architecture: Superspine, Spine, Leaf, and Exit. With this release, you cannot create your own roles.
Switch roles:
Identify switch dependencies and determine the order in which switches get upgraded
Determine when to stop the process if a failure occurs
When you assign roles, the upgrade process begins with switches having the superspine role, then continues with the spine switches, leaf switches, exit switches, and finally switches with no role assigned. The upgrade process for all switches with a given role must be successful before upgrading switches with the closest dependent role can begin.
For example, you select a group of seven switches to upgrade. Three are spine switches and four are leaf switches. After you successfully upgrade all the spine switches, then you upgrade all the leaf switches. If one of the spine switches fails to upgrade, NetQ upgrades the other two spine switches, but the upgrade process stops after that, leaving the leaf switches untouched, and the upgrade job fails.
When only some of the selected switches have roles assigned in an upgrade job, NetQ upgrades the switches with roles first, then upgrades all switches with no roles assigned.
While role assignment is optional, using roles can prevent switches from becoming unreachable due to dependencies between switches or single attachments. And when you deploy MLAG pairs, switch roles avoid upgrade conflicts. For these reasons, NVIDIA highly recommends assigning roles to all your switches.
Assign Switch Roles
You can assign roles to one or more switches using the NetQ UI or the NetQ CLI.
Open the LCM dashboard.
On the Switches card, click Manage.
Select one switch or multiple switches to assign to the same role.
Click .
Select the role that applies to the selected switch(es).
Click Assign.
Note that the Role column is updated with the role assigned to the selected switch(es). To return to the full list of switches, click All.
Continue selecting switches and assigning roles until most or all switches have roles assigned.
A bonus of assigning roles to switches is that you can then filter the list of switches by their roles by clicking the appropriate tab.
To assign multiple switches to the same role, separate the hostnames with commas (no spaces). This example configures leaf01 through leaf04 switches with the leaf role:
netq lcm add role leaf switches leaf01,leaf02,leaf03,leaf04
View Switch Roles
You can view the roles assigned to the switches in the LCM inventory at any time.
Open the LCM dashboard.
On the Switches card, click Manage.
The assigned role appears in the Role column of the listing.
To view all switch roles, run:
netq lcm show switches [version <text-cumulus-linux-version>] [json]
Use the version option to only show switches with a given network OS version, X.Y.Z.
This example shows the role of all switches in the Role column of the listing.
If you accidentally assign an incorrect role to a switch, you can easily change it to the correct role.
To change a switch role:
Open the LCM dashboard.
On the Switches card, click Manage.
Select the switches with the incorrect role from the list.
Click .
Select the correct role. (Note that you can select No Role here as well to remove the role from the switches.)
Click Assign.
You use the same command to assign a role as you use to change the role.
For a single switch, run:
netq lcm add role exit switches border01
To assign multiple switches to the same role, separate the hostnames with commas (no spaces). For example:
cumulus@switch:~$ netq lcm add role exit switches border01,border02
Export List of Switches
Using the Switch Management feature you can export a listing of all or a selected set of switches.
To export the switch listing:
Open the LCM dashboard.
On the Switches card, click Manage.
Select one or more switches, filtering as needed, or select all switches (click ).
Click .
Choose the export file type and click Export.
Use the json option with the netq lcm show switches command to output a list of all switches in the LCM repository. Alternately, output only switches running a particular network OS version by including the version option.
cumulus@switch:~$ netq lcm show switches json

cumulus@switch:~$ netq lcm show switches version 3.7.11 json
Manage Switch Configurations
You can use the NetQ UI to configure switches using one or more switch configurations. To enable consistent application of configurations, switch configurations can contain network templates for SNMP, NTP, and user accounts, VLAN and MLAG settings, and configuration profiles for interfaces and NetQ Agents.
If you intend to use network templates or configuration profiles, the recommended workflow is as follows:
If you do not want to use the templates or profiles, simply skip to switch configuration.
Manage Network Templates
Network templates provide administrators the option to create switch configuration profiles that can be applied to multiple switches. They can help reduce inconsistencies with switch configuration and speed the process of initial configuration and upgrades. No default templates are provided.
View Network Templates
You can view existing templates using the Network Templates card.
Open the lifecycle management (Manage Switch Assets) dashboard.
Click Configuration Management.
Locate the Network Templates card.
Click Manage to view the list of existing switch templates.
Create Network Templates
No default templates are provided on installation of NetQ. This enables you to create configurations that match your specifications.
To create a network template:
Open the lifecycle management (Manage Switch Assets) dashboard.
Click Configuration Management.
Click Add on the Network Templates card.
Decide which aspects of configuration you want included in this template: SNMP, NTP, LLDP, and/or User accounts.
You can specify your template in any order, but to complete the configuration, you must open the User form to click Save and Finish.
Configure the template using the following instructions.
Provide a name for the template. You must provide a name, which can have a maximum of 22 characters, including spaces.
Accept the VRF selection of Management, or optionally change it to Default. Note that changing the VRF might cause some agents to become unresponsive.
Click Save and Continue to SNMP or select another tab.
SNMP provides a way to query, monitor, and manage your devices in addition to NetQ.
To create a network template with SNMP parameters included:
Enter the IP addresses of the SNMP Agents on the switches and hosts in your network.
You can enter individual IP addresses, a range of IP addresses, or select from the address categories provided (click ).
After adding one of these, you can create another set of addresses by clicking . Continue until you have entered all desired SNMP agent addresses.
Accept the management VRF or change to the default VRF.
Enter the SNMP username(s) of persons who have access to the SNMP server.
Enter contact information for the SNMP system administrator, including an email address or phone number, their location, and name.
Restrict the hosts that should accept SNMP packets:
Click next to Add Read only Community.
Enter the name of an IPv4 or IPv6 community string.
Indicate which hosts should accept messages: Accept any to indicate all hosts are to accept messages (default), or enter the hostnames or IP addresses of the specific hosts that should accept messages.
Click to add additional community strings.
Specify traps to be included:
Click next to Add traps.
Specify the traps as follows:
Parameter
Description
Load (1 min)
Threshold CPU load must cross within a minute to trigger a trap
Trap link down frequency
Toggle on to set the frequency at which to collect link down trap information. Default value is 60 seconds.
Trap link up frequency
Toggle on to set the frequency at which to collect link up trap information. Default value is 60 seconds.
IQuery Secname
Security name for SNMP query
Trap Destination IP
IPv4 or IPv6 address where the trap information is to be sent. This can be a local host or other valid location.
Community Password
Authorization password. Any valid string, where an exclamation mark (!) is the only allowed special character.
Version
SNMP version to use
If you are using SNMP version 3, specify relevant V3 support parameters:
Click next to Add V3 support.
Toggle Authtrap enable to configure authentication for users accessing the SNMP server.
Select an authorization type. For either MDS or SHA, enter an authorization key and optionally specify AES or DES encryption.
Click Save and Continue to NTP or select another tab.
Switches and hosts must be kept in time synchronization with the NetQ appliance or VM to ensure accurate data reporting. NTP is one protocol that can be used to synchronize the clocks of these devices. None of the parameters are required. Specify those which apply to your configuration.
To create a network template with NTP parameters included:
Click NTP.
Enter the address of one or more of your NTP servers. Toggle to choose between Burst and IBurst to specify whether the server should send a burst of packets when the server is reachable or unreachable, respectively.
Specify either the Default or Management VRF for communication with the NTP server.
Enter the interfaces that the NTP server should listen to for synchronization. This can be a IP, broadcast, manycastclient, or reference clock address.
Select the timezone of the NTP server.
Specify advanced parameters:
Click next to Advanced.
Specify the location of a Drift file containing the frequency offset between the NTP server clock and the UTC clock. It is used to adjust the system clock frequency on every system or service start. Be sure that the location you enter can be written by the NTP daemon.
Enter an interface for the NTP server to ignore. Click to add more interfaces to be ignored.
Enter one or more interfaces from which the NTP server should drop all messages. Click to add more interfaces to be dropped.
Restrict query and configuration access to the NTP server. For each restriction, enter restrict followed by the value. Common values include:
Value
Description
default
Block all queries except as explicitly indicated
kod (kiss-o-death)
block all, but time and statistics queries
nomodify
block changes to NTP configuration
notrap
block control message protocol traps
nopeer
block the creation of a peer
noquery
block NTP daemon queries, but allow time queries
Click to add more access control restrictions.
Restrict administrative control (host) access to the NTP server. Enter the IP address for a host or set of hosts, with or without a mask, followed by a restriction value (as described in step 5.) If no mask is provided, 255.255.255.255 is used. If *default* is specified for query/configuration access, entering the IP address and mask for a host or set of hosts in this field allows query access for these hosts (explicit indication). Click to add more administrative control restrictions.
Click Save and Continue to LLDP or select another tab.
LLDP advertises device identities, capabilities, and neighbors. The network template enables you to specify how often you want the advertisement to take place and how long those messages should remain alive on the network.
To create a network template with LLDP parameters included:
Click LLDP.
Enter the interval, in seconds, that you want LLDP to transmit neighbor information and statistics.
Enter how many times the transmit interval you want for LLDP messages to live on the network.
Optionally, specify advanced features by clicking next to Advanced.
Enable advertisement of IEEE 802.1Q TLV (type-length-value) structures, including port description, system name, description and capabilities, management address, and custom names. Mandatory TLVs include end of LLDPPDU, chassis ID, port ID, and time-to-live.
Enable advertisement of system capability codes for the nodes. For example:
Code
Capability
B
Bridge (Switch)
C
DOCSIS Cable Device
O
Other
P
Repeater
R
Router
S
Station
T
Telephone
W
WLAN Access Point
Enable advertisement of the IP address used for management of the nodes.
Click Save and Continue to User or select another tab.
Creating a User template controls who or what accounts can access the switch and what permissions they have with respect to the data found (read/write/execute). You can also control access using groups of users. No parameters are required. Specify parameters which apply to your specific configuration need.
To create a network template with user parameters included:
Click User.
Enter the username and password for one or more users.
Provide a description of the users.
Toggle Should Expire to set the password to expire on a given date.
The current date and time are automatically provided. Click in the field to modify this to the appropriate expiration date.
Specify advanced parameters:
Click next to Advanced.
If you do not want a home folder created for this user or account, toggle Create home folder.
Generate an SSH key pair for this user(s). Toggle Generate SSH key. When generation is selected, the key pair is stored in the /home/<user>/.ssh directory.
If you are looking to remove access for the user or account, toggle Delete user. If you do not want to remove the directories associated with this user or account at the same time, leave toggle as is (default, do not delete).
Identify this account as a system account. Toggle Is system account. System users have no expiration date assigned. Their IDs are selected from the SYS_UID_MIN-SYS_UID_MAX range.
To specify additional access groups these users belongs to, enter the group names in the Groups field. Click to add additional groups.
Click Save and Finish.
Once you have finished the template configuration, you are returned to the network templates library.
This shows the new template you created and which forms have been included in the template. You might only have one or two of the forms in a given template.
Modify Network Templates
For each template that you have created, you can edit, clone, or discard it altogether.
Edit a Network Template
You can change a switch configuration template at any time. The process is similar to creating the template.
To edit a network template:
Enter template edit mode in one of two ways:
Hover over the template , then click (edit).
Click , then select Edit.
Modify the parameters of the various forms in the same manner as when you created the template.
Click User, then Save and Finish.
Clone a Network Template
You can take advantage of a template that is significantly similar to another template that you want to create by cloning an existing template. This can save significant time and reduce errors.
To clone a network template:
Enter template clone mode in one of two ways:
Hover over the template , then click (clone).
Click , then select Clone.
Enter a new name for this cloned template and click Yes. Or to discard the clone, click No.
Modify the parameters of the various forms in the same manner as when you created the template to create the new template.
Click User, then Save and Finish.
The newly cloned template is now visible on the template library.
Delete a Network Template
You can remove a template when it is no longer needed.
To delete a network template, do one of the following:
Hover over the template , then click (delete).
Click , then select Delete.
The template is no longer visible in the network templates library.
Manage NetQ Configuration Profiles
You can set up a configuration profile to indicate how you want NetQ configured when it is installed or upgraded on your Cumulus Linux switches.
The default configuration profile, NetQ default config, is set up to run in the management VRF and provide info level logging. Both WJH and CPU Limiting are disabled.
You can view, add, and remove NetQ configuration profiles at any time.
View NetQ Configuration Profiles
To view existing profiles:
Click (Switches) in the workbench header, then click Manage switches, or click (Main Menu) and select Manage Switches.
Click Configuration Management.
Click Manage on the NetQ Configurations card.
Note that the initial value on first installation of NetQ shows one profile. This is the default profile provided with NetQ.
Review the profiles.
Run the netq lcm show netq-config command:
cumulus@switch:~$ netq lcm show netq-config
ID                        Name            Default Profile                VRF             WJH       CPU Limit Log Level Last Changed
------------------------- --------------- ------------------------------ --------------- --------- --------- --------- -------------------------
config_profile_3289efda36 NetQ default co Yes                            mgmt            Disable   Disable   info      Tue Jan  5 05:25:31 2021
db4065d56f91ebbd34a523b45 nfig
944fbfd10c5d75f9134d42023
eb2b
config_profile_233c151302 CPU limit 75%   No                             mgmt            Disable   75%       info      Mon Jan 11 19:11:35 2021
eb8ee77d6c27fe2eaca51a9bf
2dfcbfd77d11ff0af92b807de
a0dd
Create NetQ Configuration Profiles
You can specify four options when creating NetQ configuration profiles:
Basic: Assign a VRF, and enable or disable what just happened (WJH) feature
Advanced: Set logging level, and enable or disable CPU limit feature
To create a profile:
Click (Switches) in the workbench header, then click Manage switches, or click (Main Menu) and select Manage Switches.
Click Configuration Management.
Click Manage on the NetQ Configurations card.
Click (Add Config) above the listing.
Enter a name for the profile. This is required.
If you do not want NetQ Agent to run in the management VRF, select either Default or Custom. The Custom option lets you enter the name of a user-defined VRF.
Optionally enable WJH.
Refer to What Just Happened for information about configuring this feature, and to WJH Event Messages Reference for a description of the drop reasons. WJH is only available on Mellanox switches.
If you choose to enable WJH for this profile, you can use the default configuration which collects all statistics, or you can select Customize to select which categories and drop reasons you want collected. This is an Early Access capability. Click on each category and drop reason you do not want collected, then click Done. You can discard your changes (return to all categories and drop reasons) by clicking Cancel.
To set a logging level, click Advanced, then choose the desired level.
Optionally set a CPU usage limit for the NetQ Agent. Click Enable and drag the dot to the desired limit.
Click Add to complete the configuration or Close to discard the configuration.
This example shows the addition of a profile with the CPU limit set to 75 percent.
Remove NetQ Configuration Profiles
To remove a NetQ configuration profile:
Click (Switches) in the workbench header, then click Manage switches, or click (Main Menu) and select Manage Switches.
Click Configuration Management.
Click Manage on the NetQ Configurations card.
Select the profile(s) you want to remove and click (Delete).
Manage Switch Configuration
To ease the consistent configuration of your switches, NetQ enables you to create and manage multiple switch configuration profiles. Each configuration can contain Cumulus Linux, NetQ Agent, and switch settings. These can then be applied to a group of switches at once.
You can view, create, and modify switch configuration profiles and their assignments at any time using the Switch Configurations card.
New switch configuration features introduced with release 3.3.0 are Early Access features and are provided in advance of general availability to enable customers to try them out and provide feedback. These features are bundled into the netq-apps package so there is no need to install a separate software package. The features are enabled by default and marked in the documentation here as Early Access.
View Switch Configuration Profiles
You can view existing switch configuration profiles using the Switch Configurations card.
Open the lifecycle management (Manage Switch Assets) dashboard.
Click , then select Manage Switches. Alternately, click in a workbench header.
Click Configuration Management.
Locate the Switch Configurations card.
Click Manage to view the list of existing switch templates.
Create Switch Configuration Profiles
No default configurations are provided on installation of NetQ. This enables you to create configurations that match your specifications.
To create a switch configuration profile:
Open the lifecycle management (Manage Switch Assets) dashboard.
Click Configuration Management.
Click Add on the Switch Configurations card.
You must begin with the Cumulus Linux option. Then you can decide which other aspects of configuration you want included in this template: NetQ Agent, VLANs, MLAG, and/or interfaces.
Specify the settings for each using the following instructions.
The VLAN, MLAG, Interface profiles and Interfaces settings are provided as Early Access capabilities.
Four configuration items are available for the Cumulus Linux configuration portion of the switch configuration profile. Items with a red asterisk (*) are required.
Enter a name for the configuration. The name can be a maximum of 22 characters, including spaces.
Enter the management interface (VLAN ID) to be used for communications with the switches with this profile assigned. Commonly this is either eth0 or eth1.
Select the type of switch that will have this configuration assigned from the Switch type dropdown. Currently this includes Mellanox SN series of switches.
Choose carefully as once this has been selected, it cannot be changed for the given switch configuration profile. You must create a new profile.
If you want to include network settings in this configuration, click Add.
This opens the Network Template forms. You can select an existing network template to pre-populate the parameters already specified in that template, or you can start from scratch to create a different set of network settings.
To use an existing network template as a starting point:
Select the template from the dropdown.
If you have selected a network template that has any SNMP parameters specified, verify those parameters and specify any additional required parameters, then click Continue or click NTP.
If the selected network template has any NTP parameters specified, verify those parameters and specify any additional required parameters, then click Continue or click LLDP.
If the selected network template has any LLDP parameters specified, verify those parameters, then click Continue or click User.
If the selected network template has any User parameters specified, verify those parameters and specify any additional required parameters, then click Done.
If you think this Cumulus Linux configuration is one that you will use regularly, you can make it a template. Enter a name for the configuration and click Yes.
To create a new set of network settings:
Select the various forms to specify parameters for this configuration. Note that selected parameters are required on each form, noted by red asterisks (*). Refer to Create Network Templates for a description of the fields.
When you have completed the network settings, click Done.
If you are not on the User form, you need to go to that tab for the Done option to appear.
In either case, if you change your mind about including network settings, click to exit the form.
Click one of the following:
Discard to clear your entries and start again
Save and go to NetQ Agent configuration to configure additional switch configuration parameters
Save and deploy on switches if the switch configuration is now complete
Click NetQ Agent Configuration.
Select an existing NetQ Configuration profile or create a custom one.
To use an existing network template as a starting point:
Select the configuration profile from the dropdown.
Save and go to VLANs to configure additional switch configuration parameters
Save and deploy on switches if the switch configuration is now complete
This is an Early Access capability.
Click VLANs.
Click Add VLAN/s if none are present, or click to add more VLANs to the switch configuration.
Enter a name for the VLAN when creating a single VLAN or enter a prefix (combined with the VLAN ID) for multiple VLANs.
Enter a single VLAN ID (1-4096) or a range of IDs. When entering multiple IDs, separate them by commas and do not use spaces. For example, you can enter them:
One at a time: 25,26,27,28,85,86,87,88,89,112
As a set of ranges and individual IDs: 25-28,85-89 or 25-28,85-89,112
As a single range: 25-28 or 85-89
Click Create.
The VLAN/s are displayed in the VLAN list. Once VLANs are in the list, they can be exported, modified, removed, and duplicated using the menu above the list. Simply select one, all, or filter for a subset of VLANs, then click the relevant menu icon.
Click one of the following:
Discard to clear your entries and start again
Save and go to MLAG to configure additional switch configuration parameters
Save and deploy on switches if the switch configuration is now complete
MLAG is disabled by default. If you want to include MLAG in the switch configuration, you must enable it.
Click Enable.
Select the VLAN over which MLAG traffic is communicated. If you have created VLANs already, select the VLAN from the Management VLAN dropdown. If you have not yet created any VLANs, refer to VLAN tab and then return here.
Accept the default (180 seconds) or modify the amount of time clagd should wait to bring up the MLAG bonds and anycast IP addresses.
Specify the peerlink. Note items with a red asterisk (*) are required.
Enter the supported MTU for this link
Enter the minimum number of links to use. Add additional links to handle link failures of the peerlink bond itself.
Select the private VLAN (PVID) from the dropdown. If you have not yet created any VLANs, refer to VLAN tab and then return here.
Enter a tagged VLAN range to link switches.
Designate which ports are to be used, including ingress and egress ports.
Click one of the following:
Discard to clear your entries and start again
Save and go to Interface profiles to configure additional switch configuration parameters
Save and deploy on switches if the switch configuration is now complete
This is an Early Access capability.
Every interface requires at least one interface profile. Specifically, a bond, SVI, sub-interface, or port interface require at least one corresponding interface profile. For example, for a given bond interface, you must have at least one bond interface profile. For a given SVI, you must have at least one SVI interface profile. And so forth. Each of these can be configured independently. That is, configuring a bond interface and interface profile does not require you to configure any of the other SVI, sub-interface or port interface options.
Interface profiles are used to speed configuration of switches by configuring common capabilities of an interface component and then referencing that profile in the component specification.
Add Bond Profiles
You can create a new bond profile or import an existing one to modify. Bond profiles are used to specify interfaces in the switch configuration.
To create a new bond profile:
Click Interface profiles.
Click Create if no profiles yet exist, or click to add another bond profile.
Enter a unique name for the bond profile. Note that items with a red asterisk (*) are required.
Click on the type of bond this profile is to support; either layer 2 (L2) or layer 3 (L3).
Enter the supported MTU for this bond profile.
Enter the minimum number of links to use. Add additional links to handle link failures of the bond itself.
Select the mode this profile is to support: either Lacp or Static.
Choosing Lacp (link aggregation control protocol) allows for redundancy by load-balancing traffic across all available links. Choosing Static provides no load balancing.
If you select LACP, then you must also specify:
The LACP rate: how often to expect PDUs at the switch; Fast–every second, or Slow–every 30 seconds
Whether to enable or disable LACP bypass: Enable allows a bond configured in 802.3ad mode to become active and forward traffic even when there is no LACP partner
Enable or disable whether the bond must be dually connected. When enabled, you must specify the associated MLAG identifier.
Click Next to specify the bond attributes.
Select a private VLAN ID (pvid) from the dropdown for communication.
Assign one or more tagged VLANs to support traffic from more than one VLAN on a port.
Review your specification, clicking Back to review the bond details.
When you are satisfied with the bond profile specification, click Create.
The bond profiles are displayed in the Bond list. Once bonds are in the list, they can be exported, modified, removed, and duplicated using the menu above the list. Simply select one, all, or filter for a subset of bonds, then click the relevant menu icon.
To import an existing bond profile:
Click Interface profiles.
Click Import if no profiles yet exist, or click to import a bond profile.
Enter a name for this new bond profile.
Select a bond from the dropdown.
Click Import.
Select the profile from the list and click to edit it.
Add SVI Profiles
You can create a new SVI profile or import an existing one to modify. SVI profiles are used to specify interfaces in the switch configuration.
To create a new SVI profile:
Click Interface profiles.
Click SVI Profiles.
Click Create if no profiles yet exist, or click to add a new SVI profile.
Enter a unique name for the SVI profile.
Enter the supported MTU for this SVI profile.
Select a VRF profile from the dropdown, or enter the name of a VRF and click Add VRF.
Enable VRR if desired, and enter the associated MAC address.
Click Create.
The SVI profiles are displayed in the SVI list. Once SVIs are in the list, they can be exported, modified, removed, and duplicated using the menu above the list. Simply select one, all, or filter for a subset of SVIs, then click the relevant menu icon.
To import an existing SVI profile:
Click Interface profiles.
Click SVI Profiles.
Click Import if no profiles yet exist, or click to import an SVI profile.
Enter a name for this new SVI profile.
Select an SVI from the dropdown.
Click Import.
Select the profile from the list and click to edit it.
Add Sub-interfaces Profiles
You can create a new subinterface profile or import an existing one to modify. Subinterface profiles are used to specify interfaces in the switch configuration.
Click Interface profiles.
Click Subinterface Profiles.
Click Create if no profiles yet exist, or click to add a new sub-interface profile.
Enter a unique name for the subinterface profile.
Enter the supported MTU for this subinterface profile.
Select a VRF profile from the dropdown, or enter the name of a VRF and click Add VRF.
Click Create.
The subinterface profiles are displayed in the subinterface list. Once subinterfaces are in the list, they can be exported, modified, removed, and duplicated using the menu above the list. Simply select one, all, or filter for a subset of subinterfaces, then click the relevant menu icon.
To import an existing subinterface profile:
Click Interface profiles.
Click Subinterface Profiles.
Click Import if no profiles yet exist, or click to import a subinterface profile.
Enter a name for this new subinterface profile.
Select a subinterface from the dropdown.
Click Import.
Select the profile from the list and click to edit it.
Add Port Profiles
You can create a new port profile or import an existing one to modify. Port profiles are used to specify interfaces in the switch configuration.
Click Interface profiles.
Click Port Profiles.
Click Create if no profiles yet exist, or click to add a new port profile.
Enter a unique name for the port profile. Note that items with a red asterisk (*) are required.
Click on the type of port this profile is to support; either layer 2 (L2) or layer 3 (L3).
Enter the supported MTU for this port profile.
Enable or disable forward error correction (FEC).
Enable or disable auto-negotiation of link speeds.
Specify the whether to support transmit and receive on this port (Full duplex) or either transmit or receive on this port (Half duplex).
Specify the port speed from the dropdown. Choices are based on the switch type selected iin the CL configuration tab.
Click Next to specify port attributes.
Select a private VLAN ID (pvid) for communication from the dropdown.
Assign one or more tagged VLANs to support traffic from more than one VLAN on a port.
Review your specification, clicking Back to review the bond details.
When you are satisfied with the port profile specification, click Create.
The port profiles are displayed in the Port list. Once ports are in the list, they can be exported, modified, removed, and duplicated using the menu above the list. Simply select one, all, or filter for a subset of ports, then click the relevant menu icon.
To import an existing port profile:
Click Interface profiles.
Click Port Profiles.
Click Import if no profiles yet exist, or click to import a port profile.
Enter a name for this new port profile.
Select a port profile from the dropdown.
Click Import.
Select the profile from the list and click to edit it.
Now that you have one complete interface profile defined, click one of the following:
Discard to clear your entries and start again
Save and go to Interfaces to configure additional switch configuration parameters
Save and deploy on switches if the switch configuration is now complete
This is an Early Access capability.
Every interface requires at least one interface profile. Specifically, a bond, SVI, sub-interface, or port interface require at least one corresponding interface profile. For example, for a given bond interface, you must have at least one bond interface profile. For a given SVI, you must have at least one SVI interface profile. And so forth. Each of these can be configured independently. That is, configuring a bond interface and interface profile does not require you to configure any of the other SVI, sub-interface or port interface options.
Interfaces identify how and where communication occurs.
Add Bonds
Bonds indicate how switches are connected to each other. You must have at least one bond interface profile specified to configure a bond interface (return to the Interface Profiles tab and see Add Bond Interface Profiles if needed).
Click Interfaces.
Click Create if no bonds exist yet, or click to add a new bond.
Enter a unique name for the bond.
Optionally enter an alias for the bond.
Select a bond profile from the dropdown. If you have not yet created one, follow the instructions in the Interface Profiles tab and then return here.
Assign the ports included in this bond. The port name is provided based on the switch type selection you made earlier. The port numbers are entered here.
When you are satisfied with the bond specification, click Create.
The bonds are displayed in the Bond list. Once bonds are in the list, they can be exported, modified, removed, and duplicated using the menu above the list. Simply select one, all, or filter for a subset of bonds, then click the relevant menu icon.
Repeat these steps to add additional bonds as needed. Then continue to specifying SVIs.
Add SVIs
Add SVIs (switch virtual interfaces) to your switch configuration when you need a virtual interface at layer 3 to a VLAN. You must have at least one SVI interface profile specified to configure an SVI interface (return to the Interface Profiles tab and see Add SVI Interface Profiles if needed).
Click Interfaces.
Click SVIs.
Click Create if no SVIs exist, or click to add a new SVI.
Enter a unique name for the SVI.
Select a VLAN to apply to this SVI.
Select an SVI profile to apply to this SVI. If you have not yet created one, follow the instructions in the Interface Profiles tab and then return here.
When you are satisfied with your SVI specification, click Create.
The SVIs are displayed in the SVI list. Once SVIs are in the list, they can be exported, modified, removed, and duplicated using the menu above the list. Simply select one, all, or filter for a subset of SVIs, then click the relevant menu icon.
Repeat these steps to add additional SVIs as needed. Then continue to specifying subinterfaces.
Add Subinterfaces
Add subinterface to your switch configuration when you want a VLAN associated with a given interface. You must have at least one subinterface interface profile specified to configure a bond interface (return to the Interface Profiles tab and see Add Subinterface Profiles if needed).
Click Interfaces.
Click Subinterfaces.
Click Create if no subinterfaces exist, or click to add a new subinterface.
Enter a unique name for the subinterface in the format <parent-interface-name:vlan-subinterface-id>. For example, swp2:1.
Optionally enter an alias for this subinterface.
Select a VLAN to apply to this subinterface. This should match the name you specified in step 4.
Select a parent interface from the dropdown. This should match the name you specified in step 4.
Select a subinterface profile to apply to this subinterface.
When you are satisfied with your subinterface specification, click Create.
The subinterfaces are displayed in the subinterface list. Once subinterfaces are in the list, they can be exported, modified, removed, and duplicated using the menu above the list. Simply select one, all, or filter for a subset of subinterfaces, then click the relevant menu icon.
Repeat these steps to add additional subinterfaces as needed. Then continue to specifying ports.
Add Ports
This tab describes all of the ports on the identified switch type. The port name and bond are provided by default (based on your previous switch configuration entries). For each port, you must define the speed and assign an interface profile. Optionally you can configure ports to be split to support multiple interfaces. Any caveats related to port configuration on the specified type of switch are listed under the port listing.
You must have at least one port interface profile specified to configure a port interface (return to the Interface Profiles tab and see Add Port Interface Profiles if needed).
Click Interfaces.
Click Ports.
For each port, verify the port speed. For any port that should be other than the default highlighted, click on the alternate speed choice.
If you want to break out selected ports, choose the split value from the dropdown.
In the example above, swp1 has its speed set to 100 Gbps. On the Mellanox SN2700 switch being configured here, this port can then be broken into two 50 Gbps speed interfaces or four 25 Gbps speed interfaces. Some limitations on other ports can occur when you break out a given port. In this case, if we were to choose a 4x breakout, swp2 would become unavailable and you would not be able to configure that port.
If a port is missing a bond (all ports must have a bond), return to Interfaces > Bonds to assign it.
Assign an interface profile for each port by clicking on the Select profile link.
Click L2 or L3 to view available port profiles. If you have not yet created one, follow the instructions in the Interface Profiles tab and then return here.
Click on the port profile card to select it and return to the port list. If you accidentally select the wrong port profile, simply click on the profile name and reselect a different profile.
When you are satisfied with the port specification for all ports, click one of the following:
Discard to clear your entries and start again.
Save and go to Switches to assign the switch configuration to switches now.
Save and deploy on switches to complete the switch configuration and go to your switch configurations listing. You can edit the configuration to assign it to switches at a later time.
Assign Switch Configuration Profiles to Switches
After you have completed one or more switch configurations, you can assign them to one or more switches.
To assign a switch configuration:
Open the Switches tab in the switch configuration you want to assign:
If you have just completed creating a switch configuration and are still within the configuration page, simply click the Switches tab.
If you want to apply a previously saved configuration, click on a workbench header > click Configuration Management > click Manage on the Switch Configurations card > locate the desired configuration > click > select Edit > click the Switches tab.
In either case, you should land on the switch configuration page with the Switches tab open.
A few items to note on this tab:
Above the switches (left), the number of switches that can be assigned and the number of switches that have already been assigned a switch configuration
Above the switches (right), management tools to help find the switches you want to assign with this configuration, including filter and search.
Select the switches to be assigned this configuration. Each switch selected must have items specified that are particular to that switch. This can be done in one of two ways:
Select an individual switch by clicking on the switch card
Filter or search for switches and then click Save and deploy on switches
Either way, a per-instance variables form appears for the selected or one of the selected switches.
This is an Early Access capability.
Enter the required parameters for each switch using the following instructions.
This is an Early Access capability.
Verify the IP address of the switch.
Optionally change the hostname of the switch.
Enter the loopback IP address for the switch.
Enter the System MAC address for the switch.
Enter the system ID for the switch.
Enter a priority for the switch in the format of an integer, where zero (0) is the lowest priority.
Enter a backup IP address for the switch in the event it becomes unreachable.
Enter a VXLAN anycast IP address for the switch.
Enter the name of a VRF for the switch.
Click Continue to vrf details, or click Save and Exit to come back later to finish the specification. If you choose to save and exit, click on the switch card to return to the per instance variable definition pages.
The VRF identified in General Changes is presented. Optionally add the associated IPv4 and IPv6 addresses for this VRF.
Click Continue to bond details, or click Save and Exit to come back later to finish the specification. If you choose to save and exit, click on the switch card to return to the per instance variable definition pages.
This topic is in development.
The SVIs specified are presented. If no SVIs are defined and there should be, return to the Interface Profiles and Interfaces tabs to specify them.
Optionally add the associated IPv4 and IPv6 addresses this switch should use for these SVIs.
Click Continue to subinterface details, or click Save and Exit to come back later to finish the specification. If you choose to save and exit, click on the switch card to return to the per instance variable definition pages.
The subinterfaces specified are presented. If no subinterfaces are defined and there should be, return to the Interface Profiles and Interfaces tabs to specify them.
Optionally add the associated IPv4 and IPv6 addresses this switch should use for these subinterfaces.
Click Continue to port details, or click Save and Exit to come back later to finish the specification. If you choose to save and exit, click on the switch card to return to the per instance variable definition pages.
This topic is in development.
Click Save and Exit.
To run the job to apply the configuration, click Save and deploy on switches.
Enter a name for the job (maximum of 22 characters including spaces). Verify the configuration name and number of switches you have selected to assign this configuration to. then click Continue.
This opens the monitoring page for the assignment jobs, similar to the upgrade jobs. The job title bar indicates the name of the switch configuration being applied and the number of switches that to be assigned with the configuration. (After you have multiple switch configurations created, you might have more than one configuration being applied in a single job.) Each switch element indicates its hostname, IP address, installed Cumulus Linux and NetQ versions, a note indicating this is a new assignment, the switch configuration being applied, and a menu that provides the detailed steps being executed. The last is useful when the assignment fails as any errors are included in this popup.
Click to return to the switch configuration page where you can either create another configuration and apply it. If you are finished assigning switch configurations to switches, click to return to the lifecycle management dashboard.
When you return the dashboard, your Switch Configurations card on the Configuration Management tab shows the new configurations, and the Config Assignment History card appears on the Job History tab that shows a summary status of all configuration assignment jobs attempted.
Click View on the Config Assignment History card to open the details of all assignment jobs. Refer to Manage Switch Configurations for more detail about this card.
Edit a Switch Configuration
You can edit a switch configuration at any time. After you have made changes to the configuration, you can apply it to the same set of switches or modify the switches using the configuration as part of the editing process.
To edit a switch configuration:
Locate the Switch Configurations card on the Configuration Management tab of the lifecycle management dashboard.
Click Manage.
Locate the configuration you want to edit. Scroll down or filter the listing to help find the configuration when there are multiple configurations.
You can remove a switch configuration at any time; however if there are switches with the given configuration assigned, you must first assign an alternate configuration to those switches.
To remove a switch configuration:
Locate the Switch Configurations card on the Configuration Management tab of the lifecycle management dashboard.
Click Manage.
Locate the configuration you want to remove. Scroll down or filter the listing to help find the configuration when there are multiple configurations.
Click , then select Delete.
If any switches are assigned to this configuration, an error message appears. Assign a different switch configuration to the relevant switches and repeat the removal steps.
Otherwise, confirm the removal by clicking Yes.
Assign Existing Switch Configuration Profiles
You can assign existing switch configurations to one or more switches at any time. You can also change the switch configuration already assigned to a switch.
As new switches are added to your network, you might want to use a switch configuration to speed the process and make sure it matches the configuration of similarly designated switches.
To assign an existing switch configuration to switches:
Locate the Switch Configurations card on the Configuration Management tab of the lifecycle management dashboard.
Click Manage.
Locate the configuration you want to assign.
Scroll down or filter the listing by:
Time Range: Enter a range of time in which the switch configuration was created, then click Done.
All switches: Search for or select individual switches from the list, then click Done.
All switch types: Search for or select individual switch series, then click Done.
All users: Search for or select individual users who created a switch configuration, then click Done.
All filters: Display all filters at once to apply multiple filters at once. Additional filter options are included here. Click Done when satisfied with your filter criteria.
By default, filters show all of the items of the given filter type until it is restricted by these settings.
Click Select switches in the switch configuration summary.
Select the switches that you want to assign to the switch configuration.
Scroll down or use the filter and Search options to help find the switches of interest. You can filter by role, Cumulus Linux version, or NetQ version. The badge on the filter icon indicates the number of filters applied. Colors on filter options are only used to distinguish between options. No other indication is intended.
In this example, we have three roles defined, and we have selected to filter on the spine role.
The result is four switches. Note that only the switches that meet the criteria and have no switch configuration assigned are shown. In this example, there are two additional switches with the spine role, but they already have a switch configuration assigned to them. Click on the link above the list to view those switches.
Continue narrowing the list of switches until all or most of the switches are visible.
Click on each switch card to be given the switch configuration.
When you select a card, if the per-switch variables have not already been specified, you must complete that first. Refer to Assign Switch Configuration Profiles to Switches beginning at step 2, then return here. If a switch has an incomplete specification of the required variables, click to enter the required information.
Verify all of the switches are selected that you want applied with this configuration, then click Done.
If you have additional switches that you want to assign a different switch configuration, follow Steps 3-7 for each switch configuration.
A job is created with each of the assignments configured. It is shown at the botton of the page. If you have multiple configuration assignments, they all become part of a single assignment job.
Click Start Assignment to start the job.
This example shows only one switch configuration assignment.
Enter a name for the job (maximum of 22 characters including spaces), then click Continue.
Watch the progress or click to return to the switch configuration page where you can either create another configuration and apply it. If you are finished assigning switch configurations to switches, click to return to the lifecycle management dashboard.
The Config Assignment History card on the Job History tab is updated to include the status of the job you just ran.
Change the Configuration Assignment on a Switch
You can change the switch configuration assignment at any time. For example you might have a switch that is starting to experience reduced performance, so you want to run What Just Happened on it to see if there is a particular problem area. You can reassign this switch to a new configuration with WJH enabled on the NetQ Agent while you test it. Then you can change it back to its original assignment.
To change the configuration assignment on a switch:
Locate the Switch Configurations card on the Configuration Management tab of the lifecycle management dashboard.
Click Manage.
Locate the configuration you want to assign. Scroll down or filter the listing to help find the configuration when there are multiple configurations.
Click Select switches in the switch configuration summary.
Select the switches that you want to assign to the switch configuration.
Scroll down or use the filter and Search options to help find the switch(es) of interest.
Click on each switch card to be given the switch configuration.
When you select a card, if the per-switch variables have not already been specified, you must complete that first. Refer to Assign Switch Configuration Profiles to Switches beginning at step 2, then return here. If a switch has an incomplete specification of the required variables, click to enter the required information.
Click Done.
Click Start Assignment.
Watch the progress.
On completion, each switch shows the previous assignment and the newly applied configuration assignment.
Click to return to the switch configuration page where you can either create another configuration and apply it. If you are finished assigning switch configurations to switches, click to return to the lifecycle management dashboard.
The Config Assignment History card on the Job History tab is updated to include the status of the job you just ran.
View Switch Configuration History
You can view a history of switch configuration assignments using the Config Assignment History card.
To view a summary, locate the Config Assignment History card on the lifecycle management dashboard.
To view details of the assignment jobs, click View.
Above the jobs, a number of filters are provided to help you find a particular job. To the right of those is a status summary of all jobs. Click in the job listing to see the details of that job. Click to return to the lifecycle management dashboard.
Upgrade NetQ Agent Using LCM
The lifecycle management (LCM) feature enables you to upgrade to NetQ 4.1.0 on switches with an existing NetQ Agent 2.4.x-3.2.1 release using the NetQ UI. You can upgrade only the NetQ Agent or upgrade both the NetQ Agent and the NetQ CLI at the same time. You can run up to five jobs simultaneously; however, a given switch can only appear in one running job at a time.
The upgrade workflow includes the following steps:
Upgrades can be performed from NetQ Agents of 2.4.x and 3.0.x-3.2.x releases. Lifecycle management does not support upgrades from NetQ 2.3.1 or earlier releases; you must perform a new installation in these cases. Refer to Install NetQ Agents.
Prepare for a NetQ Agent Upgrade
Prepare for NetQ Agent upgrade on switches as follows:
You can upgrade NetQ Agents on switches as follows:
In the Switch Management tab, click Manage on the Switches card.
Select the individual switches (or click to select all switches) with older NetQ releases that you want to upgrade. Filter by role (on left) to narrow the listing and sort by column heading (such as hostname or IP address) to order the list in a way that helps you find the switches you want to upgrade.
Click (Upgrade NetQ) above the table.
From this point forward, the software walks you through the upgrade process, beginning with a review of the switches that you selected for upgrade.
Verify that the number of switches selected for upgrade matches your expectation.
Enter a name for the upgrade job. The name can contain a maximum of 22 characters (including spaces).
Review each switch:
Is the NetQ Agent version between 2.4.0 and 3.2.1? If not, this switch can only be upgraded through the switch discovery process.
Is the configuration profile the one you want to apply? If not, click Change config, then select an alternate profile to apply to all selected switches.
You can apply different profiles to switches in a single upgrade job by selecting a subset of switches (click checkbox for each switch) and then choosing a different profile. You can also change the profile on a per switch basis by clicking the current profile link and selecting an alternate one.
Scroll down to view all selected switches or use Search to find a particular switch of interest.
After you are satisfied with the included switches, click Next.
Review the summary indicating the number of switches and the configuration profile to be used. If either is incorrect, click Back and review your selections.
Select the version of NetQ Agent for upgrade. If you have designated a default version, keep the Default selection. Otherwise, select an alternate version by clicking Custom and selecting it from the list.
By default, the NetQ Agent and CLI are upgraded on the selected switches. If you do not want to upgrade the NetQ CLI, click Advanced and change the selection to No.
Click Next.
Several checks are performed to eliminate preventable problems during the upgrade process.
These checks verify the following when applicable:
Selected switches are not currently scheduled for, or in the middle of, a Cumulus Linux or NetQ Agent upgrade
Selected version of NetQ Agent is a valid upgrade path
All mandatory parameters have valid values, including MLAG configurations
All switches are reachable
The order to upgrade the switches, based on roles and configurations
If any of the pre-checks fail, review the error messages and take appropriate action.
If all of the pre-checks pass, click Upgrade to initiate the upgrade job.
Watch the progress of the upgrade job.
You can watch the detailed progress for a given switch by clicking .
Click to return to Switches listing.
For the switches you upgraded, you can verify the version is correctly listed in the NetQ_Version column. Click to return to the lifecycle management dashboard.
The NetQ Install and Upgrade History card is now visible in the Job History tab and shows the status of this upgrade job.
To upgrade the NetQ Agent on one or more switches, run:
This example creates a NetQ Agent upgrade job called upgrade-cl430-nq330. It upgrades the spine01 and spine02 switches with NetQ Agents version 4.1.0.
cumulus@switch:~$ netq lcm upgrade name upgrade-cl430-nq330 netq-version 4.1.0 hostnames spine01,spine02
Analyze the NetQ Agent Upgrade Results
After starting the upgrade you can monitor the progress in the NetQ UI. You can monitor the progress from the preview page or the Upgrade History page.
From the preview page, a green circle with rotating arrows appears for each switch as it is working. Alternately, you can close the detail of the job and see a summary of all current and past upgrade jobs on the NetQ Install and Upgrade History page. The job started most recently appears at the top, and the data refreshes periodically.
If you get while the job is in progress, it might appear as if nothing is happening. Try closing (click ) and reopening your view (click ), or refreshing the page.
Monitor the NetQ Agent Upgrade Job
Several viewing options are available for monitoring the upgrade job.
Monitor the job with full details open:
Monitor the job with only summary information in the NetQ Install and Upgrade History page. Open this view by clicking in the full details view; useful when you have multiple jobs running simultaneously.
When multiple jobs are running, scroll down or use the filters above the jobs to find the jobs of interest:
Time Range: Enter a range of time in which the upgrade job was created, then click Done.
All switches: Search for or select individual switches from the list, then click Done.
All switch types: Search for or select individual switch series, then click Done.
All users: Search for or select individual users who created an upgrade job, then click Done.
All filters: Display all filters at once to apply multiple filters at once. Additional filter options are included here. Click Done when satisfied with your filter criteria.
By default, filters show all of that items of the given filter type until it is restricted by these settings.
Monitor the job through the NetQ Install and Upgrade History card in the Job History tab. Click twice to return to the LCM dashboard.
Sample Successful NetQ Agent Upgrade
This example shows that all four of the selected switches were upgraded successfully. You can see the results in the Switches list as well.
Sample Failed NetQ Agent Upgrade
This example shows that an error has occurred trying to upgrade two of the four switches in a job. The error indicates that the access permissions for the switches are invalid. In this case, you need to modify the switch access credentials and then create a new upgrade job.
If you were watching this job from the LCM dashboard view, click View on the NetQ Install and Upgrade History card to return to the detailed view to resolve any issues that occurred.
To view the progress of upgrade jobs, run:
netq lcm show upgrade-jobs netq-image [json]
netq lcm show status <text-lcm-job-id> [json]
You can view the progress of one upgrade job at a time. To do so, you first need the job identifier and then you can view the status of that job.
This example shows all upgrade jobs that are currently running or have completed, and then shows the status of the job with a job identifier of job_netq_install_7152a03a8c63c906631c3fb340d8f51e70c3ab508d69f3fdf5032eebad118cc7.
cumulus@switch:~$ netq lcm show upgrade-jobs netq-image json
[
    {
        "jobId": "job_netq_install_7152a03a8c63c906631c3fb340d8f51e70c3ab508d69f3fdf5032eebad118cc7",
        "name": "Leaf01-02 to NetQ330",
        "netqVersion": "4.1.0",
        "overallStatus": "FAILED",
        "pre-checkStatus": "COMPLETED",
        "warnings": [],
        "errors": [],
        "startTime": 1611863290557.0
    }
]

cumulus@switch:~$ netq lcm show status netq-image job_netq_install_7152a03a8c63c906631c3fb340d8f51e70c3ab508d69f3fdf5032eebad118cc7
NetQ Upgrade FAILED

Upgrade Summary
---------------
Start Time: 2021-01-28 19:48:10.557000
End Time: 2021-01-28 19:48:17.972000
Upgrade CLI: True
NetQ Version: 4.1.0
Pre Check Status COMPLETED
Precheck Task switch_precheck COMPLETED
	Warnings: []
	Errors: []
Precheck Task version_precheck COMPLETED
	Warnings: []
	Errors: []
Precheck Task config_precheck COMPLETED
	Warnings: []
	Errors: []


Hostname          CL Version  NetQ Version  Prev NetQ Ver Config Profile               Status           Warnings         Errors       Start Time
                                            sion
----------------- ----------- ------------- ------------- ---------------------------- ---------------- ---------------- ------------ --------------------------
leaf01            4.2.1       4.1.0         3.2.1         ['NetQ default config']      FAILED           []               ["Unreachabl Thu Jan 28 19:48:10 2021
                                                                                                                         e at Invalid
                                                                                                                         /incorrect u
                                                                                                                         sername/pass
                                                                                                                         word. Skippi
                                                                                                                         ng remaining
                                                                                                                         10 retries t
                                                                                                                         o prevent ac
                                                                                                                         count lockou
                                                                                                                         t: Warning:
                                                                                                                         Permanently
                                                                                                                         added '192.1
                                                                                                                         68.200.11' (
                                                                                                                         ECDSA) to th
                                                                                                                         e list of kn
                                                                                                                         own hosts.\r
                                                                                                                         \nPermission
                                                                                                                         denied,
                                                                                                                         please try a
                                                                                                                         gain."]
leaf02            4.2.1       4.1.0         3.2.1         ['NetQ default config']      FAILED           []               ["Unreachabl Thu Jan 28 19:48:10 2021
                                                                                                                         e at Invalid
                                                                                                                         /incorrect u
                                                                                                                         sername/pass
                                                                                                                         word. Skippi
                                                                                                                         ng remaining
                                                                                                                         10 retries t
                                                                                                                         o prevent ac
                                                                                                                         count lockou
                                                                                                                         t: Warning:
                                                                                                                         Permanently
                                                                                                                         added '192.1
                                                                                                                         68.200.12' (
                                                                                                                         ECDSA) to th
                                                                                                                         e list of kn
                                                                                                                         own hosts.\r
                                                                                                                         \nPermission
                                                                                                                         denied,
                                                                                                                         please try a
                                                                                                                         gain."]
Reasons for NetQ Agent Upgrade Failure
Upgrades can fail at any of the stages of the process, including when backing up data, upgrading the NetQ software, and restoring the data. Failures can also occur when attempting to connect to a switch or perform a particular task on the switch.
Some of the common reasons for upgrade failures and the errors they present:
Reason
Error Message
Switch is not reachable via SSH
Data could not be sent to remote host “192.168.0.15.” Make sure this host can be reached over ssh: ssh: connect to host 192.168.0.15 port 22: No route to host
Switch is reachable, but user-provided credentials are invalid
Invalid/incorrect username/password. Skipping remaining 2 retries to prevent account lockout: Warning: Permanently added ‘<hostname-ipaddr>’ to the list of known hosts. Permission denied, please try again.
Upgrade task could not be run
Failure message depends on the why the task could not be run. For example: /etc/network/interfaces: No such file or directory
Upgrade task failed
Failed at- <task that failed>. For example: Failed at- MLAG check for the peerLink interface status
Retry failed after five attempts
FAILED In all retries to process the LCM Job
Upgrade Cumulus Linux Using LCM
LCM provides the ability to upgrade Cumulus Linux on one or more switches in your network through the NetQ UI or the NetQ CLI. You can run up to five upgrade jobs simultaneously; however, a given switch can only appear in one running job at a time.
You can upgrade Cumulus Linux from between the following releases:
3.6.z to later versions of 3.y.z
4.y to later versions of 4.y.z
3.6.0 or later to 4.2.0 or later versions of 4.y.z
NetQ LCM does not support upgrading switches to Cumulus Linux 5. To upgrade to Cumulus Linux 5.0 or above, see the Upgrading Cumulus Linux documentation.
Workflows for Cumulus Linux Upgrades Using LCM
Three methods are available through LCM for upgrading Cumulus Linux on your switches based on whether the NetQ Agent is already installed on the switch or not, and whether you want to use the NetQ UI or the NetQ CLI:
Use NetQ UI or NetQ CLI for switches with NetQ 2.4.z or later Agent already installed
Use NetQ UI for switches without NetQ Agent installed
The workflows vary slightly with each approach:
Using the NetQ UI for switches with NetQ Agent installed, the workflow is:
Using the NetQ CLI for switches with NetQ Agent installed, the workflow is:
Using the NetQ UI for switches without NetQ Agent installed, the workflow is:
Upgrade Cumulus Linux on Switches with NetQ Agent Installed
You can upgrade Cumulus Linux on switches that already have a NetQ Agent (version 2.4.x or later) installed using either the NetQ UI or NetQ CLI.
Prepare for Upgrade
Click (Switches) in any workbench header, then click Manage switches.
Assign a role to each switch (optional, but recommended).
Your LCM dashboard should look similar to this after you have completed these steps:
Create a discovery job to locate Cumulus Linux switches on the network. Use the netq lcm discover command, specifying a single IP address, a range of IP addresses where your switches are located in the network, or a CSV file containing the IP address, and optionally, the hostname and port for each switch on the network. If the port is blank, NetQ uses switch port 22 by default. They can be in any order you like, but the data must match that order.
cumulus@switch:~$ netq lcm discover ip-range 10.0.1.12
NetQ Discovery Started with job id: job_scan_4f3873b0-5526-11eb-97a2-5b3ed2e556db
Verify the switches you want to manage are running NetQ Agent 2.4 or later. Refer to Manage Switches.
Assign a role to each switch (optional, but recommended).
Perform a Cumulus Linux Upgrade
Upgrade Cumulus Linux on switches through either the NetQ UI or NetQ CLI:
Click (Switches) in any workbench header, then select Manage switches.
Click Manage on the Switches card.
Select the individual switches (or click to select all switches) that you want to upgrade. If needed, use the filter to the narrow the listing and find the relevant switches.
Click (Upgrade CL) above the table.
From this point forward, the software walks you through the upgrade process, beginning with a review of the switches that you selected for upgrade.
Give the upgrade job a name. This is required, but can be no more than 22 characters, including spaces and special characters.
Verify that the switches you selected are included, and that they have the correct IP address and roles assigned.
If you accidentally included a switch that you do NOT want to upgrade, hover over the switch information card and click to remove it from the upgrade job.
If the role is incorrect or missing, click , then select a role for that switch from the dropdown. Click to discard a role change.
When you are satisfied that the list of switches is accurate for the job, click Next.
Verify that you want to use the default Cumulus Linux or NetQ version for this upgrade job. If not, click Custom and select an alternate image from the list.
Default CL Version Selected
Custom CL Version Selected
Note that the switch access authentication method, Using global access credentials, indicates you have chosen either basic authentication with a username and password or SSH key-based authentication for all of your switches. Authentication on a per switch basis is not currently available.
Click Next.
Verify the upgrade job options.
By default, NetQ takes a network snapshot before the upgrade and then one after the upgrade is complete. It also performs a roll back to the original Cumulus Linux version on any server which fails to upgrade.
You can exclude selected services and protocols from the snapshots. By default, node and services are included, but you can deselect any of the other items. Click on one to remove it; click again to include it. This is helpful when you are not running a particular protocol or you have concerns about the amount of time it will take to run the snapshot. Note that removing services or protocols from the job might produce non-equivalent results compared with prior snapshots.
While these options provide a smoother upgrade process and are highly recommended, you have the option to disable these options by clicking No next to one or both options.
Click Next.
After the pre-checks have completed successfully, click Preview. If there are failures, refer to Precheck Failures.
These checks verify the following:
Selected switches are not currently scheduled for, or in the middle of, a Cumulus Linux or NetQ Agent upgrade
Selected versions of Cumulus Linux and NetQ Agent are valid upgrade paths
All mandatory parameters have valid values, including MLAG configurations
All switches are reachable
The order to upgrade the switches, based on roles and configurations
Review the job preview.
When all of your switches have roles assigned, this view displays the chosen job options (top center), the pre-checks status (top right and left in Pre-Upgrade Tasks), the order in which the switches are planned for upgrade (center; upgrade starts from the left), and the post-upgrade tasks status (right).
Roles assigned
When none of your switches have roles assigned or they are all of the same role, this view displays the chosen job options (top center), the pre-checks status (top right and left in Pre-Upgrade Tasks), a list of switches planned for upgrade (center), and the post-upgrade tasks status (right).
All roles the same
When some of your switches have roles assigned, any switches without roles get upgraded last and get grouped under the label Stage1.
Some roles assigned
When you are happy with the job specifications, click Start Upgrade.
Click Yes to confirm that you want to continue with the upgrade, or click Cancel to discard the upgrade job.
Perform the upgrade using the netq lcm upgrade cl-image command, providing a name for the upgrade job, the Cumulus Linux and NetQ version, and a comma-separated list of the hostname(s) to be upgraded:
You can also generate a Network Snapshot before and after the upgrade by adding the run-snapshot-before-after option to the command:
cumulus@switch:~$ netq lcm upgrade cl-image name upgrade-430 cl-version 4.3.0 netq-version 4.0.0 hostnames spine01,spine02,leaf01,leaf02 order spine,leaf run-snapshot-before-after
Restore on an Upgrade Failure
You can have LCM restore the previous version of Cumulus Linux if the upgrade job fails by adding the run-restore-on-failure option to the command. This is highly recommended.
cumulus@switch:~$ netq lcm upgrade cl-image name upgrade-430 cl-version 4.3.0 netq-version 4.0.0 hostnames spine01,spine02,leaf01,leaf02 order spine,leaf run-restore-on-failure
Precheck Failures
If one or more of the pre-checks fail, resolve the related issue and start the upgrade again. In the NetQ UI these failures appear on the Upgrade Preview page. In the NetQ CLI, it appears in the form of error messages in the netq lcm show upgrade-jobs cl-image command output.
Expand the following dropdown to view common failures, their causes and corrective actions.
▼
Precheck Failure Messages
Pre-check
Message
Type
Description
Corrective Action
(1) Switch Order
<hostname1> switch cannot be upgraded without isolating <hostname2>, <hostname3> which are connected neighbors. Unable to upgrade
Warning
Switches hostname2 and hostname3 get isolated during an upgrade, making them unreachable. These switches are skipped if you continue with the upgrade.
Reconfigure hostname2 and hostname3 to have redundant connections, or continue with upgrade knowing that connectivity is lost with these switches during the upgrade process.
(2) Version Compatibility
Unable to upgrade <hostname> with CL version <3.y.z> to <4.y.z>
Error
LCM only supports the following Cumulus Linux upgrades:
3.6.z to later versions of 3.y.z
4.x to later versions of 4.y.z
3.6.0 or later to 4.2.0 or later
Perform a fresh install of CL 4.x.
Image not uploaded for the combination: CL Version - <x.y.z>, Asic Vendor - <NVIDIA | Broadcom>, CPU Arch - <x86 | ARM >
Error
The specified Cumulus Linux image is not available in the LCM repository
Restoration image not uploaded for the combination: CL Version - <x.y.z>, Asic Vendor - <Mellanox | Broadcom>, CPU Arch - <x86 | ARM >
Error
The specified Cumulus Linux image needed to restore the switch back to its original version if the upgrade fails is not available in the LCM repository. This applies only when the “Roll back on upgrade failure” job option is selected.
LCM cannot upgrade a switch that is not in its inventory.
Verify you have the correct hostname or IP address for the switch.
Verify the switch has NetQ Agent 2.4.0 or later installed: click , then click Agents in the Network section, view Version column. Upgrade NetQ Agents if needed. Refer to Upgrade NetQ Agents.
Switch <hostname> is rotten. Cannot select for upgrade.
Error
LCM must be able to communicate with the switch to upgrade it.
Troubleshoot the connectivity issue and retry upgrade when the switch is fresh.
Total number of jobs <running jobs count> exceeded Max jobs supported 50
Error
LCM can support a total of 50 upgrade jobs running simultaneously.
Wait for the total number of simultaneous upgrade jobs to drop below 50.
Switch <hostname> is already being upgraded. Cannot initiate another upgrade.
Error
Switch is already a part of another running upgrade job.
Remove switch from current job or wait until the competing job has completed.
Backup failed in previous upgrade attempt for switch <hostname>.
Warning
LCM was unable to back up switch during a previously failed upgrade attempt.
You could back up the switch manually prior to upgrade if you want to restore the switch after upgrade. Refer to Back Up and Restore NetQ.
Restore failed in previous upgrade attempt for switch <hostname>.
Warning
LCM was unable to restore switch after a previously failed upgrade attempt.
One or more switches stopped responding to the MLAG checks.
MLAG configuration checks failed
Error
One or more switches failed the MLAG checks.
For switch <hostname>, the MLAG switch with Role: secondary and ClagSysmac: <MAC address> does not exist.
Error
Identified switch is the primary in an MLAG pair, but the defined secondary switch is not in NetQ inventory.
Verify the switch has NetQ Agent 2.4.0 or later installed: click , then click Agents in the Network section, view Version column. Upgrade NetQ Agent if needed. Refer to Upgrade NetQ Agents. Add the missing peer switch to NetQ inventory.
Analyze Results
After starting the upgrade you can monitor the progress of your upgrade job and the final results. While the views are different, essentially the same information is available from either the NetQ UI or the NetQ CLI.
You can track the progress of your upgrade job from the Preview page or the Upgrade History page of the NetQ UI.
From the preview page, a green circle with rotating arrows appears each step as it is working. Alternately, you can close the detail of the job and see a summary of all current and past upgrade jobs on the Upgrade History page. The job started most recently appears at the bottom, and the data refreshes every minute.
If you get disconnected while the job is in progress, it might appear as if nothing is happening. Try closing (click ) and reopening your view (click ), or refreshing the page.
Several viewing options are available for monitoring the upgrade job.
Monitor the job with full details open on the Preview page:
Single role
Multiple roles and some without roles
Each switch goes through a number of steps. To view these steps, click Details and scroll down as needed. Click collapse the step detail. Click to close the detail popup.
Monitor the job with summary information only in the CL Upgrade History page. Open this view by clicking in the full details view:
This view is refreshed automatically. Click to view what stage the job is in.
Click to view the detailed view.
Monitor the job through the CL Upgrade History card in the Job History tab. Click twice to return to the LCM dashboard. As you perform more upgrades the graph displays the success and failure of each job.
Click View to return to the Upgrade History page as needed.
Sample Successful Upgrade
On successful completion, you can:
Compare the network snapshots taken before and after the upgrade.
Download details about the upgrade in the form of a JSON-formatted file, by clicking Download Report.
View the changes on the Switches card of the LCM dashboard.
Click , then Upgrade Switches.
In our example, all switches have been upgraded to Cumulus Linux 3.7.12.
Sample Failed Upgrade
If an upgrade job fails for any reason, you can view the associated error(s):
From the CL Upgrade History dashboard, find the job of interest.
Click .
Click .
Note in this example, all of the pre-upgrade tasks were successful, but backup failed on the spine switches.
To view what step in the upgrade process failed, click and scroll down. Click to close the step list.
To view details about the errors, either double-click the failed step or click Details and scroll down as needed. Click collapse the step detail. Click to close the detail popup.
To see the progress of current upgrade jobs and the history of previous upgrade jobs, run netq lcm show upgrade-jobs cl-image:
cumulus@switch:~$ netq lcm show upgrade-jobs cl-image
Job ID Name CL Version Pre-Check Status Warnings Errors Start Time
------------ --------------- -------------------- -------------------------------- ---------------- ------------ --------------------
job_cl_upgra Leafs upgr to C 4.2.0 COMPLETED Fri Sep 25 17:16:10
de_ff9c35bc4 L410 2020
950e92cf49ac
bb7eb4fc6e3b
7feca7d82960
570548454c50
cd05802
job_cl_upgra Spines to 4.2.0 4.2.0 COMPLETED Fri Sep 25 16:37:08
de_9b60d3a1f 2020
dd3987f787c7
69fd92f2eef1
c33f56707f65
4a5dfc82e633
dc3b860
job_upgrade_ 3.7.12 Upgrade 3.7.12 WARNING Fri Apr 24 20:27:47
fda24660-866 2020
9-11ea-bda5-
ad48ae2cfafb
job_upgrade_ DataCenter 3.7.12 WARNING Mon Apr 27 17:44:36
81749650-88a 2020
e-11ea-bda5-
ad48ae2cfafb
job_upgrade_ Upgrade to CL3. 3.7.12 COMPLETED Fri Apr 24 17:56:59
4564c160-865 7.12 2020
3-11ea-bda5-
ad48ae2cfafb
To see details of a particular upgrade job, run netq lcm show status job-ID:
cumulus@switch:~$ netq lcm show status job_upgrade_fda24660-8669-11ea-bda5-ad48ae2cfafb
Hostname CL Version Backup Status Backup Start Time Restore Status Restore Start Time Upgrade Status Upgrade Start Time
---------- ------------ --------------- ------------------------ ---------------- ------------------------ ---------------- ------------------------
spine02 4.1.0 FAILED Fri Sep 25 16:37:40 2020 SKIPPED_ON_FAILURE N/A SKIPPED_ON_FAILURE N/A
spine03 4.1.0 FAILED Fri Sep 25 16:37:40 2020 SKIPPED_ON_FAILURE N/A SKIPPED_ON_FAILURE N/A
spine04 4.1.0 FAILED Fri Sep 25 16:37:40 2020 SKIPPED_ON_FAILURE N/A SKIPPED_ON_FAILURE N/A
spine01 4.1.0 FAILED Fri Sep 25 16:40:26 2020 SKIPPED_ON_FAILURE N/A SKIPPED_ON_FAILURE N/A
To see only Cumulus Linux upgrade jobs, run netq lcm show status cl-image job-ID.
Postcheck Failures
A successful upgrade can still have post-check warnings. For example, you updated the OS, but not all services are fully up and running after the upgrade. If one or more of the post-checks fail, warning messages appear in the Post-Upgrade Tasks section of the preview. Click the warning category to view the detailed messages.
Expand the following dropdown to view common failures, their causes and corrective actions.
▼
Post-check Failure Messages
Post-check
Message
Type
Description
Corrective Action
Health of Services
Service <service-name> is missing on Host <hostname> for <VRF default|VRF mgmt>.
Warning
A given service is not yet running on the upgraded host. For example: Service ntp is missing on Host Leaf01 for VRF default.
Wait for up to x more minutes to see if the specified services come up.
Switch Connectivity
Service <service-name> is missing on Host <hostname> for <VRF default|VRF mgmt>.
Warning
A given service is not yet running on the upgraded host. For example: Service ntp is missing on Host Leaf01 for VRF default.
Wait for up to x more minutes to see if the specified services come up.
Reasons for Upgrade Job Failure
Upgrades can fail at any of the stages of the process, including when backing up data, upgrading the Cumulus Linux software, and restoring the data. Failures can occur when attempting to connect to a switch or perform a particular task on the switch.
Some of the common reasons for upgrade failures and the errors they present:
Reason
Error Message
Switch is not reachable via SSH
Data could not be sent to remote host “192.168.0.15.” Make sure this host can be reached over ssh: ssh: connect to host 192.168.0.15 port 22: No route to host
Switch is reachable, but user-provided credentials are invalid
Invalid/incorrect username/password. Skipping remaining 2 retries to prevent account lockout: Warning: Permanently added ‘<hostname-ipaddr>’ to the list of known hosts. Permission denied, please try again.
Upgrade task could not be run
Failure message depends on the why the task could not be run. For example: /etc/network/interfaces: No such file or directory
Upgrade task failed
Failed at- <task that failed>. For example: Failed at- MLAG check for the peerLink interface status
Retry failed after five attempts
FAILED In all retries to process the LCM Job
Upgrade Cumulus Linux on Switches Without NetQ Agent Installed
When you want to update Cumulus Linux on switches without NetQ installed, NetQ provides the LCM switch discovery feature. The feature browses your network to find all Cumulus Linux switches, with and without NetQ currently installed and determines the versions of Cumulus Linux and NetQ installed. The results of switch discovery are then used to install or upgrade Cumulus Linux and NetQ on all discovered switches in a single procedure rather than in two steps. You can run up to five jobs simultaneously; however, a given switch can only appear in one running job at a time.
If all your Cumulus Linux switches already have NetQ 2.4.x or later installed, you can upgrade them directly. Refer to Upgrade Cumulus Linux.
To discover switches running Cumulus Linux and upgrade Cumulus Linux and NetQ on them:
Click (Main Menu) and select Upgrade Switches, or click (Switches) in the workbench header, then click Manage switches.
On the Switches card, click Discover.
Enter a name for the scan.
Choose whether you want to look for switches by entering IP address ranges OR import switches using a comma-separated values (CSV) file.
If you do not have a switch listing, then you can manually add the address ranges where your switches are located in the network. This has the advantage of catching switches that might have been missed in a file.
A maximum of 50 addresses can be included in an address range. If necessary, break the range into smaller ranges.
To discover switches using address ranges:
Enter an IP address range in the IP Range field.
Ranges can be contiguous, for example 192.168.0.24-64, or non-contiguous, for example 192.168.0.24-64,128-190,235, but they must be contained within a single subnet.
Optionally, enter another IP address range (in a different subnet) by clicking .
For example, 198.51.100.0-128 or 198.51.100.0-128,190,200-253.
Add additional ranges as needed. Click to remove a range if needed.
If you decide to use a CSV file instead, the ranges you entered will remain if you return to using IP ranges again.
If you have a file of switches that you want to import, then it can be easier to use that, than to enter the IP address ranges manually.
To import switches through a CSV file:
Click Browse.
Select the CSV file containing the list of switches.
The CSV file must include a header containing hostname, ip, and port. They can be in any order you like, but the data must match that order. For example, a CSV file that represents the Cumulus reference topology could look like this:
or this:
You must have an IP address in your file, but the hostname is optional and if the port is blank, NetQ uses switch port 22 by default.
Click Remove if you decide to use a different file or want to use IP address ranges instead. If you entered ranges before selecting the CSV file option, they remain.
Note that you can use the switch access credentials defined in Manage Switch Credentials to access these switches. If you have issues accessing the switches, you might need to update your credentials.
Click Next.
When the network discovery is complete, NetQ presents the number of Cumulus Linux switches it found. Each switch can be in one of the following categories:
Discovered without NetQ: Switches found without NetQ installed
Discovered with NetQ: Switches found with some version of NetQ installed
Discovered but Rotten: Switches found that are unreachable
Incorrect Credentials: Switches found that cannot are unreachable because the provided access credentials do not match those for the switches
OS not Supported: Switches found that are running Cumulus Linux version not supported by the LCM upgrade feature
Not Discovered: IP addresses which did not have an associated Cumulus Linux switch
If the discovery process does not find any switches for a particular category, then it does not display that category.
Select which switches you want to upgrade from each category by clicking the checkbox on each switch card.
Click Next.
Verify the number of switches identified for upgrade and the configuration profile to be applied is correct.
Accept the default NetQ version or click Custom and select an alternate version.
By default, the NetQ Agent and CLI are upgraded on the selected switches. If you do not want to upgrade the NetQ CLI, click Advanced and change the selection to No.
Click Next.
Several checks are performed to eliminate preventable problems during the install process.
These checks verify the following:
Selected switches are not currently scheduled for, or in the middle of, a Cumulus Linux or NetQ Agent upgrade
Selected versions of Cumulus Linux and NetQ Agent are valid upgrade paths
All mandatory parameters have valid values, including MLAG configurations
All switches are reachable
The order to upgrade the switches, based on roles and configurations
If any of the pre-checks fail, review the error messages and take appropriate action.
If all of the pre-checks pass, click Install to initiate the job.
Monitor the job progress.
After starting the upgrade you can monitor the progress from the preview page or the Upgrade History page.
From the preview page, a green circle with rotating arrows is shown on each switch as it is working. Alternately, you can close the detail of the job and see a summary of all current and past upgrade jobs on the NetQ Install and Upgrade History page. The job started most recently is shown at the top, and the data is refreshed periodically.
If you are disconnected while the job is in progress, it might appear as if nothing is happening. Try closing (click ) and reopening your view (click ), or refreshing the page.
Several viewing options are available for monitoring the upgrade job.
Monitor the job with full details open:
Monitor the job with only summary information in the NetQ Install and Upgrade History page. Open this view by clicking in the full details view; useful when you have multiple jobs running simultaneously
Monitor the job through the NetQ Install and Upgrade History card on the LCM dashboard. Click twice to return to the LCM dashboard.
Investigate any failures and create new jobs to reattempt the upgrade.
If you previously ran a discovery job, as described above, you can show the results of that job by running the netq lcm show discovery-job command.
cumulus@switch:~$ netq lcm show discovery-job job_scan_921f0a40-5440-11eb-97a2-5b3ed2e556db
Scan COMPLETED
Summary
-------
Start Time: 2021-01-11 19:09:47.441000
End Time: 2021-01-11 19:09:59.890000
Total IPs: 1
Completed IPs: 1
Discovered without NetQ: 0
Discovered with NetQ: 0
Incorrect Credentials: 0
OS Not Supported: 0
Not Discovered: 1
Hostname IP Address MAC Address CPU CL Version NetQ Version Config Profile Discovery Status Upgrade Status
----------------- ------------------------- ------------------ -------- ----------- ------------- ---------------------------- ---------------- --------------
N/A 10.0.1.12 N/A N/A N/A N/A [] NOT_FOUND NOT_UPGRADING
cumulus@switch:~$
When the network discovery is complete, NetQ presents the number of Cumulus Linux switches it has found. The output displays their discovery status, which can be one of the following:
Discovered without NetQ: Switches found without NetQ installed
Discovered with NetQ: Switches found with some version of NetQ installed
Discovered but Rotten: Switches found that are unreachable
Incorrect Credentials: Switches found that are unreachable because the provided access credentials do not match those for the switches
OS not Supported: Switches found that are running Cumulus Linux version not supported by the LCM upgrade feature
NOT_FOUND: IP addresses which did not have an associated Cumulus Linux switch
After you determine which switches you need to upgrade, run the upgrade process as described above.
Manage Network Snapshots
Creating and comparing network snapshots can be useful to validate that the network state has not changed. Snapshots are typically created when you upgrade or change the configuration of your switches in some way. This section describes the Snapshot card and content, as well as how to create and compare network snapshots at any time. Snapshots can be automatically created during the upgrade process for Cumulus Linux or SONiC. Refer to Perform a Cumulus Linux Upgrade.
Create a Network Snapshot
It is simple to capture the state of your network currently or for a time in the past using the snapshot feature.
To create a snapshot:
From any workbench in the NetQ UI, click in the workbench header.
Click Create Snapshot.
Enter a name for the snapshot.
Choose the time for the snapshot:
For the current network state, click Now.
For the network state at a previous date and time, click Past, then click in Start Time field to use the calendar to step through selection of the date and time. You might need to scroll down to see the entire calendar.
Choose the services to include in the snapshot.
In the Choose options field, click any service name to remove that service from the snapshot. This would be appropriate if you do not support a particular service, or you are concerned that including that service might cause the snapshot to take an excessive amount of time to complete if included. The checkmark next to the service and the service itself is grayed out when the service is removed. Click any service again to re-include the service in the snapshot. The checkmark is highlighted in green next to the service name and is no longer grayed out.
The Node and Services options are mandatory, and cannot be selected or unselected.
If you remove services, be aware that snapshots taken in the past or future might not be equivalent when performing a network state comparison.
This example removes the OSPF and Route services from the snapshot being created.
Optionally, scroll down and click in the Notes field to add descriptive text for the snapshot to remind you of its purpose. For example: “This was taken before adding MLAG pairs,” or “Taken after removing the leaf36 switch.”
Click Finish.
A medium Snapshot card appears on your desktop. Spinning arrows are visible while it works. When it finishes you can see the number of items that have been captured, and if any failed. This example shows a successful result.
If you have already created other snapshots, Compare is active. Otherwise it is inactive (grayed-out).
When you are finished viewing the snapshot, click Dismiss to close the snapshot. The snapshot is not deleted, merely removed from the workbench.
Compare Network Snapshots
You can compare the state of your network before and after an upgrade or other configuration change to validate that the changes have not created an unwanted change in your network state.
To compare network snapshots:
Create a snapshot (as described in previous section) before you make any changes.
Make your changes.
Create a second snapshot.
Compare the results of the two snapshots.
Depending on what, if any, cards are open on your workbench:
Put the cards next to each other to view a high-level comparison. Scroll down to see all of the items.
To view a more detailed comparison, click Compare on one of the cards. Select the other snapshot from the list.
Click Compare on the open card.
Select the other snapshot to compare.
Click .
Click Compare Snapshots.
Click on the two snapshots you want to compare.
Click Finish. Note that two snapshots must be selected before Finish is active.
In the latter two cases, the large Snapshot card opens. The only difference is in the card title. If you opened the comparison card from a snapshot on your workbench, the title includes the name of that card. If you open the comparison card through the Snapshot menu, the title is generic, indicating a comparison only. Functionally, you have reached the same point.
Scroll down to view all element comparisons.
Interpreting the Comparison Data
For each network element that is compared, count values and changes are shown:
In this example, there are changes to the MAC addresses and neighbors. The snapshot taken before the change (19JanGold) had a total count of 316 MAC addresses and 873 neighbors. The snapshot taken after the changes (Now) has a total count of 320 MAC addresses and 891 neighbors. Between the two totals you can see the number of neighbors added, updated, and removed from one time to the next. This shows four MAC addresses have been added, 9 MAC addresses have been updated, and 18 neighbors have been added.
The coloring does not indicate whether the additional, removal, or update of items is bad or good. It only indicates that a change has occurred.
Be aware that depending on the display order of the snapshots determines what is considered added or removed. Compare these two views of the same data.
More recent snapshot on right
More recent snapshot on left
You can also change which snapshots to compare. Select an alternate snapshot from one or both of the two snapshot dropdowns and then click Compare.
View Change Details
You can view additional details about the changes that have occurred between the two snapshots by clicking View Details. This opens the full screen Detailed Snapshot Comparison card.
From this card you can:
View changes for each of the elements that had added, updated, and removed items, and various information about each; only elements with changes are presented
Filter the added and removed items by clicking
Export all differences in JSON file format by clicking
The following table describes the information provided for each element type when changes are present:
Element
Data Descriptions
BGP
Hostname: Name of the host running the BGP session
VRF: Virtual route forwarding interface if used
BGP Session: Session that was removed or added
ASN: Autonomous system number
CLAG
Hostname: Name of the host running the CLAG session
CLAG Sysmac: MAC address for a bond interface pair that was removed or added
Interface
Hostname: Name of the host where the interface resides
IF Name: Name of the interface that was removed or added
IP Address
Hostname: Name of the host where address was removed or added
Prefix: IP address prefix
Mask: IP address mask
IF Name: Name of the interface that owns the address
Links
Hostname: Name of the host where the link was removed or added
You can decommission a switch or host from the NetQ UI using the Inventory | Devices card. This stops and disables the NetQ Agent service on the device, and decommissions it from the NetQ database.
Expand the Inventory | Devices card to list the devices in the current inventory:
At various points in time, you might want to change which network nodes NetQ monitors or look more closely at a network node for troubleshooting purposes. To learn about adding the NetQ Agent to a switch or host, read Install NetQ.
This topic describes viewing the status of an Agent, disabling an Agent, managing NetQ Agent logging, and configuring the events the agent collects.
View NetQ Agent Status
To view the health of your NetQ Agents, run:
netq [<hostname>] show agents [fresh | dead | rotten | opta] [around <text-time>] [json]
You can view the status for a given switch, host or NetQ Appliance or Virtual Machine. You can also filter by the status and view the status at a time in the past.
To view NetQ Agents that are not communicating, run:
cumulus@switch~:$ netq show agents rotten
No matching agents records found
To view NetQ Agent status on the NetQ appliance or VM, run:
cumulus@switch~:$ netq show agents opta
Matching agents records:
Hostname Status NTP Sync Version Sys Uptime Agent Uptime Reinitialize Time Last Changed
----------------- ---------------- -------- ------------------------------------ ------------------------- ------------------------- -------------------------- -------------------------
netq-ts Fresh yes 3.2.0-ub18.04u30~1601393774.104fb9e Mon Sep 21 16:46:53 2020 Tue Sep 29 21:13:07 2020 Tue Sep 29 21:13:07 2020 Thu Oct 1 16:29:51 2020
View NetQ Agent Configuration
You can view the current configuration of a NetQ Agent to determine what data it collects and where it sends that data. To view this configuration, run:
netq config show agent [kubernetes-monitor|loglevel|stats|sensors|frr-monitor|wjh|wjh-threshold|cpu-limit] [json]
This example shows a NetQ Agent in an on-premises deployment, talking to an appliance or VM at 127.0.0.1 using the default ports and VRF. There is no special configuration to monitor Kubernetes, FRR, interface statistics, sensors, or WJH, and there are no limits on CPU usage or change to the default logging level.
cumulus@switch:~$ netq config show agent
netq-agent value default
--------------------- --------- ---------
exhibitport
exhibiturl
server 127.0.0.1 127.0.0.1
cpu-limit 100 100
agenturl
enable-opta-discovery True True
agentport 8981 8981
port 31980 31980
vrf default default
()
To view the configuration of a particular aspect of a NetQ Agent, use the various options.
This example show a NetQ Agent configured with a CPU limit of 60%.
cumulus@switch:~$ netq config show agent cpu-limit
CPU Quota
-----------
60%
()
Modify the Configuration of the NetQ Agent on a Node
The agent configuration commands enable you to do the following:
Add, Disable, and Remove a NetQ Agent
Start and Stop a NetQ Agent
Configure a NetQ Agent to Collect Selected Data (CPU usage limit, FRR, Kubernetes, sensors, WJH)
Configure a NetQ Agent to Send Data to a Server Cluster
Troubleshoot the NetQ Agent
Commands apply to one agent at a time, and you run them on the switch or host where the NetQ Agent resides.
Add and Remove a NetQ Agent
Adding or removing a NetQ Agent is to add or remove the IP address (and port and VRF when specified) from NetQ configuration file (at /etc/netq/netq.yml). This adds or removes the information about the appliance or VM where the agent sends the data it collects.
To use the NetQ CLI to add or remove a NetQ Agent on a switch or host, run:
netq config add agent server <text-opta-ip> [port <text-opta-port>] [vrf <text-vrf-name>]
netq config del agent server
If you want to use a specific port on the appliance or VM, use the port option. If you want the data sent over a particular virtual route interface, use the vrf option.
This example shows how to add a NetQ Agent and tell it to send the data it collects to the NetQ Appliance or VM at the IPv4 address of 10.0.0.23 using the default port (on-premises = 31980; cloud = 443) and vrf (default).
You can temporarily disable the NetQ Agent on a node. Disabling the NetQ Agent maintains the data already collected in the NetQ database, but stops the NetQ Agent from collecting new data until you reenable it.
To disable a NetQ Agent, run:
cumulus@switch:~$ netq config stop agent
To reenable a NetQ Agent, run:
cumulus@switch:~$ netq config restart agent
Configure a NetQ Agent to Limit Switch CPU Usage
While not typically an issue, you can restrict the NetQ Agent from using more than a configurable amount of the CPU resources. This setting requires Cumulus Linux versions 3.6.x, 3.7.x or 4.1.0 or later to be running on the switch.
You must separate the list of IP addresses by commas, but no spaces. You can optionally specify a port or VRF.
This example configures the NetQ Agent on a switch to send the data to three servers located at 10.0.0.21, 10.0.0.22, and 10.0.0.23 using the rocket VRF.
To stop a NetQ Agent from sending data to a server cluster, run:
cumulus@switch:~$ netq config del agent cluster-servers
Configure Logging to Troubleshoot a NetQ Agent
The logging level used for a NetQ Agent determines what types of events get logged about the NetQ Agent on the switch or host.
First, you need to decide what level of logging you want to configure. You can configure the logging level to be the same for every NetQ Agent, or selectively increase or decrease the logging level for a NetQ Agent on a problematic node.
Logging Level
Description
debug
Sends notifications for all debugging-related, informational, warning, and error messages.
info
Sends notifications for informational, warning, and error messages (default).
warning
Sends notifications for warning and error messages.
error
Sends notifications for errors messages.
You can view the NetQ Agent log directly. Messages have the following structure:
If you set the logging level to debug for troubleshooting, NVIDIA recommends that you either change the logging level to a less heavy mode or completely disable agent logging altogether when you finish troubleshooting.
To change the logging level from debug to another level, run:
The NetQ Agent contains a pre-configured set of modular commands that run periodically and send event and resource data to the NetQ appliance or VM. You can fine tune which events the agent can poll and vary frequency of polling using the NetQ CLI.
For example, if your network is not running OSPF, you can disable the command that polls for OSPF events. Or you can decrease the polling interval for LLDP from the default of 60 seconds to 120 seconds. By not polling for selected data or polling less frequently, you can reduce switch CPU usage by the NetQ Agent.
Depending on the switch platform, the NetQ Agent might not execute some supported protocol commands. For example, if a switch has no VXLAN capability, then the agent skips all VXLAN-related commands.
You cannot create new commands in this release.
Supported Commands
To see the list of supported modular commands, run:
agent_stats: Collects statistics about the NetQ Agent every five (5) minutes.
agent_util_stats: Collects switch CPU and memory utilization by the NetQ Agent every 30 seconds.
cl-support-json: Polls the switch every three (3) minutes to determine if an agent generated a cl-support file.
config-mon-json: Polls the /etc/network/interfaces, /etc/frr/frr.conf, /etc/lldpd.d/README.conf and /etc/ptm.d/topology.dot files every two (2) minutes to determine if the contents of any of these files has changed. If a change occurred, the agent transmits the contents of the file and its modification time to the NetQ appliance or VM.
ports: Polls for optics plugged into the switch every hour.
proc-net-dev: Polls for network statistics on the switch every 30 seconds.
running-config-mon-json: Polls the clagctl parameters every 30 seconds and sends a diff of any changes to the NetQ appliance or VM.
Modify the Polling Frequency
You can change the polling frequency (in seconds) of a modular command. For example, to change the polling frequency of the lldp-json command to 60 seconds from its default of 120 seconds, run:
You can disable any of these commands if they are not needed on your network. This can help reduce the compute resources the NetQ Agent consumes on the switch. For example, if your network does not run OSPF, you can disable the two OSPF commands:
This topic describes how to use the NetQ UI and CLI to monitor your inventory from networkwide and device-specific perspectives.
You can monitor all hardware and software components installed and running on the switches and hosts across the entire network. This is very useful for understanding the dependence on various vendors and versions, when planning upgrades or the scope of any other required changes.
From a networkwide view, you can monitor all switches and hosts at one time, or you can monitor all switches at one time. You cannot currently monitor all hosts at one time separate from switches.
Monitor Networkwide Inventory
With the NetQ UI and CLI, a user can monitor the inventory on a networkwide basis for all switches and hosts, or all switches. Inventory includes such items as the number of each device and its operating system. Additional details are available about the hardware and software components on individual switches, such as the motherboard, ASIC, microprocessor, disk, memory, fan and power supply information. This is extremely useful for understanding the dependence on various vendors and versions when planning upgrades or evaluating the scope of any other required changes.
The commands and cards available to obtain this type of information help you to answer questions such as:
What switches are being monitored in the network?
What is the distribution of ASICs, CPUs, Agents, and so forth across my network?
The NetQ UI provides the Inventory|Devices card for monitoring networkwide inventory information for all switches and hosts. The Inventory|Switches card provides a more detailed view of inventory information for all switches (no hosts) on a networkwide basis.
Access these card from the NetQ Workbench, or add them to your own workbench by clicking (Add card) > Inventory > Inventory|Devices card or Inventory|Switches card > Open Cards.
The NetQ CLI provides detailed network inventory information through its netq show inventory command.
View Networkwide Inventory Summary
You can view all devices in your network from either the NetQ UI or NetQ CLI.
View the Number of Each Device Type in Your Network
You can view the number of switches and hosts deployed in your network. As you grow your network this can be useful for validating the addition of devices as scheduled.
To view the quantity of devices in your network, locate or open the small or medium Inventory|Devices card. The medium-sized card provide operating system distribution across the network in addition to the device count.
View All Switches
You can view all stored attributes for all switches in your network from either inventory card:
Open the full-screen Inventory|Devices card and click All Switches
Open the full-screen Inventory|Switches card and click Show All
To return to your workbench, click in the top right corner of the card.
View All Hosts
You can view all stored attributes for all hosts in your network. To view all host details, open the full screen Inventory|Devices card and click All Hosts.
To return to your workbench, click in the top right corner of the card.
To view a list of devices in your network, run:
netq show inventory brief [json]
This example shows that there are four spine switches, three leaf switches, two border switches, two firewall switches, seven hosts (servers), and an out-of-band management server in this network. For each of these you see the type of switch, operating system, CPU and ASIC.
You can view hardware components deployed on all switches and hosts, or on all switches in your network.
View Components Summary
It can be useful to know the quantity and ratio of many components deployed in your network to determine the scope of upgrade tasks, balance vendor reliance, or for detailed troubleshooting. Hardware and software component summary information is available from the NetQ UI and NetQ CLI.
Inventory|Devices card: view ASIC, NetQ Agent version, OS, and platform information on all devices
Inventory|Switches card: view ASIC, CPU, disk, NetQ Agent version, OS, and platform information on all switches
netq show inventory command: view ASIC, CPU, disk, OS, and ports on all devices
Locate the Inventory|Devices card on your workbench.
Hover over the card, and change to the large size card using the size picker.
By default the Switches tab shows the total number of switches, ASIC vendors, OS versions, NetQ Agent versions, and specific platforms deployed across all your switches.
You can hover over any of the segments in a component distribution chart to highlight a specific type of the given component. When you hover, a tooltip appears displaying:
Name or value of the component type, such as the version number or status
Total number of switches with that type of component deployed compared to the total number of switches
Percentage of this type as compared to all component types
Additionally, sympathetic highlighting is used to show the related component types relevant to the highlighted segment and the number of unique component types associated with this type (shown in light gray here).
Locate the Inventory|Switches card on your workbench.
Select a specific component from the dropdown menu.
Hover over any of the segments in the distribution chart to highlight a specific component.
When you hover, a tooltip appears displaying:
Name or value of the component type, such as the version number or status
Total number of switches with that type of component deployed compared to the total number of switches
Percentage of this type with respect to all component types
Change to the large size card. The same information is shown separated by hardware and software, and sympathetic highlighting is used to show the related component types relevant to the highlighted segment and the number of unique component types associated with this type (shown in blue here).
To view switch components, run:
netq show inventory brief [json]
This example shows the operating systems (Cumulus Linux and Ubuntu), CPU architecture (all x86_64), ASIC (virtual), and ports (N/A because Cumulus VX is virtual) for each device in the network. You can manually count the number of each of these, or export to a spreadsheet tool to sort and filter the list.
ASIC information is available from the NetQ UI and NetQ CLI.
Inventory|Devices card
Large: view ASIC distribution across all switches (graphic)
Full-screen: view ASIC vendor, model, model ID, ports, core bandwidth across all devices (table)
Inventory|Switches card
Medium/Large: view ASIC distribution across all switches (graphic)
Full-screen: view ASIC vendor, model, model ID, ports, core bandwidth and data across all switches (table)
netq show inventory asic command
View ASIC vendor, model, model ID, core bandwidth, and ports on all devices
Locate the medium Inventory|Devices card on your workbench.
Hover over the card, and change to the large size card using the size picker.
Click a segment of the ASIC graph in the component distribution charts.
Select the first option from the popup, Filter ASIC. The card data is filtered to show only the components associated with selected component type. A filter tag appears next to the total number of switches indicating the filter criteria.
Hover over the segments to view the related components.
To return to the full complement of components, click the in the filter tag.
Hover over the card, and change to the full-screen card using the size picker.
Scroll to the right to view the above ASIC information.
To return to your workbench, click in the top right corner of the card.
Locate the Inventory|Switches card on your workbench.
Hover over a segment of the ASIC graph in the distribution chart.
The same information is available on the summary tab of the large size card.
Hover over the card header and click to view the ASIC vendor and model distribution.
Hover over charts to view the name of the ASIC vendors or models, how many switches have that vendor or model deployed, and the percentage of this number compared to the total number of switches.
Change to the full-screen card to view all of the available ASIC information. Note that if you are running CumulusVX switches, no detailed ASIC information is available.
To return to your workbench, click in the top right corner of the card.
To view information about the ASIC installed on your devices, run:
netq show inventory asic [vendor <asic-vendor>|model <asic-model>|model-id <asic-model-id>] [json]
If you are running NetQ on a CumulusVX setup, there is no physical hardware to query and thus no ASIC information to display.
This example shows the ASIC information for all devices in your network:
cumulus@switch:~$ netq show inventory asic
Matching inventory records:
Hostname Vendor Model Model ID Core BW Ports
----------------- -------------------- ------------------------------ ------------------------- -------------- -----------------------------------
dell-z9100-05 Broadcom Tomahawk BCM56960 2.0T 32 x 100G-QSFP28
mlx-2100-05 Mellanox Spectrum MT52132 N/A 16 x 100G-QSFP28
mlx-2410a1-05 Mellanox Spectrum MT52132 N/A 48 x 25G-SFP28 & 8 x 100G-QSFP28
mlx-2700-11 Mellanox Spectrum MT52132 N/A 32 x 100G-QSFP28
qct-ix1-08 Broadcom Tomahawk BCM56960 2.0T 32 x 100G-QSFP28
qct-ix7-04 Broadcom Trident3 BCM56870 N/A 32 x 100G-QSFP28
st1-l1 Broadcom Trident2 BCM56854 720G 48 x 10G-SFP+ & 6 x 40G-QSFP+
st1-l2 Broadcom Trident2 BCM56854 720G 48 x 10G-SFP+ & 6 x 40G-QSFP+
st1-l3 Broadcom Trident2 BCM56854 720G 48 x 10G-SFP+ & 6 x 40G-QSFP+
st1-s1 Broadcom Trident2 BCM56850 960G 32 x 40G-QSFP+
st1-s2 Broadcom Trident2 BCM56850 960G 32 x 40G-QSFP+
You can filter the results of the command to view devices with a particular vendor, model, or modelID. This example shows ASIC information for all devices with a vendor of NVIDIA.
cumulus@switch:~$ netq show inventory asic vendor NVIDIA
Matching inventory records:
Hostname Vendor Model Model ID Core BW Ports
----------------- -------------------- ------------------------------ ------------------------- -------------- -----------------------------------
mlx-2100-05 NVIDIA Spectrum MT52132 N/A 16 x 100G-QSFP28
mlx-2410a1-05 NVIDIA Spectrum MT52132 N/A 48 x 25G-SFP28 & 8 x 100G-QSFP28
mlx-2700-11 NVIDIA Spectrum MT52132 N/A 32 x 100G-QSFP28
View Motherboard/Platform Information
Motherboard and platform information is available from the NetQ UI and NetQ CLI.
Inventory|Devices card
Full-screen: view platform vendor, model, manufacturing date, revision, serial number, MAC address, series across all devices (table)
Inventory|Switches card
Medium/Large: view platform distribution across on all switches (graphic)
Full-screen: view platform vendor, model, manufacturing date, revision, serial number, MAC address, series across all switches (table)
netq show inventory board command
View motherboard vendor, model, base MAC address, serial number, part number, revision, and manufacturing date on all devices
Locate the Inventory|Devices card on your workbench.
Hover over the card, and change to the full-screen card using the size picker.
The All Switches tab is active by default. Scroll to the right to view the various Platform parameters for your switches. Optionally drag and drop the relevant columns next to each other.
Click All Hosts.
Scroll to the right to view the various Platform parameters for your hosts. Optionally drag and drop the relevant columns next to each other.
To return to your workbench, click in the top right corner of the card.
Locate the Inventory|Switches card on your workbench.
Hover over the card, and change to the large card using the size picker.
Hover over the header and click .
Hover over a segment in the Vendor or Platform graphic to view how many switches deploy the specified vendor or platform.
Context sensitive highlighting is also employed here, such that when you select a vendor, the corresponding platforms are also highlighted; and vice versa.
Click either Show All link to open the full-screen card.
Click Platform.
To return to your workbench, click in the top right corner of the card.
To view a list of motherboards installed in your switches and hosts, run:
netq show inventory board [vendor <board-vendor>|model <board-model>] [json]
This example shows all motherboard data for all devices.
You can filter the results of the command to capture only those devices with a particular motherboard vendor or model. This example shows only the devices with a Celestica motherboard.
cumulus@switch:~$ netq show inventory board vendor celestica
Matching inventory records:
Hostname Vendor Model Base MAC Serial No Part No Rev Mfg Date
----------------- -------------------- ------------------------------ ------------------ ------------------------- ---------------- ------ ----------
st1-l1 CELESTICA Arctica 4806xp 00:E0:EC:27:71:37 D2060B2F044919GD000011 R0854-F1004-01 Redsto 09/20/2014
ne-XP
st1-l2 CELESTICA Arctica 4806xp 00:E0:EC:27:6B:3A D2060B2F044919GD000060 R0854-F1004-01 Redsto 09/20/2014
ne-XP
View CPU Information
CPU information is available from the NetQ UI and NetQ CLI.
Inventory|Devices card
Full-screen: view CPU architecture, model, maximum operating frequency, and the number of cores on all devices (table)
Inventory|Switches card
Medium/Large: view CPU distribution across on all switches (graphic)
Full-screen: view CPU architecture, model, maximum operating frequency, the number of cores, and data on all switches (table)
netq show inventory cpu command
View CPU architecture, model, maximum operating frequency, and the number of cores on all devices
Locate the Inventory|Devices card on your workbench.
Hover over the card, and change to the full-screen card using the size picker.
The All Switches tab is active by default. Scroll to the right to view the various CPU parameters. Optionally drag and drop relevant columns next to each other.
Click All Hosts to view the CPU information for your host servers.
To return to your workbench, click in the top right corner of the card.
Locate the Inventory|Switches card on your workbench.
Hover over a segment of the CPU graph in the distribution chart.
The same information is available on the summary tab of the large size card.
Hover over the card, and change to the full-screen card using the size picker.
Click CPU.
To return to your workbench, click in the top right corner of the card.
To view CPU information for all devices in your network, run:
netq show inventory cpu [arch <cpu-arch>] [json]
This example shows the CPU information for all devices.
You can filter the results of the command to view which switches employ a particular CPU architecture using the arch keyword. This example shows how to determine all the currently deployed architectures in your network, and then shows all devices with an x86_64 architecture.
You can filter the results of the command to view devices with a particular memory type or vendor. This example shows all the devices with memory from QEMU .
cumulus@switch:~$ netq show inventory memory vendor QEMU
Matching inventory records:
Hostname Name Type Size Speed Vendor Serial No
----------------- --------------- ---------------- ---------- ---------- -------------------- -------------------------
leaf01 DIMM 0 RAM 1024 MB Unknown QEMU Not Specified
leaf02 DIMM 0 RAM 1024 MB Unknown QEMU Not Specified
leaf03 DIMM 0 RAM 1024 MB Unknown QEMU Not Specified
leaf04 DIMM 0 RAM 1024 MB Unknown QEMU Not Specified
oob-mgmt-server DIMM 0 RAM 4096 MB Unknown QEMU Not Specified
server01 DIMM 0 RAM 512 MB Unknown QEMU Not Specified
server02 DIMM 0 RAM 512 MB Unknown QEMU Not Specified
server03 DIMM 0 RAM 512 MB Unknown QEMU Not Specified
server04 DIMM 0 RAM 512 MB Unknown QEMU Not Specified
spine01 DIMM 0 RAM 1024 MB Unknown QEMU Not Specified
spine02 DIMM 0 RAM 1024 MB Unknown QEMU Not Specified
View Sensor Information
Fan, power supply unit (PSU), and temperature sensors are available to provide additional data about the NetQ system operation.
Sensor information is available from the NetQ UI and NetQ CLI.
PSU Sensor card: view sensor name, current/previous state, input/output power, and input/output voltage on all devices (table)
Fan Sensor card: view sensor name, description, current/maximum/minimum speed, and current/previous state on all devices (table)
Temperature Sensor card: view sensor name, description, minimum/maximum threshold, current/critical(maximum)/lower critical (minimum) threshold, and current/previous state on all devices (table)
netq show sensors: view sensor name, description, current state, and time when data was last changed on all devices for all or one sensor type
Power Supply Unit Information
Click (main menu), then click Sensors in the Network heading.
The PSU tab is displayed by default.
PSU Parameter
Description
Hostname
Name of the switch or host where the power supply is installed
Timestamp
Date and time the data was captured
Message Type
Type of sensor message; always PSU in this table
PIn(W)
Input power (Watts) for the PSU on the switch or host
POut(W)
Output power (Watts) for the PSU on the switch or host
Sensor Name
User-defined name for the PSU
Previous State
State of the PSU when data was captured in previous window
State
State of the PSU when data was last captured
VIn(V)
Input voltage (Volts) for the PSU on the switch or host
VOut(V)
Output voltage (Volts) for the PSU on the switch or host
To return to your workbench, click in the top right corner of the card.
Fan Information
Click (main menu), then click Sensors in the Network heading.
Click Fan.
Fan Parameter
Description
Hostname
Name of the switch or host where the fan is installed
Timestamp
Date and time the data was captured
Message Type
Type of sensor message; always Fan in this table
Description
User specified description of the fan
Speed (RPM)
Revolution rate of the fan (revolutions per minute)
Max
Maximum speed (RPM)
Min
Minimum speed (RPM)
Message
Message
Sensor Name
User-defined name for the fan
Previous State
State of the fan when data was captured in previous window
State
State of the fan when data was last captured
To return to your workbench, click in the top right corner of the card.
Temperature Information
Click (main menu), then click Sensors in the Network heading.
Click Temperature.
Temperature Parameter
Description
Hostname
Name of the switch or host where the temperature sensor is installed
Timestamp
Date and time the data was captured
Message Type
Type of sensor message; always Temp in this table
Critical
Current critical maximum temperature (°C) threshold setting
Description
User specified description of the temperature sensor
Lower Critical
Current critical minimum temperature (°C) threshold setting
Max
Maximum temperature threshold setting
Min
Minimum temperature threshold setting
Message
Message
Sensor Name
User-defined name for the temperature sensor
Previous State
State of the fan when data was captured in previous window
State
State of the fan when data was last captured
Temperature(Celsius)
Current temperature (°C) measured by sensor
To return to your workbench, click in the top right corner of the card.
View All Sensor Information
To view information for power supplies, fans, and temperature sensors on all switches and host servers, run:
netq show sensors all [around <text-time>] [json]
Use the around option to view sensor information for a time in the past.
This example shows all sensors on all devices.
cumulus@switch:~$ netq show sensors all
Matching sensors records:
Hostname Name Description State Message Last Changed
----------------- --------------- ----------------------------------- ---------- ----------------------------------- -------------------------
border01 fan5 fan tray 3, fan 1 ok Fri Aug 21 18:51:11 2020
border01 fan6 fan tray 3, fan 2 ok Fri Aug 21 18:51:11 2020
border01 fan1 fan tray 1, fan 1 ok Fri Aug 21 18:51:11 2020
...
fw1 fan2 fan tray 1, fan 2 ok Thu Aug 20 19:16:12 2020
...
fw2 fan3 fan tray 2, fan 1 ok Thu Aug 20 19:14:47 2020
...
leaf01 psu2fan1 psu2 fan ok Fri Aug 21 16:14:22 2020
...
leaf02 fan3 fan tray 2, fan 1 ok Fri Aug 21 16:14:14 2020
...
leaf03 fan2 fan tray 1, fan 2 ok Fri Aug 21 09:37:45 2020
...
leaf04 psu1fan1 psu1 fan ok Fri Aug 21 09:17:02 2020
...
spine01 psu2fan1 psu2 fan ok Fri Aug 21 05:54:14 2020
...
spine02 fan2 fan tray 1, fan 2 ok Fri Aug 21 05:54:39 2020
...
spine03 fan4 fan tray 2, fan 2 ok Fri Aug 21 06:00:52 2020
...
spine04 fan2 fan tray 1, fan 2 ok Fri Aug 21 05:54:09 2020
...
border01 psu1temp1 psu1 temp sensor ok Fri Aug 21 18:51:11 2020
border01 temp2 board sensor near virtual switch ok Fri Aug 21 18:51:11 2020
border01 temp3 board sensor at front left corner ok Fri Aug 21 18:51:11 2020
...
border02 temp1 board sensor near cpu ok Fri Aug 21 18:46:05 2020
...
fw1 temp4 board sensor at front right corner ok Thu Aug 20 19:16:12 2020
...
fw2 temp5 board sensor near fan ok Thu Aug 20 19:14:47 2020
...
leaf01 psu1temp1 psu1 temp sensor ok Fri Aug 21 16:14:22 2020
...
leaf02 temp5 board sensor near fan ok Fri Aug 21 16:14:14 2020
...
leaf03 psu2temp1 psu2 temp sensor ok Fri Aug 21 09:37:45 2020
...
leaf04 temp4 board sensor at front right corner ok Fri Aug 21 09:17:02 2020
...
spine01 psu1temp1 psu1 temp sensor ok Fri Aug 21 05:54:14 2020
...
spine02 temp3 board sensor at front left corner ok Fri Aug 21 05:54:39 2020
...
spine03 temp1 board sensor near cpu ok Fri Aug 21 06:00:52 2020
...
spine04 temp3 board sensor at front left corner ok Fri Aug 21 05:54:09 2020
...
border01 psu1 N/A ok Fri Aug 21 18:51:11 2020
border01 psu2 N/A ok Fri Aug 21 18:51:11 2020
border02 psu1 N/A ok Fri Aug 21 18:46:05 2020
border02 psu2 N/A ok Fri Aug 21 18:46:05 2020
fw1 psu1 N/A ok Thu Aug 20 19:16:12 2020
fw1 psu2 N/A ok Thu Aug 20 19:16:12 2020
fw2 psu1 N/A ok Thu Aug 20 19:14:47 2020
fw2 psu2 N/A ok Thu Aug 20 19:14:47 2020
leaf01 psu1 N/A ok Fri Aug 21 16:14:22 2020
leaf01 psu2 N/A ok Fri Aug 21 16:14:22 2020
leaf02 psu1 N/A ok Fri Aug 21 16:14:14 2020
leaf02 psu2 N/A ok Fri Aug 21 16:14:14 2020
leaf03 psu1 N/A ok Fri Aug 21 09:37:45 2020
leaf03 psu2 N/A ok Fri Aug 21 09:37:45 2020
leaf04 psu1 N/A ok Fri Aug 21 09:17:02 2020
leaf04 psu2 N/A ok Fri Aug 21 09:17:02 2020
spine01 psu1 N/A ok Fri Aug 21 05:54:14 2020
spine01 psu2 N/A ok Fri Aug 21 05:54:14 2020
spine02 psu1 N/A ok Fri Aug 21 05:54:39 2020
spine02 psu2 N/A ok Fri Aug 21 05:54:39 2020
spine03 psu1 N/A ok Fri Aug 21 06:00:52 2020
spine03 psu2 N/A ok Fri Aug 21 06:00:52 2020
spine04 psu1 N/A ok Fri Aug 21 05:54:09 2020
spine04 psu2 N/A ok Fri Aug 21 05:54:09 2020
View Only Power Supply Sensors
To view information from all PSU sensors or PSU sensors with a given name on your switches and host servers, run:
netq show sensors psu [<psu-name>] [around <text-time>] [json]
Use the psu-name option to view all PSU sensors with a particular name. Use the around option to view sensor information for a time in the past.
Use Tab completion to determine the names of the PSUs in your switches.
cumulus@switch:~$ netq show sensors psu <press tab>
around : Go back in time to around ...
json : Provide output in JSON
psu1 : Power Supply
psu2 : Power Supply
<ENTER>
This example shows information from all PSU sensors on all switches and hosts.
cumulus@switch:~$ netq show sensor psu
Matching sensors records:
Hostname Name State Pin(W) Pout(W) Vin(V) Vout(V) Message Last Changed
----------------- --------------- ---------- ------------ -------------- ------------ -------------- ----------------------------------- -------------------------
border01 psu1 ok Tue Aug 25 21:45:21 2020
border01 psu2 ok Tue Aug 25 21:45:21 2020
border02 psu1 ok Tue Aug 25 21:39:36 2020
border02 psu2 ok Tue Aug 25 21:39:36 2020
fw1 psu1 ok Wed Aug 26 00:08:01 2020
fw1 psu2 ok Wed Aug 26 00:08:01 2020
fw2 psu1 ok Wed Aug 26 00:02:13 2020
fw2 psu2 ok Wed Aug 26 00:02:13 2020
leaf01 psu1 ok Wed Aug 26 16:14:41 2020
leaf01 psu2 ok Wed Aug 26 16:14:41 2020
leaf02 psu1 ok Wed Aug 26 16:14:08 2020
leaf02 psu2 ok Wed Aug 26 16:14:08 2020
leaf03 psu1 ok Wed Aug 26 14:41:57 2020
leaf03 psu2 ok Wed Aug 26 14:41:57 2020
leaf04 psu1 ok Wed Aug 26 14:20:22 2020
leaf04 psu2 ok Wed Aug 26 14:20:22 2020
spine01 psu1 ok Wed Aug 26 10:53:17 2020
spine01 psu2 ok Wed Aug 26 10:53:17 2020
spine02 psu1 ok Wed Aug 26 10:54:07 2020
spine02 psu2 ok Wed Aug 26 10:54:07 2020
spine03 psu1 ok Wed Aug 26 11:00:44 2020
spine03 psu2 ok Wed Aug 26 11:00:44 2020
spine04 psu1 ok Wed Aug 26 10:52:00 2020
spine04 psu2 ok Wed Aug 26 10:52:00 2020
This example shows all PSUs with the name psu2.
cumulus@switch:~$ netq show sensors psu psu2
Matching sensors records:
Hostname Name State Message Last Changed
----------------- --------------- ---------- ----------------------------------- -------------------------
exit01 psu2 ok Fri Apr 19 16:01:17 2019
exit02 psu2 ok Fri Apr 19 16:01:33 2019
leaf01 psu2 ok Sun Apr 21 20:07:12 2019
leaf02 psu2 ok Fri Apr 19 16:01:41 2019
leaf03 psu2 ok Fri Apr 19 16:01:44 2019
leaf04 psu2 ok Fri Apr 19 16:01:36 2019
spine01 psu2 ok Fri Apr 19 16:01:52 2019
spine02 psu2 ok Fri Apr 19 16:01:08 2019
View Only Fan Sensors
To view information from all fan sensors or fan sensors with a given name on your switches and host servers, run:
netq show sensors fan [<fan-name>] [around <text-time>] [json]
Use the around option to view sensor information for a time in the past.
Use tab completion to determine the names of the fans in your switches:
cumulus@switch:~$ netq show sensors fan <<press tab>>
around : Go back in time to around ...
fan1 : Fan Name
fan2 : Fan Name
fan3 : Fan Name
fan4 : Fan Name
fan5 : Fan Name
fan6 : Fan Name
json : Provide output in JSON
psu1fan1 : Fan Name
psu2fan1 : Fan Name
<ENTER>
This example shows the state of all fans.
cumulus@switch:~$ netq show sensor fan
Matching sensors records:
Hostname Name Description State Speed Max Min Message Last Changed
----------------- --------------- ----------------------------------- ---------- ---------- -------- -------- ----------------------------------- -------------------------
border01 fan5 fan tray 3, fan 1 ok 2500 29000 2500 Tue Aug 25 21:45:21 2020
border01 fan6 fan tray 3, fan 2 ok 2500 29000 2500 Tue Aug 25 21:45:21 2020
border01 fan1 fan tray 1, fan 1 ok 2500 29000 2500 Tue Aug 25 21:45:21 2020
border01 fan4 fan tray 2, fan 2 ok 2500 29000 2500 Tue Aug 25 21:45:21 2020
border01 psu1fan1 psu1 fan ok 2500 29000 2500 Tue Aug 25 21:45:21 2020
border01 fan3 fan tray 2, fan 1 ok 2500 29000 2500 Tue Aug 25 21:45:21 2020
border01 fan2 fan tray 1, fan 2 ok 2500 29000 2500 Tue Aug 25 21:45:21 2020
border01 psu2fan1 psu2 fan ok 2500 29000 2500 Tue Aug 25 21:45:21 2020
border02 fan2 fan tray 1, fan 2 ok 2500 29000 2500 Tue Aug 25 21:39:36 2020
border02 psu2fan1 psu2 fan ok 2500 29000 2500 Tue Aug 25 21:39:36 2020
border02 psu1fan1 psu1 fan ok 2500 29000 2500 Tue Aug 25 21:39:36 2020
border02 fan4 fan tray 2, fan 2 ok 2500 29000 2500 Tue Aug 25 21:39:36 2020
border02 fan1 fan tray 1, fan 1 ok 2500 29000 2500 Tue Aug 25 21:39:36 2020
border02 fan6 fan tray 3, fan 2 ok 2500 29000 2500 Tue Aug 25 21:39:36 2020
border02 fan5 fan tray 3, fan 1 ok 2500 29000 2500 Tue Aug 25 21:39:36 2020
border02 fan3 fan tray 2, fan 1 ok 2500 29000 2500 Tue Aug 25 21:39:36 2020
fw1 fan2 fan tray 1, fan 2 ok 2500 29000 2500 Wed Aug 26 00:08:01 2020
fw1 fan5 fan tray 3, fan 1 ok 2500 29000 2500 Wed Aug 26 00:08:01 2020
fw1 psu1fan1 psu1 fan ok 2500 29000 2500 Wed Aug 26 00:08:01 2020
fw1 fan4 fan tray 2, fan 2 ok 2500 29000 2500 Wed Aug 26 00:08:01 2020
fw1 fan3 fan tray 2, fan 1 ok 2500 29000 2500 Wed Aug 26 00:08:01 2020
fw1 psu2fan1 psu2 fan ok 2500 29000 2500 Wed Aug 26 00:08:01 2020
fw1 fan6 fan tray 3, fan 2 ok 2500 29000 2500 Wed Aug 26 00:08:01 2020
fw1 fan1 fan tray 1, fan 1 ok 2500 29000 2500 Wed Aug 26 00:08:01 2020
fw2 fan3 fan tray 2, fan 1 ok 2500 29000 2500 Wed Aug 26 00:02:13 2020
fw2 psu2fan1 psu2 fan ok 2500 29000 2500 Wed Aug 26 00:02:13 2020
fw2 fan2 fan tray 1, fan 2 ok 2500 29000 2500 Wed Aug 26 00:02:13 2020
fw2 fan6 fan tray 3, fan 2 ok 2500 29000 2500 Wed Aug 26 00:02:13 2020
fw2 fan1 fan tray 1, fan 1 ok 2500 29000 2500 Wed Aug 26 00:02:13 2020
fw2 fan4 fan tray 2, fan 2 ok 2500 29000 2500 Wed Aug 26 00:02:13 2020
fw2 fan5 fan tray 3, fan 1 ok 2500 29000 2500 Wed Aug 26 00:02:13 2020
fw2 psu1fan1 psu1 fan ok 2500 29000 2500 Wed Aug 26 00:02:13 2020
leaf01 psu2fan1 psu2 fan ok 2500 29000 2500 Wed Aug 26 16:14:41 2020
leaf01 fan5 fan tray 3, fan 1 ok 2500 29000 2500 Wed Aug 26 16:14:41 2020
leaf01 fan3 fan tray 2, fan 1 ok 2500 29000 2500 Wed Aug 26 16:14:41 2020
leaf01 fan1 fan tray 1, fan 1 ok 2500 29000 2500 Wed Aug 26 16:14:41 2020
leaf01 fan6 fan tray 3, fan 2 ok 2500 29000 2500 Wed Aug 26 16:14:41 2020
leaf01 fan2 fan tray 1, fan 2 ok 2500 29000 2500 Wed Aug 26 16:14:41 2020
leaf01 psu1fan1 psu1 fan ok 2500 29000 2500 Wed Aug 26 16:14:41 2020
leaf01 fan4 fan tray 2, fan 2 ok 2500 29000 2500 Wed Aug 26 16:14:41 2020
leaf02 fan3 fan tray 2, fan 1 ok 2500 29000 2500 Wed Aug 26 16:14:08 2020
...
spine04 fan4 fan tray 2, fan 2 ok 2500 29000 2500 Wed Aug 26 10:52:00 2020
spine04 psu1fan1 psu1 fan ok 2500 29000 2500 Wed Aug 26 10:52:00 2020
This example shows the state of all fans with the name fan1.
cumulus@switch~$ netq show sensors fan fan1
Matching sensors records:
Hostname Name Description State Speed Max Min Message Last Changed
----------------- --------------- ----------------------------------- ---------- ---------- -------- -------- ----------------------------------- -------------------------
border01 fan1 fan tray 1, fan 1 ok 2500 29000 2500 Tue Aug 25 21:45:21 2020
border02 fan1 fan tray 1, fan 1 ok 2500 29000 2500 Tue Aug 25 21:39:36 2020
fw1 fan1 fan tray 1, fan 1 ok 2500 29000 2500 Wed Aug 26 00:08:01 2020
fw2 fan1 fan tray 1, fan 1 ok 2500 29000 2500 Wed Aug 26 00:02:13 2020
leaf01 fan1 fan tray 1, fan 1 ok 2500 29000 2500 Tue Aug 25 18:30:07 2020
leaf02 fan1 fan tray 1, fan 1 ok 2500 29000 2500 Tue Aug 25 18:08:38 2020
leaf03 fan1 fan tray 1, fan 1 ok 2500 29000 2500 Tue Aug 25 21:20:34 2020
leaf04 fan1 fan tray 1, fan 1 ok 2500 29000 2500 Wed Aug 26 14:20:22 2020
spine01 fan1 fan tray 1, fan 1 ok 2500 29000 2500 Wed Aug 26 10:53:17 2020
spine02 fan1 fan tray 1, fan 1 ok 2500 29000 2500 Wed Aug 26 10:54:07 2020
spine03 fan1 fan tray 1, fan 1 ok 2500 29000 2500 Wed Aug 26 11:00:44 2020
spine04 fan1 fan tray 1, fan 1 ok 2500 29000 2500 Wed Aug 26 10:52:00 2020
View Only Temperature Sensors
To view information from all temperature sensors or temperature sensors with a given name on your switches and host servers, run:
netq show sensors temp [<temp-name>] [around <text-time>] [json]
Use the around option to view sensor information for a time in the past.
Use tab completion to determine the names of the temperature sensors on your devices:
cumulus@switch:~$ netq show sensors temp <press tab>
around : Go back in time to around ...
json : Provide output in JSON
psu1temp1 : Temp Name
psu2temp1 : Temp Name
temp1 : Temp Name
temp2 : Temp Name
temp3 : Temp Name
temp4 : Temp Name
temp5 : Temp Name
<ENTER>
This example shows the state of all temperature sensors.
cumulus@switch:~$ netq show sensor temp
Matching sensors records:
Hostname Name Description State Temp Critical Max Min Message Last Changed
----------------- --------------- ----------------------------------- ---------- -------- -------- -------- -------- ----------------------------------- -------------------------
border01 psu1temp1 psu1 temp sensor ok 25 85 80 5 Tue Aug 25 21:45:21 2020
border01 temp2 board sensor near virtual switch ok 25 85 80 5 Tue Aug 25 21:45:21 2020
border01 temp3 board sensor at front left corner ok 25 85 80 5 Tue Aug 25 21:45:21 2020
border01 temp1 board sensor near cpu ok 25 85 80 5 Tue Aug 25 21:45:21 2020
border01 temp4 board sensor at front right corner ok 25 85 80 5 Tue Aug 25 21:45:21 2020
border01 psu2temp1 psu2 temp sensor ok 25 85 80 5 Tue Aug 25 21:45:21 2020
border01 temp5 board sensor near fan ok 25 85 80 5 Tue Aug 25 21:45:21 2020
border02 temp1 board sensor near cpu ok 25 85 80 5 Tue Aug 25 21:39:36 2020
border02 temp5 board sensor near fan ok 25 85 80 5 Tue Aug 25 21:39:36 2020
border02 temp3 board sensor at front left corner ok 25 85 80 5 Tue Aug 25 21:39:36 2020
border02 temp4 board sensor at front right corner ok 25 85 80 5 Tue Aug 25 21:39:36 2020
border02 psu2temp1 psu2 temp sensor ok 25 85 80 5 Tue Aug 25 21:39:36 2020
border02 psu1temp1 psu1 temp sensor ok 25 85 80 5 Tue Aug 25 21:39:36 2020
border02 temp2 board sensor near virtual switch ok 25 85 80 5 Tue Aug 25 21:39:36 2020
fw1 temp4 board sensor at front right corner ok 25 85 80 5 Wed Aug 26 00:08:01 2020
fw1 temp3 board sensor at front left corner ok 25 85 80 5 Wed Aug 26 00:08:01 2020
fw1 psu1temp1 psu1 temp sensor ok 25 85 80 5 Wed Aug 26 00:08:01 2020
fw1 temp1 board sensor near cpu ok 25 85 80 5 Wed Aug 26 00:08:01 2020
fw1 temp2 board sensor near virtual switch ok 25 85 80 5 Wed Aug 26 00:08:01 2020
fw1 temp5 board sensor near fan ok 25 85 80 5 Wed Aug 26 00:08:01 2020
fw1 psu2temp1 psu2 temp sensor ok 25 85 80 5 Wed Aug 26 00:08:01 2020
fw2 temp5 board sensor near fan ok 25 85 80 5 Wed Aug 26 00:02:13 2020
fw2 temp2 board sensor near virtual switch ok 25 85 80 5 Wed Aug 26 00:02:13 2020
fw2 psu2temp1 psu2 temp sensor ok 25 85 80 5 Wed Aug 26 00:02:13 2020
fw2 temp3 board sensor at front left corner ok 25 85 80 5 Wed Aug 26 00:02:13 2020
fw2 temp4 board sensor at front right corner ok 25 85 80 5 Wed Aug 26 00:02:13 2020
fw2 temp1 board sensor near cpu ok 25 85 80 5 Wed Aug 26 00:02:13 2020
fw2 psu1temp1 psu1 temp sensor ok 25 85 80 5 Wed Aug 26 00:02:13 2020
leaf01 psu1temp1 psu1 temp sensor ok 25 85 80 5 Wed Aug 26 16:14:41 2020
leaf01 temp5 board sensor near fan ok 25 85 80 5 Wed Aug 26 16:14:41 2020
leaf01 temp4 board sensor at front right corner ok 25 85 80 5 Wed Aug 26 16:14:41 2020
leaf01 temp1 board sensor near cpu ok 25 85 80 5 Wed Aug 26 16:14:41 2020
leaf01 temp2 board sensor near virtual switch ok 25 85 80 5 Wed Aug 26 16:14:41 2020
leaf01 temp3 board sensor at front left corner ok 25 85 80 5 Wed Aug 26 16:14:41 2020
leaf01 psu2temp1 psu2 temp sensor ok 25 85 80 5 Wed Aug 26 16:14:41 2020
leaf02 temp5 board sensor near fan ok 25 85 80 5 Wed Aug 26 16:14:08 2020
...
spine04 psu2temp1 psu2 temp sensor ok 25 85 80 5 Wed Aug 26 10:52:00 2020
spine04 temp5 board sensor near fan ok 25 85 80 5 Wed Aug 26 10:52:00 2020
This example shows the state of all temperature sensors with the name psu2temp1.
cumulus@switch:~$ netq show sensors temp psu2temp1
Matching sensors records:
Hostname Name Description State Temp Critical Max Min Message Last Changed
----------------- --------------- ----------------------------------- ---------- -------- -------- -------- -------- ----------------------------------- -------------------------
border01 psu2temp1 psu2 temp sensor ok 25 85 80 5 Tue Aug 25 21:45:21 2020
border02 psu2temp1 psu2 temp sensor ok 25 85 80 5 Tue Aug 25 21:39:36 2020
fw1 psu2temp1 psu2 temp sensor ok 25 85 80 5 Wed Aug 26 00:08:01 2020
fw2 psu2temp1 psu2 temp sensor ok 25 85 80 5 Wed Aug 26 00:02:13 2020
leaf01 psu2temp1 psu2 temp sensor ok 25 85 80 5 Tue Aug 25 18:30:07 2020
leaf02 psu2temp1 psu2 temp sensor ok 25 85 80 5 Tue Aug 25 18:08:38 2020
leaf03 psu2temp1 psu2 temp sensor ok 25 85 80 5 Tue Aug 25 21:20:34 2020
leaf04 psu2temp1 psu2 temp sensor ok 25 85 80 5 Wed Aug 26 14:20:22 2020
spine01 psu2temp1 psu2 temp sensor ok 25 85 80 5 Wed Aug 26 10:53:17 2020
spine02 psu2temp1 psu2 temp sensor ok 25 85 80 5 Wed Aug 26 10:54:07 2020
spine03 psu2temp1 psu2 temp sensor ok 25 85 80 5 Wed Aug 26 11:00:44 2020
spine04 psu2temp1 psu2 temp sensor ok 25 85 80 5 Wed Aug 26 10:52:00 2020
View Digital Optics Information
Digital optics information is available from any digital optics modules in the system using the NetQ UI and NetQ CLI.
Digital Optics card: view laser bias current, laser output power, received signal average optical power, and module temperature/voltage (table)
netq show dom type command: view laser bias current, laser output power, received signal average optical power, and module temperature/voltage
Use the filter option to view laser power and bias current for a given interface and channel on a switch, and temperature and voltage for a given module. Select the relevant tab to view the data.
Click (main menu), then click Digital Optics in the Network heading.
The Laser Rx Power tab is displayed by default.
Laser Parameter
Description
Hostname
Name of the switch or host where the digital optics module resides
Timestamp
Date and time the data was captured
If Name
Name of interface where the digital optics module is installed
Units
Measurement unit for the power (mW) or current (mA)
Channel 1–8
Value of the power or current on each channel where the digital optics module is transmitting
Module Parameter
Description
Hostname
Name of the switch or host where the digital optics module resides
Timestamp
Date and time the data was captured
If Name
Name of interface where the digital optics module is installed
Degree C
Current module temperature, measured in degrees Celsius
Degree F
Current module temperature, measured in degrees Fahrenheit
Units
Measurement unit for module voltage; Volts
Value
Current module voltage
Click each of the other Laser or Module tabs to view that information for all devices.
To view digital optics information for your switches and host servers, run one of the following:
netq show dom type (laser_rx_power|laser_output_power|laser_bias_current) [interface <text-dom-port-anchor>] [channel_id <text-channel-id>] [around <text-time>] [json]
netq show dom type (module_temperature|module_voltage) [interface <text-dom-port-anchor>] [around <text-time>] [json]
This example shows module temperature information for all devices.
You can view software components deployed on all switches and hosts, or on all the switches in your network.
View the Operating Systems Information
Knowing what operating systems (OSs) you have deployed across your network is useful for upgrade planning and understanding your relative dependence on a given OS in your network.
OS information is available from the NetQ UI and NetQ CLI.
Inventory|Devices card
Medium: view the distribution of OSs and versions across all devices
Large: view the distribution of OSs and versions across all switches
Full-screen: view OS vendor, version, and version ID on all devices (table)
Inventory|Switches card
Medium/Large: view the distribution of OSs and versions across all switches (graphic)
Full-screen: view OS vendor, version, and version ID on all on all switches (table)
netq show inventory os
View OS name and version on all devices
Locate the medium Inventory|Devices card on your workbench.
Hover over the pie charts to view the total number of devices with a given operating system installed.
Change to the large card using the size picker.
Hover over a segment in the OS distribution chart to view the total number of devices with a given operating system installed.
Note that sympathetic highlighting (in blue) is employed to show which versions of the other switch components are associated with this OS.
Click on a segment in OS distribution chart.
Click Filter OS at the top of the popup.
The card updates to show only the components associated with switches running the selected OS. To return to all OSs, click X in the OS tag to remove the filter.
Change to the full-screen card using the size picker.
The All Switches tab is selected by default. Scroll to the right to locate all of the OS parameter data.
Click All Hosts to view the OS parameters for all host servers.
To return to your workbench, click in the top right corner of the card.
Locate the Inventory|Switches card on your workbench.
Hover over a segment of the OS graph in the distribution chart.
The same information is available on the summary tab of the large size card.
Hover over the card, and change to the full-screen card using the size picker.
Click OS.
To return to your workbench, click in the top right corner of the card.
To view OS information for your switches and host servers, run:
netq show inventory os [version <os-version>|name <os-name>] [json]
This example shows the OS information for all devices.
You can filter the results of the command to view only devices with a particular operating system or version. This can be especially helpful when you suspect that a particular device upgrade did not work as expected.
This example shows all devices with the Cumulus Linux version 3.7.12 installed.
cumulus@switch:~$ netq show inventory os version 3.7.12
Matching inventory records:
Hostname Name Version Last Changed
----------------- --------------- ------------------------------------ -------------------------
spine01 CL 3.7.12 Mon Aug 10 19:55:06 2020
spine02 CL 3.7.12 Mon Aug 10 19:55:07 2020
spine03 CL 3.7.12 Mon Aug 10 19:55:09 2020
spine04 CL 3.7.12 Mon Aug 10 19:55:08 2020
View the Supported Cumulus Linux Packages
When you are troubleshooting an issue with a switch, you might want to know all the supported versions of the Cumulus Linux operating system that are available for that switch and on a switch that is not having the same issue.
To view package information for your switches, run:
netq show cl-manifest [json]
This example shows the OS packages supported for all switches.
If you are having an issue with several switches, you should verify all the packages installed on them and compare that to the recommended packages for a given Cumulus Linux release.
To view installed package information for your switches, run:
netq show cl-pkg-info [<text-package-name>] [around <text-time>] [json]
Use the text-package-name option to narrow the results to a particular package or the around option to narrow the output to a particular time range.
This example shows all installed software packages for all devices.
cumulus@switch:~$ netq show cl-pkg-info
Matching package_info records:
Hostname Package Name Version CL Version Package Status Last Changed
----------------- ------------------------ -------------------- -------------------- -------------------- -------------------------
border01 libcryptsetup4 2:1.6.6-5 Cumulus Linux 3.7.13 installed Mon Aug 17 18:53:50 2020
border01 libedit2 3.1-20140620-2 Cumulus Linux 3.7.13 installed Mon Aug 17 18:53:50 2020
border01 libffi6 3.1-2+deb8u1 Cumulus Linux 3.7.13 installed Mon Aug 17 18:53:50 2020
...
border02 libdb5.3 9999-cl3u2 Cumulus Linux 3.7.13 installed Mon Aug 17 18:48:53 2020
border02 libnl-cli-3-200 3.2.27-cl3u15+1 Cumulus Linux 3.7.13 installed Mon Aug 17 18:48:53 2020
border02 pkg-config 0.28-1 Cumulus Linux 3.7.13 installed Mon Aug 17 18:48:53 2020
border02 libjs-sphinxdoc 1.2.3+dfsg-1 Cumulus Linux 3.7.13 installed Mon Aug 17 18:48:53 2020
...
fw1 libpcap0.8 1.8.1-3~bpo8+1 Cumulus Linux 3.7.13 installed Mon Aug 17 19:18:57 2020
fw1 python-eventlet 0.13.0-2 Cumulus Linux 3.7.13 installed Mon Aug 17 19:18:57 2020
fw1 libapt-pkg4.12 1.0.9.8.5-cl3u2 Cumulus Linux 3.7.13 installed Mon Aug 17 19:18:57 2020
fw1 libopts25 1:5.18.4-3 Cumulus Linux 3.7.13 installed Mon Aug 17 19:18:57 2020
...
This example shows the installed switchd package version.
cumulus@switch:~$ netq spine01 show cl-pkg-info switchd
Matching package_info records:
Hostname Package Name Version CL Version Package Status Last Changed
----------------- ------------------------ -------------------- -------------------- -------------------- -------------------------
spine01 switchd 1.0-cl3u40 Cumulus Linux 3.7.12 installed Thu Aug 27 01:58:47 2020
View Recommended Software Packages
You can determine whether any of your switches are using a software package other than the default package associated with the Cumulus Linux release that is running on the switches. Use this list to determine which packages to install/upgrade on all devices. Additionally, you can determine if a software package is missing.
To view recommended package information for your switches, run:
netq show recommended-pkg-version [release-id <text-release-id>] [package-name <text-package-name>] [json]
The output can be rather lengthy if you run this command for all releases and packages. If desired, run the command using the release-id and/or package-name options to shorten the output.
This example looks for switches running Cumulus Linux 3.7.1 and switchd. The result is a single switch, leaf12, that has older software and should get an update.
cumulus@switch:~$ netq show recommended-pkg-version release-id 3.7.1 package-name switchd
Matching manifest records:
Hostname Release ID ASIC Vendor CPU Arch Package Name Version Last Changed
----------------- -------------------- -------------------- -------------------- -------------------- -------------------- -------------------------
leaf12 3.7.1 vx x86_64 switchd 1.0-cl3u30 Wed Feb 5 04:36:30 2020
This example looks for switches running Cumulus Linux 3.7.1 and ptmd. The result is a single switch, server01, that has older software and should get an update.
cumulus@switch:~$ netq show recommended-pkg-version release-id 3.7.1 package-name ptmd
Matching manifest records:
Hostname Release ID ASIC Vendor CPU Arch Package Name Version Last Changed
----------------- -------------------- -------------------- -------------------- -------------------- -------------------- -------------------------
server01 3.7.1 vx x86_64 ptmd 3.0-2-cl3u8 Wed Feb 5 04:36:30 2020
This example looks for switches running Cumulus Linux 3.7.1 and lldpd. The result is a single switch, server01, that has older software and should get an update.
cumulus@switch:~$ netq show recommended-pkg-version release-id 3.7.1 package-name lldpd
Matching manifest records:
Hostname Release ID ASIC Vendor CPU Arch Package Name Version Last Changed
----------------- -------------------- -------------------- -------------------- -------------------- -------------------- -------------------------
server01 3.7.1 vx x86_64 lldpd 0.9.8-0-cl3u11 Wed Feb 5 04:36:30 2020
This example looks for switches running Cumulus Linux 3.6.2 and switchd. The result is a single switch, leaf04, that has older software and should get an update.
cumulus@noc-pr:~$ netq show recommended-pkg-version release-id 3.6.2 package-name switchd
Matching manifest records:
Hostname Release ID ASIC Vendor CPU Arch Package Name Version Last Changed
----------------- -------------------- -------------------- -------------------- -------------------- -------------------- -------------------------
leaf04 3.6.2 vx x86_64 switchd 1.0-cl3u27 Wed Feb 5 04:36:30 2020
View ACL Resources
Using the NetQ CLI, you can monitor the incoming and outgoing access control lists (ACLs) configured on all switches, currently or at a time in the past.
To view ACL resources for all your switches, run:
netq show cl-resource acl [ingress | egress] [around <text-time>] [json]
Use the egress or ingress options to show only the outgoing or incoming ACLs. Use the around option to show this information for a time in the past.
This example shows the ACL resources for all configured switches:
cumulus@switch:~$ netq show cl-resource acl
Matching cl_resource records:
Hostname In IPv4 filter In IPv4 Mangle In IPv6 filter In IPv6 Mangle In 8021x filter In Mirror In PBR IPv4 filter In PBR IPv6 filter Eg IPv4 filter Eg IPv4 Mangle Eg IPv6 filter Eg IPv6 Mangle ACL Regions 18B Rules Key 32B Rules Key 54B Rules Key L4 Port range Checke Last Updated
rs
----------------- -------------------- -------------------- -------------------- -------------------- -------------------- -------------------- -------------------- -------------------- -------------------- -------------------- -------------------- -------------------- -------------------- -------------------- -------------------- -------------------- -------------------- ------------------------
act-5712-09 40,512(7%) 0,0(0%) 30,768(3%) 0,0(0%) 0,0(0%) 0,0(0%) 0,0(0%) 0,0(0%) 32,256(12%) 0,0(0%) 0,0(0%) 0,0(0%) 0,0(0%) 0,0(0%) 0,0(0%) 0,0(0%) 2,24(8%) Tue Aug 18 20:20:39 2020
mlx-2700-04 0,0(0%) 0,0(0%) 0,0(0%) 0,0(0%) 0,0(0%) 0,0(0%) 0,0(0%) 0,0(0%) 0,0(0%) 0,0(0%) 0,0(0%) 0,0(0%) 4,400(1%) 2,2256(0%) 0,1024(0%) 2,1024(0%) 0,0(0%) Tue Aug 18 20:19:08 2020
The same information can be output to JSON format:
NetQ Agent information is available from the NetQ UI and NetQ CLI.
Agents list
Full-screen: view NetQ Agent version across all devices (table)
Inventory|Switches card
Medium: view the number of unique versions of the NetQ Agent running on all devices
Large: view the number of unique versions of the NetQ Agent running on all devices and the associated OS
Full-screen: view NetQ Agent status and version across all devices
netq show agents
View NetQ Agent status, uptime, and version across all devices
To view the NetQ Agents on all switches and hosts:
Click to open the Main menu.
Select Agents from the Network column.
View the Version column to determine which release of the NetQ Agent is running on your devices. Ideally, this version should be the same as the NetQ release you are running, and is the same across all your devices.
Parameter
Description
Hostname
Name of the switch or host
Timestamp
Date and time the data was captured
Last Reinit
Date and time that the switch or host was reinitialized
Last Update Time
Date and time that the switch or host was updated
Lastboot
Date and time that the switch or host was last booted up
NTP State
Status of NTP synchronization on the switch or host; yes = in synchronization, no = out of synchronization
Sys Uptime
Amount of time the switch or host has been continuously up and running
Version
NetQ version running on the switch or host
It is recommended that when you upgrade NetQ that you also upgrade the NetQ Agents. You can determine if you have covered all of your agents using the medium or large Switch Inventory card. To view the NetQ Agent distribution by version:
Open the medium Switch Inventory card.
View the number in the Unique column next to Agent.
If the number is greater than one, you have multiple NetQ Agent versions deployed.
If you have multiple versions, hover over the Agent chart to view the count of switches using each version.
For more detail, switch to the large Switch Inventory card.
Hover over the card and click to open the Software tab.
Hover over the chart on the right to view the number of switches using the various versions of the NetQ Agent.
Hover over the Operating System chart to see which NetQ Agent versions are being run on each OS.
Click either chart to focus on a particular OS or agent version.
To return to the full view, click in the filter tag.
Filter the data on the card by switches that are having trouble communicating, by selecting Rotten Switches from the dropdown above the charts.
Open the full screen Inventory|Switches card. The Show All tab is displayed by default, and shows the NetQ Agent status and version for all devices.
To view the NetQ Agents on all switches and hosts, run:
netq show agents [fresh | rotten ] [around <text-time>] [json]
Use the fresh keyword to view only the NetQ Agents that are in current communication with the NetQ Platform or NetQ Collector. Use the rotten keyword to view those that are not. Use the around keyword to view the state of NetQ Agents at an earlier time.
This example shows the current NetQ Agent state on all devices. The Status column indicates whether the agent is up and current, labelled Fresh, or down and stale, labelled Rotten. Additional information includes the agent status — whether it is time synchronized, how long it has been up, and the last time its state changed. You can also see the version running. Ideally, this version should be the same as the NetQ release you are running, and is the same across all your devices.
cumulus@switch:~$ netq show agents
Matching agents records:
Hostname Status NTP Sync Version Sys Uptime Agent Uptime Reinitialize Time Last Changed
----------------- ---------------- -------- ------------------------------------ ------------------------- ------------------------- -------------------------- -------------------------
border01 Fresh yes 3.1.0-cl3u28~1594095615.8f00ba1 Tue Jul 28 18:48:31 2020 Tue Jul 28 18:49:46 2020 Tue Jul 28 18:49:46 2020 Sun Aug 23 18:56:56 2020
border02 Fresh yes 3.1.0-cl3u28~1594095615.8f00ba1 Tue Jul 28 18:43:29 2020 Tue Jul 28 18:44:42 2020 Tue Jul 28 18:44:42 2020 Sun Aug 23 18:49:57 2020
fw1 Fresh yes 3.1.0-cl3u28~1594095615.8f00ba1 Tue Jul 28 19:13:26 2020 Tue Jul 28 19:14:28 2020 Tue Jul 28 19:14:28 2020 Sun Aug 23 19:24:01 2020
fw2 Fresh yes 3.1.0-cl3u28~1594095615.8f00ba1 Tue Jul 28 19:11:27 2020 Tue Jul 28 19:12:51 2020 Tue Jul 28 19:12:51 2020 Sun Aug 23 19:21:13 2020
leaf01 Fresh yes 3.1.0-cl3u28~1594095615.8f00ba1 Tue Jul 14 21:04:03 2020 Wed Jul 29 16:12:22 2020 Wed Jul 29 16:12:22 2020 Sun Aug 23 16:16:09 2020
leaf02 Fresh yes 3.1.0-cl3u28~1594095615.8f00ba1 Tue Jul 14 20:59:10 2020 Wed Jul 29 16:12:23 2020 Wed Jul 29 16:12:23 2020 Sun Aug 23 16:16:48 2020
leaf03 Fresh yes 3.1.0-cl3u28~1594095615.8f00ba1 Tue Jul 14 21:04:03 2020 Tue Jul 14 21:18:23 2020 Tue Jul 14 21:18:23 2020 Sun Aug 23 21:25:16 2020
leaf04 Fresh yes 3.1.0-cl3u28~1594095615.8f00ba1 Tue Jul 14 20:57:30 2020 Tue Jul 14 20:58:48 2020 Tue Jul 14 20:58:48 2020 Sun Aug 23 21:09:06 2020
oob-mgmt-server Fresh yes 3.1.0-ub18.04u28~1594095612.8f00ba1 Mon Jul 13 17:07:59 2020 Mon Jul 13 21:01:35 2020 Tue Jul 14 19:36:19 2020 Sun Aug 23 15:45:05 2020
server01 Fresh yes 3.1.0-ub18.04u28~1594095612.8f00ba1 Mon Jul 13 18:30:46 2020 Mon Jul 13 22:09:19 2020 Tue Jul 14 19:36:22 2020 Sun Aug 23 19:43:34 2020
server02 Fresh yes 3.1.0-ub18.04u28~1594095612.8f00ba1 Mon Jul 13 18:30:46 2020 Mon Jul 13 22:09:19 2020 Tue Jul 14 19:35:59 2020 Sun Aug 23 19:48:07 2020
server03 Fresh yes 3.1.0-ub18.04u28~1594095612.8f00ba1 Mon Jul 13 18:30:46 2020 Mon Jul 13 22:09:20 2020 Tue Jul 14 19:36:22 2020 Sun Aug 23 19:47:47 2020
server04 Fresh yes 3.1.0-ub18.04u28~1594095612.8f00ba1 Mon Jul 13 18:30:46 2020 Mon Jul 13 22:09:20 2020 Tue Jul 14 19:35:59 2020 Sun Aug 23 19:47:52 2020
server05 Fresh yes 3.1.0-ub18.04u28~1594095612.8f00ba1 Mon Jul 13 18:30:46 2020 Mon Jul 13 22:09:20 2020 Tue Jul 14 19:36:02 2020 Sun Aug 23 19:46:27 2020
server06 Fresh yes 3.1.0-ub18.04u28~1594095612.8f00ba1 Mon Jul 13 18:30:46 2020 Mon Jul 13 22:09:21 2020 Tue Jul 14 19:36:37 2020 Sun Aug 23 19:47:37 2020
server07 Fresh yes 3.1.0-ub18.04u28~1594095612.8f00ba1 Mon Jul 13 17:58:02 2020 Mon Jul 13 22:09:21 2020 Tue Jul 14 19:36:01 2020 Sun Aug 23 18:01:08 2020
server08 Fresh yes 3.1.0-ub18.04u28~1594095612.8f00ba1 Mon Jul 13 17:58:18 2020 Mon Jul 13 22:09:23 2020 Tue Jul 14 19:36:03 2020 Mon Aug 24 09:10:38 2020
spine01 Fresh yes 3.1.0-cl3u28~1594095615.8f00ba1 Mon Jul 13 17:48:43 2020 Mon Aug 10 19:55:07 2020 Mon Aug 10 19:55:07 2020 Sun Aug 23 19:57:05 2020
spine02 Fresh yes 3.1.0-cl3u28~1594095615.8f00ba1 Mon Jul 13 17:47:39 2020 Mon Aug 10 19:55:09 2020 Mon Aug 10 19:55:09 2020 Sun Aug 23 19:56:39 2020
spine03 Fresh yes 3.1.0-cl3u28~1594095615.8f00ba1 Mon Jul 13 17:47:40 2020 Mon Aug 10 19:55:12 2020 Mon Aug 10 19:55:12 2020 Sun Aug 23 19:57:29 2020
spine04 Fresh yes 3.1.0-cl3u28~1594095615.8f00ba1 Mon Jul 13 17:47:56 2020 Mon Aug 10 19:55:11 2020 Mon Aug 10 19:55:11 2020 Sun Aug 23 19:58:23 2020
Monitor Switch Inventory
With the NetQ UI and NetQ CLI, you can monitor your inventory of switches across the network or individually. A user can monitor such items as operating system, motherboard, ASIC, microprocessor, disk, memory, fan and power supply information. Being able to monitor this inventory aids in upgrades, compliance, and other planning tasks.
The commands and cards available to obtain this type of information help you to answer questions such as:
What hardware is installed on my switch?
How many transmit and receive packets have been dropped?
The NetQ UI provides the Inventory | Switches card for monitoring the hardware and software component inventory on switches running NetQ in your network. Access this card from the NetQ Workbench, or add it to your own workbench by clicking (Add card) > Inventory > Inventory|Switches card > Open Cards.
The CLI provides detailed switch inventory information through its netq <hostname> show inventory command.
View Switch Inventory Summary
Component information for all of the switches in your network can be viewed from both the NetQ UI and NetQ CLI.
Inventory|Switches card:
Small: view count of switches and distribution of switch status
Medium: view count of OS, ASIC, platform, CPU model, Disk, and memory types or versions across all switches
netq show inventory command:
-View ASIC, CPU, disk, OS, and ports on all switches
View the Number of Types of Any Component Deployed
For each of the components monitored on a switch, NetQ displays the variety of those component by way of a count. For example, if you have four operating systems running on your switches, say Cumulus Linux, SONiC, Ubuntu and RHEL, NetQ indicates a total unique count of three OSs. If you only use Cumulus Linux, then the count shows as one.
To view this count for all of the components on the switch:
Open the medium Switch Inventory card.
Note the number in the Unique column for each component.
In the above example, there are four different disk sizes deployed, four different OSs running, four different ASIC vendors and models deployed, and so forth.
Scroll down to see additional components.
By default, the data is shown for switches with a fresh communication status. You can choose to look at the data for switches in the rotten state instead. For example, if you wanted to see if there was any correlation to a version of OS to the switch having a rotten status, you could select Rotten Switches from the dropdown at the top of the card and see if they all use the same OS (count would be 1). It might not be the cause of the lack of communication, but you get the idea.
View the Distribution of Any Component Deployed
NetQ monitors a number of switch components. For each component you can view the distribution of versions or models or vendors deployed across your network for that component.
To view the distribution:
Locate the Inventory|Switches card on your workbench.
From the medium or large card, view the distribution of hardware and software components across the network.
Hover over any of the segments in the distribution chart to highlight a specific component. Scroll down to view additional components.
When you hover, a tooltip appears displaying:
Name or value of the component type, such as the version number or status
Total number of switches with that type of component deployed compared to the total number of switches
Percentage of this type with respect to all component types
On the large Switch Inventory card, hovering also highlights the related components for the selected component.
Choose Rotten Switches from the dropdown to see which, if any, switches are currently not communicating with NetQ.
Return to your fresh switches, then hover over the card header and change to the small size card using the size picker.
Here you can see the total switch count and the distribution of those that are communicating well with the NetQ appliance or VM and those that are not. In this example, there are a total of 13 switches and they are all fresh (communicating well).
To view the hardware and software components for a switch, run:
netq <hostname> show inventory brief
This example shows the type of switch (Cumulus VX), operating system (Cumulus Linux), CPU (x86_62), and ASIC (virtual) for the spine01 switch.
cumulus@switch:~$ netq spine01 show inventory brief
Matching inventory records:
Hostname Switch OS CPU ASIC Ports
----------------- -------------------- --------------- -------- --------------- -----------------------------------
spine01 VX CL x86_64 VX N/A
This example show the components on the NetQ On-premises or Cloud Appliance.
cumulus@switch:~$ netq show inventory brief opta
Matching inventory records:
Hostname Switch OS CPU ASIC Ports
----------------- -------------------- --------------- -------- --------------- -----------------------------------
netq-ts N/A Ubuntu x86_64 N/A N/A
View Switch Hardware Inventory
You can view hardware components deployed on each switch in your network.
View ASIC Information for a Switch
You can view the ASIC information for a switch from either the NetQ CLI or NetQ UI.
Locate the medium Inventory|Switches card on your workbench.
Change to the full-screen card and click ASIC.
Note that if you are running CumulusVX switches, no detailed ASIC information is available because the hardware is virtualized.
Click to quickly locate a switch that does not appear on the first page of the switch list.
Select hostname from the Field dropdown.
Enter the hostname of the switch you want to view, and click Apply.
To return to your workbench, click in the top right corner of the card.
To view information about the ASIC on a switch, run:
netq [<hostname>] show inventory asic [opta] [json]
This example shows the ASIC information for the leaf02 switch.
cumulus@switch:~$ netq leaf02 show inventory asic
Matching inventory records:
Hostname Vendor Model Model ID Core BW Ports
----------------- -------------------- ------------------------------ ------------------------- -------------- -----------------------------------
leaf02 Mellanox Spectrum MT52132 N/A 32 x 100G-QSFP28
This example shows the ASIC information for the NetQ On-premises or Cloud Appliance.
cumulus@switch:~$ netq show inventory asic opta
Matching inventory records:
Hostname Vendor Model Model ID Core BW Ports
----------------- -------------------- ------------------------------ ------------------------- -------------- -----------------------------------
netq-ts Mellanox Spectrum MT52132 N/A 32 x 100G-QSFP28
View Motherboard Information for a Switch
Motherboard/platform information is available from the NetQ UI and NetQ CLI.
Inventory|Switches card
Medium/Large: view platform distribution across on all switches (graphic)
Full-screen: view platform vendor, model, manufacturing date, revision, serial number, MAC address, series for a switch (table)
netq show inventory board command
View motherboard vendor, model, base MAC address, serial number, part number, revision, and manufacturing date on a switch
Locate the medium Inventory|Switches card on your workbench.
Hover over the card, and change to the full-screen card using the size picker.
Click Platform.
Note that if you are running CumulusVX switches, no detailed platform information is available because the hardware is virtualized.
Click to quickly locate a switch that does not appear on the first page of the switch list.
Select hostname from the Field dropdown.
Enter the hostname of the switch you want to view, and click Apply.
To return to your workbench, click in the top right corner of the card.
To view a list of motherboards installed in a switch, run:
netq [<hostname>] show inventory board [opta] [json]
This example shows all motherboard data for the spine01 switch.
cumulus@switch:~$ netq spine01 show inventory board
Matching inventory records:
Hostname Vendor Model Base MAC Serial No Part No Rev Mfg Date
----------------- -------------------- ------------------------------ ------------------ ------------------------- ---------------- ------ ----------
spine01 Dell S6000-ON 44:38:39:00:80:00 N/A N/A N/A N/A
Use the opta option without the hostname option to view the motherboard data for the NetQ On-premises or Cloud Appliance. No motherboard data is available for NetQ On-premises or Cloud VMs.
View CPU Information for a Switch
CPU information is available from the NetQ UI and NetQ CLI.
Inventory|Switches card: view CPU architecture, model, maximum operating frequency, the number of cores, and data on a switch (table)
netq show inventory cpu command: view CPU architecture, model, maximum operating frequency, and the number of cores on a switch
Locate the Inventory|Switches card on your workbench.
Hover over the card, and change to the full-screen card using the size picker.
Click CPU.
Click to quickly locate a switch that does not appear on the first page of the switch list.
Select hostname from the Field dropdown. Then enter the hostname of the switch you want to view.
To return to your workbench, click in the top right corner of the card.
To view CPU information for a switch in your network, run:
netq [<hostname>] show inventory cpu [arch <cpu-arch>] [opta] [json]
This example shows CPU information for the server02 switch.
cumulus@switch:~$ netq server02 show inventory cpu
Matching inventory records:
Hostname Arch Model Freq Cores
----------------- -------- ------------------------------ ---------- -----
server02 x86_64 Intel Core i7 9xx (Nehalem Cla N/A 1
ss Core i7)
This example shows the CPU information for the NetQ On-premises or Cloud Appliance.
cumulus@switch:~$ netq show inventory cpu opta
Matching inventory records:
Hostname Arch Model Freq Cores
----------------- -------- ------------------------------ ---------- -----
netq-ts x86_64 Intel Xeon Processor (Skylake, N/A 8
IBRS)
View Disk Information for a Switch
Disk information is available from the NetQ UI and NetQ CLI.
Inventory|Switches card: view disk vendor, size, revision, model, name, transport, and type on a switch (table)
netq show inventory disk command: view disk name, type, transport, size, vendor, and model on all devices
Locate the Inventory|Switches card on your workbench.
Hover over the card, and change to the full-screen card using the size picker.
Click Disk.
Note that if you are running CumulusVX switches, no detailed disk information is available because the hardware is virtualized.
Click to quickly locate a switch that does not appear on the first page of the switch list.
Select hostname from the Field dropdown. Then enter the hostname of the switch you want to view.
To return to your workbench, click in the top right corner of the card.
To view disk information for a switch in your network, run:
netq [<hostname>] show inventory disk [opta] [json]
This example shows the disk information for the leaf03 switch.
cumulus@switch:~$ netq leaf03 show inventory disk
Matching inventory records:
Hostname Name Type Transport Size Vendor Model
----------------- --------------- ---------------- ------------------ ---------- -------------------- ------------------------------
leaf03 vda disk N/A 6G 0x1af4 N/A
This example show the disk information for the NetQ On-premises or Cloud Appliance.
cumulus@switch:~$ netq show inventory disk opta
Matching inventory records:
Hostname Name Type Transport Size Vendor Model
----------------- --------------- ---------------- ------------------ ---------- -------------------- ------------------------------
netq-ts vda disk N/A 265G 0x1af4 N/A
View Memory Information for a Switch
Memory information is available from the NetQ UI and NetQ CLI.
Inventory|Switches card: view memory chip vendor, name, serial number, size, speed, and type on a switch (table)
netq show inventory memory: view memory chip name, type, size, speed, vendor, and serial number on all devices
Locate the medium Inventory|Switches card on your workbench.
Hover over the card, and change to the full-screen card using the size picker.
Click Memory.
Click to quickly locate a switch that does not appear on the first page of the switch list.
Select hostname from the Field dropdown. Then enter the hostname of the switch you want to view.
To return to your workbench, click in the top right corner of the card.
To view memory information for your switches and host servers, run:
netq [<hostname>] show inventory memory [opta] [json]
This example shows all the memory characteristics for the leaf01 switch.
cumulus@switch:~$ netq leaf01 show inventory memory
Matching inventory records:
Hostname Name Type Size Speed Vendor Serial No
----------------- --------------- ---------------- ---------- ---------- -------------------- -------------------------
leaf01 DIMM 0 RAM 768 MB Unknown QEMU Not Specified
This example shows the memory information for the NetQ On-premises or Cloud Appliance.
cumulus@switch:~$ netq show inventory memory opta
Matching inventory records:
Hostname Name Type Size Speed Vendor Serial No
----------------- --------------- ---------------- ---------- ---------- -------------------- -------------------------
netq-ts DIMM 0 RAM 16384 MB Unknown QEMU Not Specified
netq-ts DIMM 1 RAM 16384 MB Unknown QEMU Not Specified
netq-ts DIMM 2 RAM 16384 MB Unknown QEMU Not Specified
netq-ts DIMM 3 RAM 16384 MB Unknown QEMU Not Specified
View Switch Software Inventory
You can view software components deployed on a given switch in your network.
View Operating System Information for a Switch
OS information is available from the NetQ UI and NetQ CLI.
Inventory|Switches card: view OS vendor, version, and version ID on a switch (table)
netq show inventory os: view OS name and version on a switch
Locate the Inventory|Switches card on your workbench.
Hover over the card, and change to the full-screen card using the size picker.
Click OS.
Click to quickly locate a switch that does not appear on the first page of the switch list.
Enter a hostname, then click Apply.
To return to your workbench, click in the top right corner of the card.
To view OS information for a switch, run:
netq [<hostname>] show inventory os [opta] [json]
This example shows the OS information for the leaf02 switch.
cumulus@switch:~$ netq leaf02 show inventory os
Matching inventory records:
Hostname Name Version Last Changed
----------------- --------------- ------------------------------------ -------------------------
leaf02 CL 3.7.5 Fri Apr 19 16:01:46 2019
This example shows the OS information for the NetQ On-premises or Cloud Appliance.
cumulus@switch:~$ netq show inventory os opta
Matching inventory records:
Hostname Name Version Last Changed
----------------- --------------- ------------------------------------ -------------------------
netq-ts Ubuntu 18.04 Tue Jul 14 19:27:39 2020
View the Cumulus Linux Packages on a Switch
When you are troubleshooting an issue with a switch, you might want to know which supported versions of the Cumulus Linux operating system are available for that switch and on a switch that is not having the same issue.
To view package information for your switches, run:
netq <hostname> show cl-manifest [json]
This example shows the Cumulus Linux OS versions supported for the leaf01 switch, using the vx ASIC vendor (virtual, so simulated) and x86_64 CPU architecture.
If you are having an issue with a particular switch, you should verify all the installed software and whether it needs updating.
To view package information for a switch, run:
netq <hostname> show cl-pkg-info [<text-package-name>] [around <text-time>] [json]
Use the text-package-name option to narrow the results to a particular package or the around option to narrow the output to a particular time range.
This example shows all installed software packages for spine01.
cumulus@switch:~$ netq spine01 show cl-pkg-info
Matching package_info records:
Hostname Package Name Version CL Version Package Status Last Changed
----------------- ------------------------ -------------------- -------------------- -------------------- -------------------------
spine01 libfile-fnmatch-perl 0.02-2+b1 Cumulus Linux 3.7.12 installed Wed Aug 26 19:58:45 2020
spine01 screen 4.2.1-3+deb8u1 Cumulus Linux 3.7.12 installed Wed Aug 26 19:58:45 2020
spine01 libudev1 215-17+deb8u13 Cumulus Linux 3.7.12 installed Wed Aug 26 19:58:45 2020
spine01 libjson-c2 0.11-4 Cumulus Linux 3.7.12 installed Wed Aug 26 19:58:45 2020
spine01 atftp 0.7.git20120829-1+de Cumulus Linux 3.7.12 installed Wed Aug 26 19:58:45 2020
b8u1
spine01 isc-dhcp-relay 4.3.1-6-cl3u14 Cumulus Linux 3.7.12 installed Wed Aug 26 19:58:45 2020
spine01 iputils-ping 3:20121221-5+b2 Cumulus Linux 3.7.12 installed Wed Aug 26 19:58:45 2020
spine01 base-files 8+deb8u11 Cumulus Linux 3.7.12 installed Wed Aug 26 19:58:45 2020
spine01 libx11-data 2:1.6.2-3+deb8u2 Cumulus Linux 3.7.12 installed Wed Aug 26 19:58:45 2020
spine01 onie-tools 3.2-cl3u6 Cumulus Linux 3.7.12 installed Wed Aug 26 19:58:45 2020
spine01 python-cumulus-restapi 0.1-cl3u10 Cumulus Linux 3.7.12 installed Wed Aug 26 19:58:45 2020
spine01 tasksel 3.31+deb8u1 Cumulus Linux 3.7.12 installed Wed Aug 26 19:58:45 2020
spine01 ncurses-base 5.9+20140913-1+deb8u Cumulus Linux 3.7.12 installed Wed Aug 26 19:58:45 2020
3
spine01 libmnl0 1.0.3-5-cl3u2 Cumulus Linux 3.7.12 installed Wed Aug 26 19:58:45 2020
spine01 xz-utils 5.1.1alpha+20120614- Cumulus Linux 3.7.12 installed Wed Aug 26 19:58:45 2020
...
This example shows the ntp package on the spine01 switch.
cumulus@switch:~$ netq spine01 show cl-pkg-info ntp
Matching package_info records:
Hostname Package Name Version CL Version Package Status Last Changed
----------------- ------------------------ -------------------- -------------------- -------------------- -------------------------
spine01 ntp 1:4.2.8p10-cl3u2 Cumulus Linux 3.7.12 installed Wed Aug 26 19:58:45 2020
View Recommended Software Packages
If you have a software manifest, you can determine the recommended packages and versions for a particular Cumulus Linux release. You can then compare that to the software already installed on your switch(es) to determine if it differs from the manifest. Such a difference might occur if you upgraded one or more packages separately from the Cumulus Linux software itself.
To view recommended package information for a switch, run:
netq <hostname> show recommended-pkg-version [release-id <text-release-id>] [package-name <text-package-name>] [json]
This example shows the recommended packages for upgrading the leaf12 switch, namely switchd.
cumulus@switch:~$ netq leaf12 show recommended-pkg-version
Matching manifest records:
Hostname Release ID ASIC Vendor CPU Arch Package Name Version Last Changed
----------------- -------------------- -------------------- -------------------- -------------------- -------------------- -------------------------
leaf12 3.7.1 vx x86_64 switchd 1.0-cl3u30 Wed Feb 5 04:36:30 2020
This example shows the recommended packages for upgrading the server01 switch, namely lldpd.
cumulus@switch:~$ netq server01 show recommended-pkg-version
Matching manifest records:
Hostname Release ID ASIC Vendor CPU Arch Package Name Version Last Changed
----------------- -------------------- -------------------- -------------------- -------------------- -------------------- -------------------------
server01 3.7.1 vx x86_64 lldpd 0.9.8-0-cl3u11 Wed Feb 5 04:36:30 2020
This example shows the recommended version of the switchd package for use with Cumulus Linux 3.7.2.
cumulus@switch:~$ netq act-5712-09 show recommended-pkg-version release-id 3.7.2 package-name switchd
Matching manifest records:
Hostname Release ID ASIC Vendor CPU Arch Package Name Version Last Changed
----------------- -------------------- -------------------- -------------------- -------------------- -------------------- -------------------------
act-5712-09 3.7.2 bcm x86_64 switchd 1.0-cl3u31 Wed Feb 5 04:36:30 2020
This example shows the recommended version of the switchd package for use with Cumulus Linux 3.1.0. Note the version difference from the example for Cumulus Linux 3.7.2.
cumulus@noc-pr:~$ netq act-5712-09 show recommended-pkg-version release-id 3.1.0 package-name switchd
Matching manifest records:
Hostname Release ID ASIC Vendor CPU Arch Package Name Version Last Changed
----------------- -------------------- -------------------- -------------------- -------------------- -------------------- -------------------------
act-5712-09 3.1.0 bcm x86_64 switchd 1.0-cl3u4 Wed Feb 5 04:36:30 2020
Validate NetQ Agents are Running
You can confirm that NetQ Agents are running on switches and hosts (if installed) using the netq show agents command. Viewing the Status column of the output indicates whether the agent is up and current, labelled Fresh, or down and stale, labelled Rotten. Additional information includes the agent status — whether it is time synchronized, how long it has been up, and the last time its state changed.
This example shows NetQ Agent state on all devices.
View the state of the NetQ Agent on a given device using the
hostname keyword.
View only the NetQ Agents that are fresh or rotten using the fresh or rotten keyword.
View the state of NetQ Agents at an earlier time using the around
keyword.
Monitor Software Services
Cumulus Linux, SONiC and NetQ run many services to deliver the various features of these products. You can monitor their status using the netq show services command. This section describes services related to system-level operation. For monitoring other services, such as those related to routing, see those topics. NetQ automatically monitors the following services:
aclinit: aclinit service
acltool: acltool service
bgp: BGP (Border Gateway Protocol) service
bgpd: BGP daemon
chrony: chrony service
clagd: MLAG (Multi-chassis Link Aggregation) daemon
cumulus-chassis-ssh: cumulus-chassis-ssh
cumulus-chassisd: cumulus-chassisd
database: database
dhcp_relay: DHCP relay service
docker: Docker container service
ledmgrd: Switch LED manager daemon
lldp: LLDP (Link Layer Discovery Protocol) service
lldpd: LLDP daemon
mstpd: MSTP (Multiple Spanning Tree Protocol) daemon
neighmgrd: Neighbor manager daemon for BGP and OSPF
netq-agent: NetQ Agent service
netqd: NetQ application daemon
ntp: Network Time Protocol (NTP) service
pmon: Process monitor service
portwd: Port watch daemon
ptmd: PTM (Prescriptive Topology Manager) daemon
pwmd: Password manager daemon
radv: Route advertiser service
rsyslog: Rocket-fast system event logging processing service
smond: System monitor daemon
ssh: Secure shell service for switches and servers
status: Show services with a given status (ok, error, warning, fail)
switchd: Cumulus Linux switchd service for hardware acceleration
swss: SONiC switch state service daemon
sx_sdk: Spectrum ASIC SDK service
syncd: Synchronization service
syslog: System event logging service
teamd: Network team service
vrf: VRF (Virtual Route Forwarding) service
wd_keepalive: Software watchdog service
zebra: GNU Zebra routing daemon
The CLI syntax for viewing the status of services is:
netq [<hostname>] show services [<service-name>] [vrf <vrf>] [active|monitored] [around <text-time>] [json]
netq [<hostname>] show services [<service-name>] [vrf <vrf>] status (ok|warning|error|fail) [around <text-time>] [json]
netq [<hostname>] show events [level info | level error | level warning | level critical | level debug] type services [between <text-time> and <text-endtime>] [json]
View All Services on All Devices
This example shows all available services on each device and whether each is enabled, active, and monitored, along with how long the service has been running and the last time it changed.
It is useful to have colored output for this show command. To configure colored output, run the netq config add color command.
cumulus@switch:~$ netq show services
Hostname Service PID VRF Enabled Active Monitored Status Uptime Last Changed
----------------- -------------------- ----- --------------- ------- ------ --------- ---------------- ------------------------- -------------------------
leaf01 bgpd 2872 default yes yes yes ok 1d:6h:43m:59s Fri Feb 15 17:28:24 2019
leaf01 clagd n/a default yes no yes n/a 1d:6h:43m:35s Fri Feb 15 17:28:48 2019
leaf01 ledmgrd 1850 default yes yes no ok 1d:6h:43m:59s Fri Feb 15 17:28:24 2019
leaf01 lldpd 2651 default yes yes yes ok 1d:6h:43m:27s Fri Feb 15 17:28:56 2019
leaf01 mstpd 1746 default yes yes yes ok 1d:6h:43m:35s Fri Feb 15 17:28:48 2019
leaf01 neighmgrd 1986 default yes yes no ok 1d:6h:43m:59s Fri Feb 15 17:28:24 2019
leaf01 netq-agent 8654 mgmt yes yes yes ok 1d:6h:43m:29s Fri Feb 15 17:28:54 2019
leaf01 netqd 8848 mgmt yes yes yes ok 1d:6h:43m:29s Fri Feb 15 17:28:54 2019
leaf01 ntp 8478 mgmt yes yes yes ok 1d:6h:43m:29s Fri Feb 15 17:28:54 2019
leaf01 ptmd 2743 default yes yes no ok 1d:6h:43m:59s Fri Feb 15 17:28:24 2019
leaf01 pwmd 1852 default yes yes no ok 1d:6h:43m:59s Fri Feb 15 17:28:24 2019
leaf01 smond 1826 default yes yes yes ok 1d:6h:43m:27s Fri Feb 15 17:28:56 2019
leaf01 ssh 2106 default yes yes no ok 1d:6h:43m:59s Fri Feb 15 17:28:24 2019
leaf01 syslog 8254 default yes yes no ok 1d:6h:43m:59s Fri Feb 15 17:28:24 2019
leaf01 zebra 2856 default yes yes yes ok 1d:6h:43m:59s Fri Feb 15 17:28:24 2019
leaf02 bgpd 2867 default yes yes yes ok 1d:6h:43m:55s Fri Feb 15 17:28:28 2019
leaf02 clagd n/a default yes no yes n/a 1d:6h:43m:31s Fri Feb 15 17:28:53 2019
leaf02 ledmgrd 1856 default yes yes no ok 1d:6h:43m:55s Fri Feb 15 17:28:28 2019
leaf02 lldpd 2646 default yes yes yes ok 1d:6h:43m:30s Fri Feb 15 17:28:53 2019
...
You can also view services information in JSON format:
If you want to view the service information for a given device, use the hostname option when running the command.
View Information about a Given Service on All Devices
You can view the status of a given service at the current time, at a prior point in time, or view the changes that have occurred for the service during a specified timeframe.
This example shows how to view the status of the NTP service across the network. In this case, the VRF configuration has the NTP service running on both the default and management interface. You can perform the same command with the other services, such as bgpd, lldpd, and clagd.
cumulus@switch:~$ netq show services ntp
Matching services records:
Hostname Service PID VRF Enabled Active Monitored Status Uptime Last Changed
----------------- -------------------- ----- --------------- ------- ------ --------- ---------------- ------------------------- -------------------------
exit01 ntp 8478 mgmt yes yes yes ok 1d:6h:52m:41s Fri Feb 15 17:28:54 2019
exit02 ntp 8497 mgmt yes yes yes ok 1d:6h:52m:36s Fri Feb 15 17:28:59 2019
firewall01 ntp n/a default yes yes yes ok 1d:6h:53m:4s Fri Feb 15 17:28:31 2019
hostd-11 ntp n/a default yes yes yes ok 1d:6h:52m:46s Fri Feb 15 17:28:49 2019
hostd-21 ntp n/a default yes yes yes ok 1d:6h:52m:37s Fri Feb 15 17:28:58 2019
hosts-11 ntp n/a default yes yes yes ok 1d:6h:52m:28s Fri Feb 15 17:29:07 2019
hosts-13 ntp n/a default yes yes yes ok 1d:6h:52m:19s Fri Feb 15 17:29:16 2019
hosts-21 ntp n/a default yes yes yes ok 1d:6h:52m:14s Fri Feb 15 17:29:21 2019
hosts-23 ntp n/a default yes yes yes ok 1d:6h:52m:4s Fri Feb 15 17:29:31 2019
noc-pr ntp 2148 default yes yes yes ok 1d:6h:53m:43s Fri Feb 15 17:27:52 2019
noc-se ntp 2148 default yes yes yes ok 1d:6h:53m:38s Fri Feb 15 17:27:57 2019
spine01 ntp 8414 mgmt yes yes yes ok 1d:6h:53m:30s Fri Feb 15 17:28:05 2019
spine02 ntp 8419 mgmt yes yes yes ok 1d:6h:53m:27s Fri Feb 15 17:28:08 2019
spine03 ntp 8443 mgmt yes yes yes ok 1d:6h:53m:22s Fri Feb 15 17:28:13 2019
leaf01 ntp 8765 mgmt yes yes yes ok 1d:6h:52m:52s Fri Feb 15 17:28:43 2019
leaf02 ntp 8737 mgmt yes yes yes ok 1d:6h:52m:46s Fri Feb 15 17:28:49 2019
leaf11 ntp 9305 mgmt yes yes yes ok 1d:6h:49m:22s Fri Feb 15 17:32:13 2019
leaf12 ntp 9339 mgmt yes yes yes ok 1d:6h:49m:9s Fri Feb 15 17:32:26 2019
leaf21 ntp 9367 mgmt yes yes yes ok 1d:6h:49m:5s Fri Feb 15 17:32:30 2019
leaf22 ntp 9403 mgmt yes yes yes ok 1d:6h:52m:57s Fri Feb 15 17:28:38 2019
This example shows the status of the BGP daemon.
cumulus@switch:~$ netq show services bgpd
Matching services records:
Hostname Service PID VRF Enabled Active Monitored Status Uptime Last Changed
----------------- -------------------- ----- --------------- ------- ------ --------- ---------------- ------------------------- -------------------------
exit01 bgpd 2872 default yes yes yes ok 1d:6h:54m:37s Fri Feb 15 17:28:24 2019
exit02 bgpd 2867 default yes yes yes ok 1d:6h:54m:33s Fri Feb 15 17:28:28 2019
firewall01 bgpd 21766 default yes yes yes ok 1d:6h:54m:54s Fri Feb 15 17:28:07 2019
spine01 bgpd 2953 default yes yes yes ok 1d:6h:55m:27s Fri Feb 15 17:27:34 2019
spine02 bgpd 2948 default yes yes yes ok 1d:6h:55m:23s Fri Feb 15 17:27:38 2019
spine03 bgpd 2953 default yes yes yes ok 1d:6h:55m:18s Fri Feb 15 17:27:43 2019
leaf01 bgpd 3221 default yes yes yes ok 1d:6h:54m:48s Fri Feb 15 17:28:13 2019
leaf02 bgpd 3177 default yes yes yes ok 1d:6h:54m:42s Fri Feb 15 17:28:19 2019
leaf11 bgpd 3521 default yes yes yes ok 1d:6h:51m:18s Fri Feb 15 17:31:43 2019
leaf12 bgpd 3527 default yes yes yes ok 1d:6h:51m:6s Fri Feb 15 17:31:55 2019
leaf21 bgpd 3512 default yes yes yes ok 1d:6h:51m:1s Fri Feb 15 17:32:00 2019
leaf22 bgpd 3536 default yes yes yes ok 1d:6h:54m:54s Fri Feb 15 17:28:07 2019
View Events Related to a Given Service
To view changes over a given time period, use the netq show events command. For more detailed information about events, refer to Manage Events and Notifications.
This example shows changes to the bgpd service in the last 48 hours.
cumulus@switch:/$ netq show events type bgp between now and 48h
Matching events records:
Hostname Message Type Severity Message Timestamp
----------------- ------------ -------- ----------------------------------- -------------------------
leaf01 bgp info BGP session with peer spine-1 swp3. 1d:6h:55m:37s
3 vrf DataVrf1081 state changed fro
m failed to Established
leaf01 bgp info BGP session with peer spine-2 swp4. 1d:6h:55m:37s
3 vrf DataVrf1081 state changed fro
m failed to Established
leaf01 bgp info BGP session with peer spine-3 swp5. 1d:6h:55m:37s
3 vrf DataVrf1081 state changed fro
m failed to Established
leaf01 bgp info BGP session with peer spine-1 swp3. 1d:6h:55m:37s
2 vrf DataVrf1080 state changed fro
m failed to Established
leaf01 bgp info BGP session with peer spine-3 swp5. 1d:6h:55m:37s
2 vrf DataVrf1080 state changed fro
m failed to Established
leaf01 bgp info BGP session with peer spine-2 swp4. 1d:6h:55m:37s
2 vrf DataVrf1080 state changed fro
m failed to Established
leaf01 bgp info BGP session with peer spine-3 swp5. 1d:6h:55m:37s
4 vrf DataVrf1082 state changed fro
m failed to Established
Monitor System Inventory
In addition to network and switch inventory, the NetQ UI provides a view into the current status and configuration of the software network constructs in a tabular, networkwide view. These are helpful when you want to see all the data for all of a particular element in your network for troubleshooting, or you want to export a list view.
Some of these views provide data that is also available through the card workflows, but these views are not treated like cards. They only provide the current status; you cannot change the time period of the views, or graph the data within the UI.
Access these tables through the Main Menu (), under the Network heading.
Tables can be manipulated using the settings above the tables, shown here and described in Table Settings.
Pagination options are shown when there are more than 25 results.
View All NetQ Agents
The Agents view provides all available parameter data about all NetQ Agents in the system.
Parameter
Description
Hostname
Name of the switch or host
Timestamp
Date and time the data was captured
Last Reinit
Date and time that the switch or host was reinitialized
Last Update Time
Date and time that the switch or host was updated
Lastboot
Date and time that the switch or host was last booted up
NTP State
Status of NTP synchronization on the switch or host; yes = in synchronization, no = out of synchronization
Sys Uptime
Amount of time the switch or host has been continuously up and running
Version
NetQ version running on the switch or host
View All Events
The Events view provides all available parameter data about all events in the system.
Parameter
Description
Hostname
Name of the switch or host that experienced the event
Timestamp
Date and time the event was captured
Message
Description of the event
Message Type
Network service or protocol that generated the event
Severity
Importance of the event. Values include critical, warning, info, and debug.
View All MACs
The MACs (media access control addresses) view provides all available parameter data about all MAC addresses in the system.
Parameter
Description
Hostname
Name of the switch or host where the MAC address resides
Timestamp
Date and time the data was captured
Egress Port
Port where traffic exits the switch or host
Is Remote
Indicates if the address is
Is Static
Indicates if the address is a static (true) or dynamic assignment (false)
MAC Address
MAC address
Nexthop
Next hop for traffic hitting this MAC address on this switch or host
Origin
Indicates if address is owned by this switch or host (true) or by a peer (false)
VLAN
VLAN associated with the MAC address, if any
View All VLANs
The VLANs (virtual local area networks) view provides all available parameter data about all VLANs in the system.
Parameter
Description
Hostname
Name of the switch or host where the VLAN(s) reside(s)
Timestamp
Date and time the data was captured
If Name
Name of interface used by the VLAN(s)
Last Changed
Date and time when this information was last updated
Ports
Ports on the switch or host associated with the VLAN(s)
SVI
Switch virtual interface associated with a bridge interface
VLANs
VLANs associated with the switch or host
View IP Routes
The IP Routes view provides all available parameter data about all IP routes. The list of routes can be filtered to view only the IPv4 or IPv6 routes by selecting the relevant tab.
Parameter
Description
Hostname
Name of the switch or host where the VLAN(s) reside(s)
Timestamp
Date and time the data was captured
Is IPv6
Indicates if the address is an IPv6 (true) or IPv4 (false) address
Message Type
Network service or protocol; always Route in this table
Nexthops
Possible ports/interfaces where traffic can be routed to next
Origin
Indicates if this switch or host is the source of this route (true) or not (false)
Prefix
IPv4 or IPv6 address prefix
Priority
Rank of this route to be used before another, where the lower the number, less likely is to be used; value determined by routing protocol
Protocol
Protocol responsible for this route
Route Type
Type of route
Rt Table ID
The routing table identifier where the route resides
Src
Prefix of the address where the route is coming from (the previous hop)
VRF
Associated virtual route interface associated with this route
View IP Neighbors
The IP Neighbors view provides all available parameter data about all IP neighbors. The list of neighbors can be filtered to view only the IPv4 or IPv6 neighbors by selecting the relevant tab.
Parameter
Description
Hostname
Name of the neighboring switch or host
Timestamp
Date and time the data was captured
IF Index
Index of interface used to communicate with this neighbor
If Name
Name of interface used to communicate with this neighbor
IP Address
IPv4 or IPv6 address of the neighbor switch or host
Is IPv6
Indicates if the address is an IPv6 (true) or IPv4 (false) address
Is Remote
Indicates if the address is
MAC Address
MAC address of the neighbor switch or host
Message Type
Network service or protocol; always Neighbor in this table
VRF
Associated virtual route interface associated with this neighbor
View IP Addresses
The IP Addresses view provides all available parameter data about all IP addresses. The list of addresses can be filtered to view only the IPv4 or IPv6 addresses by selecting the relevant tab.
Parameter
Description
Hostname
Name of the neighboring switch or host
Timestamp
Date and time the data was captured
If Name
Name of interface used to communicate with this neighbor
Is IPv6
Indicates if the address is an IPv6 (true) or IPv4 (false) address
Mask
Host portion of the address
Prefix
Network portion of the address
VRF
Virtual route interface associated with this address prefix and interface on this switch or host
Device Groups allow you to create a label for a subset of devices in the inventory. You can configure validation checks to run on select devices by referencing group names.
Create a Device Group
To create a device group, add the Device Groups card to your workbench. Click to navigate to the Device Groups section and click Open Cards after selecting the Device groups card:
The Device groups card will now be displayed on your workbench. Click Create New Group to create a new device group:
The Create New Group wizard will be displayed. To finish creating a new group:
Set the name of the group of devices
Declare a hostname-based rule to define which devices in the inventory should be added to the group
Confirm the expected matched devices appear in the inventory, and click Create device group
The following example shows a group name of “exit group” matching any device in the inventory with “exit” in the hostname:
Updating a Device Group
When new devices that match existing group riles are added to the inventory, those devices matching the rule criteria will be flagged for review to be added to the group inventory. The following example shows the switch “exit-2” being detected in the inventory after the group was already configured:
To add the new device to the group inventory, click and then click Update device group.
Removing a Device Group
To delete a device group:
Expand the Device Groups card:
Click on the desired group and select Delete.
Monitor Container Environments Using Kubernetes API Server
The NetQ Agent monitors many aspects of containers on your network by integrating with the Kubernetes API server. In particular, the NetQ Agent tracks:
Identity: Every container’s IP and MAC address, name, image, and more. NetQ can locate containers across the fabric based on a container’s name, image, IP or MAC address, and protocol and port pair.
Port mapping on a network: Protocol and ports exposed by a container. NetQ can identify containers exposing a specific protocol and port pair on a network.
Connectivity: Information about network connectivity for a container, including adjacency and identifying a top of rack switch’s effects on containers.
This topic assumes a reasonable familiarity with Kubernetes terminology and architecture.
Use NetQ with Kubernetes Clusters
The NetQ Agent interfaces with the Kubernetes API server and listens to Kubernetes events. The NetQ Agent monitors network identity and physical network connectivity of Kubernetes resources like pods, daemon sets, services, and so forth. NetQ works with any container network interface (CNI), such as Calico or Flannel.
The NetQ Kubernetes integration enables network administrators to:
Identify and locate pods, deployment, replica-set and services deployed within the network using IP, name, label, and so forth.
Track network connectivity of all pods of a service, deployment and replica set.
Locate what pods have been deployed adjacent to a top of rack (ToR) switch.
Check the impact on a pod, services, replica set or deployment by a specific ToR switch.
NetQ also helps network administrators identify changes within a Kubernetes cluster and determine if such changes had an adverse effect on the network performance (caused by a noisy neighbor for example). Additionally, NetQ helps the infrastructure administrator determine the distribution of Kubernetes workloads within a network.
Requirements
The NetQ Agent supports Kubernetes version 1.9.2 or later.
Command Summary
A large set of commands are available to monitor Kubernetes configurations, including the ability to monitor clusters, nodes, daemon-set, deployment, pods, replication, and services. Run netq show kubernetes help to see all the possible commands.
After waiting for a minute, run the show command to view the cluster.
cumulus@host:~$netq show kubernetes cluster
Next, you must enable the NetQ Agent on every worker node for complete insight into your container network. Repeat steps 2 and 3 on each worker node.
View Status of Kubernetes Clusters
Run the netq show kubernetes cluster command to view the status of all Kubernetes clusters in the fabric. The following example shows two clusters; one with server11 as the master server and the other with server12 as the master server. Both are healthy and both list their associated worker nodes.
cumulus@host:~$ netq show kubernetes cluster
Matching kube_cluster records:
Master Cluster Name Controller Status Scheduler Status Nodes
------------------------ ---------------- -------------------- ---------------- --------------------
server11:3.0.0.68 default Healthy Healthy server11 server13 se
rver22 server11 serv
er12 server23 server
24
server12:3.0.0.69 default Healthy Healthy server12 server21 se
rver23 server13 serv
er14 server21 server
22
For deployments with multiple clusters, you can use the hostname option to filter the output. This example shows filtering of the list by server11:
cumulus@host:~$ netq server11 show kubernetes cluster
Matching kube_cluster records:
Master Cluster Name Controller Status Scheduler Status Nodes
------------------------ ---------------- -------------------- ---------------- --------------------
server11:3.0.0.68 default Healthy Healthy server11 server13 se
rver22 server11 serv
er12 server23 server
24
Optionally, use the json option to present the results in JSON format.
If data collection from the NetQ Agents is not occurring as it did previously, verify that no changes made to the Kubernetes cluster configuration use the around option. Be sure to include the unit of measure with the around value. Valid units include:
w: weeks
d: days
h: hours
m: minutes
s: seconds
now
This example shows changes that made to the cluster in the last hour. This example shows the addition of the two master nodes and the various worker nodes for each cluster.
cumulus@host:~$ netq show kubernetes cluster around 1h
Matching kube_cluster records:
Master Cluster Name Controller Status Scheduler Status Nodes DBState Last changed
------------------------ ---------------- -------------------- ---------------- ---------------------------------------- -------- -------------------------
server11:3.0.0.68 default Healthy Healthy server11 server13 server22 server11 serv Add Fri Feb 8 01:50:50 2019
er12 server23 server24
server12:3.0.0.69 default Healthy Healthy server12 server21 server23 server13 serv Add Fri Feb 8 01:50:50 2019
er14 server21 server22
server12:3.0.0.69 default Healthy Healthy server12 server21 server23 server13 Add Fri Feb 8 01:50:50 2019
server11:3.0.0.68 default Healthy Healthy server11 Add Fri Feb 8 01:50:50 2019
server12:3.0.0.69 default Healthy Healthy server12 Add Fri Feb 8 01:50:50 2019
View Kubernetes Pod Information
You can show configuration and status of the pods in a cluster, including the names, labels, addresses, associated cluster and containers, and whether the pod is running. This example shows pods for FRR, nginx, Calico, and various Kubernetes components sorted by master node.
You can view detailed information about a node, including their role in the cluster, pod CIDR and kubelet status. This example shows all the nodes in the cluster with server11 as the master. Note that server11 acts as a worker node along with the other nodes in the cluster, server12, server13, server22, server23, and server24.
To display the kubelet or Docker version, use the components option with the show command. This example lists the kublet version, a proxy address if used, and the status of the container for server11 master and worker nodes.
To view only the details for a selected node, the name option with the hostname of that node following the components option:
cumulus@host:~$ netq server11 show kubernetes node components name server13
Matching kube_cluster records:
Master Cluster Name Node Name Kubelet KubeProxy Container Runt
ime
------------------------ ---------------- -------------------- ------------ ------------ ----------------- --------------
server11:3.0.0.68 default server13 v1.9.2 v1.9.2 docker://17.3.2 KubeletReady
View Kubernetes Replica Set on a Node
You can view information about the replica set, including the name, labels, and number of replicas present for each application. This example shows the number of replicas for each application in the server11 cluster:
You can view information about the daemon set running on the node. This example shows that six copies of the cumulus-frr daemon are running on the server11 node:
cumulus@host:~$ netq server11 show kubernetes daemon-set namespace default
Matching kube_daemonset records:
Master Cluster Name Namespace Daemon Set Name Labels Desired Count Ready Count Last Changed
------------------------ ------------ ---------------- ------------------------------ -------------------- ------------- ----------- ----------------
server11:3.0.0.68 default default cumulus-frr k8s-app:cumulus-frr 6 6 14h:25m:37s
View Pods on a Node
You can view information about the pods on the node. The first example shows all pods running nginx in the default namespace for the server11 cluster. The second example shows all pods running any application in the default namespace for the server11 cluster.
cumulus@host:~$ netq server11 show kubernetes pod namespace default label nginx
Matching kube_pod records:
Master Namespace Name IP Node Labels Status Containers Last Changed
------------------------ ------------ -------------------- ---------------- ------------ -------------------- -------- ------------------------ ----------------
server11:3.0.0.68 default nginx-8586cf59-26pj5 10.244.9.193 server24 run:nginx Running nginx:6e2b65070c86 14h:25m:24s
server11:3.0.0.68 default nginx-8586cf59-c82ns 10.244.40.128 server12 run:nginx Running nginx:01b017c26725 14h:25m:24s
server11:3.0.0.68 default nginx-8586cf59-wjwgp 10.244.49.64 server22 run:nginx Running nginx:ed2b4254e328 14h:25m:24s
cumulus@host:~$ netq server11 show kubernetes pod namespace default label app
Matching kube_pod records:
Master Namespace Name IP Node Labels Status Containers Last Changed
------------------------ ------------ -------------------- ---------------- ------------ -------------------- -------- ------------------------ ----------------
server11:3.0.0.68 default httpd-5456469bfd-bq9 10.244.49.65 server22 app:httpd Running httpd:79b7f532be2d 14h:20m:34s
zm
server11:3.0.0.68 default influxdb-6cdb566dd-8 10.244.162.128 server13 app:influx Running influxdb:15dce703cdec 14h:20m:34s
9lwn
View Status of the Replication Controller on a Node
After you create the replicas, you can then view information about the replication controller:
cumulus@host:~$ netq server11 show kubernetes replication-controller
No matching kube_replica records found
View Kubernetes Deployment Information
For each depolyment, you can view the number of replicas associated with an application. This example shows information for a deployment of the nginx application:
cumulus@host:~$ netq server11 show kubernetes deployment name nginx
Matching kube_deployment records:
Master Namespace Name Replicas Ready Replicas Labels Last Changed
------------------------ --------------- -------------------- ---------------------------------- -------------- ------------------------------ ----------------
server11:3.0.0.68 default nginx 3 3 run:nginx 14h:27m:20s
Search Using Labels
You can search for information about your Kubernetes clusters using labels. A label search is similar to a “contains” regular expression search. The following example looks for all nodes that contain kube in the replication set name or label:
You can view the connectivity graph of a Kubernetes pod, seeing its replica set, deployment or service level. The connectivity graph starts with the server where you deployed the pod, and shows the peer for each server interface. This data appears in a similar manner as the netq trace command, showing the interface name, the outbound port on that interface, and the inbound port on the peer.
In this example shows connectivity at the deployment level, where the nginx-8586cf59-wjwgp replica is in a pod on the server22 node. It has four possible commumication paths, through interfaces swp1-4 out varying ports to peer interfaces swp7 and swp20 on torc-21, torc-22, edge01 and edge02 nodes. Similarly, it shows the connections for two additional nginx replicas.
You can show details about the Kubernetes services in a cluster, including service name, labels associated with the service, type of service, associated IP address, an external address if a public service, and ports used. This example show the services available in the Kubernetes cluster:
You can filter the list to view details about a particular Kubernetes service using the name option, as shown here:
cumulus@host:~$ netq show kubernetes service name calico-etcd
Matching kube_service records:
Master Namespace Service Name Labels Type Cluster IP External IP Ports Last Changed
------------------------ ---------------- -------------------- ------------ ---------- ---------------- ---------------- ----------------------------------- ----------------
server11:3.0.0.68 kube-system calico-etcd k8s-app:cali ClusterIP 10.96.232.136 TCP:6666 2d:13h:48m:10s
co-etcd
server12:3.0.0.69 kube-system calico-etcd k8s-app:cali ClusterIP 10.96.232.136 TCP:6666 2d:13h:49m:3s
co-etcd
View Kubernetes Service Connectivity
To see the connectivity of a given Kubernetes service, include the connectivity option. This example shows the connectivity of the calico-etcd service:
View the Impact of Connectivity Loss for a Service
You can preview the impact on the service availabilty based on the loss of particular node using the impact option. The output is color coded (not shown in the example below) so you can clearly see the impact: green shows no impact, yellow shows partial impact, and red shows full impact.
cumulus@host:~$ netq server11 show impact kubernetes service name calico-etcd
calico-etcd -- calico-etcd-pfg9r -- server11:swp1:torbond1 -- swp6:hostbond2:torc-11
-- server11:swp2:torbond1 -- swp6:hostbond2:torc-12
-- server11:swp3:NetQBond-2 -- swp16:NetQBond-16:edge01
-- server11:swp4:NetQBond-2 -- swp16:NetQBond-16:edge02
View Kubernetes Cluster Configuration in the Past
You can use the around option to go back in time to check the network status and identify any changes that occurred on the network.
This example shows the current state of the network. Notice there is a node named server23. server23 is there because the node server22 went down and Kubernetes spun up a third replica on a different host to satisfy the deployment requirement.
View the Impact of Connectivity Loss for a Deployment
You can determine the impact on the Kubernetes deployment in the event a host or switch goes down. The output is color coded (not shown in the example below) so you can clearly see the impact: green shows no impact, yellow shows partial impact, and red shows full impact.
If you need to perform maintenance on the Kubernetes cluster itself, use the following commands to bring the cluster down and then back up.
If you need, get the list of all the nodes in the Kubernetes cluster:
cumulus@host:~$ kubectl get nodes
Have Kubernetes to drain the node so that the pods running on it are gracefully scheduled elsewhere:
cumulus@host:~$ kubectl drain <node name>
After the maintenance window is over, put the node back into the cluster so that Kubernetes can start scheduling pods on it again:
cumulus@host:~$ kubectl uncordon <node name>
Manage Events and Notifications
Events provide information about how the network and its devices are operating. NetQ allows you to view current events and compare that with events at an earlier time. Event notifications are available through Slack, PagerDuty, syslog, and Email channels and aid troubleshooting and resolution of problems in the network before they become critical.
Three types of events are available in NetQ:
System: wide range of events generated by the system about network protocols and services operation, hardware and software status, and system services
Threshold-based (TCA): selected set of system-related events generated based on user-configured threshold values
What Just Happened (WJH): network hardware events generated when you enable the WJH feature on NVIDIA Spectrum™ switches
The NetQ UI provides two event workflows and two summary tables:
Events|Alarms card: tracks critical severity system and TCA events for a given timeframe
Events|Info card: tracks all warning, info, and debug severity system and TCA events for a given timeframe
All Events table: lists all system events in the last 24 hours
What Just Happened table: lists the 1000 most recent WJH events in the last 24 hours
The NetQ CLI provides the netq show events command to view system and TCA events for a given timeframe. The netq show wjh-drop command lists all WJH events or those with a selected drop type.
To take advantage of these events, use the instructions contained in this topic to configure one or more notification channels for system and threshold-based events and setup WJH for selected switches.
Configure System Event Notifications
To take advantage of the various event messages generated and processed by NetQ, you must integrate with third-party event notification applications. You can integrate NetQ with Syslog, PagerDuty, Slack, and Email. A generic webhook channel also exists to send notifications to other third party applications. You can integrate with one or more of these applications simultaneously.
In an on-premises deployment, the NetQ On-premises Appliance or VM receives the raw data stream from the NetQ Agents, processes the data, stores, and delivers events to the Notification function. Notification then filters and sends messages to any configured notification applications. In a cloud deployment, the NetQ Cloud Appliance or VM passes the raw data stream on to the NetQ Cloud service for processing and delivery.
You can implement a proxy server (that sits between the NetQ Appliance or VM and the integration channels) that receives, processes and distributes the notifications rather than having them sent directly to the integration channel. If you use such a proxy, you must configure NetQ with the proxy information.
Notifications are generated for the following types of events:
Category
Events
Network Protocol Validations
BGP status and session state
MLAG (CLAG) status and session state
EVPN status and session state
LLDP status
OSPF status and session state
VLAN status and session state *
VXLAN status and session state *
Interfaces
Link status
Ports and cables status
MTU status
Services
NetQ Agent status
PTM*
SSH *
NTP status*
Traces
On-demand trace status
Scheduled trace status
Sensors
Fan status
PSU (power supply unit) status
Temperature status
System Software
Configuration File changes
Running Configuration File changes
Cumulus Linux Support status
Software Package status
Operating System version
Lifecycle Management status
System Hardware
Physical resources status
BTRFS status
SSD utilization status
* This type of event can only be viewed in the CLI with this release.
Event filters are based on rules you create. You must have at least one rule per filter. A select set of events can be triggered by a user-configured threshold.
Identifier of the service or process that generated the event
hostname
Hostname of network device where event occurred
severity
Severity level in which the given event is classified; debug, error, info, warning, or critical
message
Text description of event
For example:
You can integrate notification channels using the NetQ UI or the NetQ CLI.
Channels card: specify channels
Threshold Crossing Rules card: specify rules and filters, assign existing channels
-netq notification (channel|rule|filter) command: specify channels, rules, and filters
To set up the integrations, you must configure NetQ with at least one channel, one rule, and one filter. To refine what messages you want to view and where to send them, you can add additional rules and filters and set thresholds on supported event types. You can also configure a proxy server to receive, process, and forward the messages. This is accomplished using the NetQ UI and NetQ CLI in the following order:
Configure Basic NetQ Event Notifications
The simplest configuration you can create is one that sends all events generated by all interfaces to a single notification application. This is described here. For more granular configurations and examples, refer to Configure Advanced NetQ Event Notifications.
A notification configuration must contain one channel, one rule, and one filter. Creation of the configuration follows this same path:
Add a channel.
Add a rule that accepts a selected set events.
Add a filter that associates this rule with the newly created channel.
Create a Channel
The first step is to create a PagerDuty, Slack, syslog, or Email channel to receive the notifications.
You can use the NetQ UI or the NetQ CLI to create a Slack channel.
Click , and then click Notification Channels in the Notifications section.
The Slack tab is displayed by default.
Add a channel.
When no channels have been specified, click Add Slack Channel.
When at least one channel has been specified, click above the table.
Provide a unique name for the channel. Note that spaces are not allowed. Use dashes or camelCase instead.
Create an incoming webhook as described in the documentation for your version of Slack. Then copy and paste it here.
Click Add.
To verify the channel configuration, click Test.
Otherwise, click Close.
To return to your workbench, click in the top right corner of the card.
To create and verify the specification of a Slack channel, run:
cumulus@switch:~$ netq show notification channel
Matching config_notify records:
Name Type Severity Channel Info
--------------- ---------------- -------- ----------------------
slk-netq-events slack info webhook:https://hooks.s
lack.com/services/text/
moretext/evenmoretext
You can use the NetQ UI or the NetQ CLI to create a PagerDuty channel.
Click , and then click Notification Channels in the Notifications section.
Click PagerDuty.
Add a channel.
When no channels have been specified, click Add PagerDuty Channel.
When at least one channel has been specified, click above the table.
Provide a unique name for the channel. Note that spaces are not allowed. Use dashes or camelCase instead.
Obtain and enter an integration key (also called a service key or routing key).
Click Add.
Verify it is correctly configured.
Otherwise, click Close.
To return to your workbench, click in the top right corner of the card.
To create and verify the specification of a PagerDuty channel, run:
cumulus@switch:~$ netq show notification channel
Matching config_notify records:
Name Type Severity Channel Info
--------------- ---------------- ---------------- ------------------------
pd-netq-events pagerduty info integration-key: c6d666e
210a8425298ef7abde0d1998
You can use the NetQ UI or the NetQ CLI to create a Slack channel.
Click , and then click Notification Channels in the Notifications section.
Click Syslog.
Add a channel.
When no channels have been specified, click Add Syslog Channel.
When at least one channel has been specified, click above the table.
Provide a unique name for the channel. Note that spaces are not allowed. Use dashes or camelCase instead.
Enter the IP address and port of the Syslog server.
Click Add.
To verify the channel configuration, click Test.
Otherwise, click Close.
To return to your workbench, click in the top right corner of the card.
To create and verify the specification of a syslog channel, run:
netq add notification channel syslog <text-channel-name> hostname <text-syslog-hostname> port <text-syslog-port> [severity info | severity warning | severity error | severity debug]
netq show notification channel [json]
This example shows the creation of a syslog-netq-events channel and verifies the configuration.
Obtain the syslog server hostname (or IP address) and port.
cumulus@switch:~$ netq show notification channel
Matching config_notify records:
Name Type Severity Channel Info
--------------- ---------------- -------- ----------------------
syslog-netq-eve syslog info host:syslog-server
nts port: 514
You can use the NetQ UI or the NetQ CLI to create an Email channel.
Click , and then click Notification Channels in the Notifications section.
Click Email.
Add a channel.
When no channels have been specified, click Add Email Channel.
When at least one channel has been specified, click above the table.
Provide a unique name for the channel. Note that spaces are not allowed. Use dashes or camelCase instead.
Enter a list of emails for the persons who you want to receive the notifications from this channel.
Enter the emails separated by commas, and no spaces. For example: user1@domain.com,user2@domain.com,user3@domain.com.
The first time you configure an Email channel, you must also specify the SMTP server information:
Host: hostname or IP address of the SMTP server
Port: port of the SMTP server; typically 587
User ID/Password: your administrative credentials
From: email address that indicates who sent the event messages
After the first time, any additional email channels you create can use this configuration, by clicking Existing.
Click Add.
To verify the channel configuration, click Test.
Otherwise, click Close.
To return to your workbench, click in the top right corner of the card.
To create and verify the specification of an Email channel, run:
netq add notification channel email <text-channel-name> to <text-email-toids> [smtpserver <text-email-hostname>] [smtpport <text-email-port>] [login <text-email-id>] [password <text-email-password>] [severity info | severity warning | severity error | severity debug]
netq add notification channel email <text-channel-name> to <text-email-toids>
netq show notification channel [json]
The configuration is different depending on whether you are using the on-premises or cloud version of NetQ. Do not configure SMTP for cloud deployments as the NetQ cloud service uses the NetQ SMTP server to push email notifications.
For an on-premises deployment:
Set up an SMTP server. The server can be internal or public.
Create a user account (login and password) on the SMTP server. NetQ sends notifications to this address.
Create the notification channel using this form of the CLI command:
This example creates a rule named all-interfaces, using the key ifname and the value ALL, which sends all events from all interfaces to any channel with this rule.
cumulus@switch:~$ netq add notification rule all-interfaces key ifname value ALL
Successfully added/updated rule all-ifs
cumulus@switch:~$ netq show notification rule
Matching config_notify records:
Name Rule Key Rule Value
--------------- ---------------- --------------------
all-interfaces ifname ALL
If you want to create more granular notifications based on such items as selected devices, characteristics of devices, or protocols, or you want to use a proxy server, you need more than the basic notification configuration. The following section includes details for creating these more complex notification configurations.
Configure a Proxy Server
To send notification messages through a proxy server instead of directly to a notification channel, you configure NetQ with the hostname and optionally a port of a proxy server. If you do not specify a port, NetQ defaults to port 80. Only one proxy server is currently supported. To simplify deployment, configure your proxy server before configuring channels, rules, or filters.
cumulus@switch:~$ netq show notification channel
Matching config_notify records:
Name Type Severity Channel Info
--------------- ---------------- ---------------- ------------------------
pd-netq-events pagerduty info integration-key: c6d666e
210a8425298ef7abde0d1998
NetQ Notifier sends notifications to Slack as incoming webhooks for a
Slack channel you configure.
For example:
To create and verify the specification of a Slack channel, run:
WebHook URL for the desired channel. For example: https://hooks.slack.com/services/text/moretext/evenmoretext
severity <level>
The log level to set, which can be one of error, warning, info, or debug. The severity defaults to info.
tag <text-slack-tag>
Optional tag appended to the Slack notification to highlight particular channels or people. An @ sign must precede the tag value. For example, @netq-info.
This example shows the creation of a slk-netq-events channel and verifies the configuration.
Create an incoming webhook as described in the documentation for your version of Slack.
This example creates an email channel named onprem-email that uses the smtpserver on port 587 to send messages to those persons with access to the smtphostlogin account.
Set up an SMTP server. The server can be internal or public.
Create a user account (login and password) on the SMTP server. NetQ sends notifications to this address.
cumulus@switch:~$ netq show notification channel
Matching config_notify records:
Name Type Severity Channel Info
--------------- ---------------- ---------------- ------------------------
onprem-email email warning password: MyPassword123,
port: 587,
isEncrypted: True,
host: smtp.domain.com,
from: smtphostlogin@doma
in.com,
id: smtphostlogin@domain
.com,
to: netq-notifications@d
omain.com
In cloud deployments as the NetQ cloud service uses the NetQ SMTP server to push email notifications.
To create an Email notification channel for a cloud deployment, run:
netq add notification channel email <text-channel-name> to <text-email-toids> [severity info | severity warning | severity error | severity debug]
netq show notification channel [json]
This example creates an email channel named cloud-email that uses the NetQ SMTP server to send messages to those persons with access to the netq-cloud-notifications account.
URL of the remote application to receive notifications
severity <level>
The log level to set, which can be one of error, warning, info, or debug. The severity defaults to info.
use-ssl [True | False]
Enable or disable SSL
auth-type [basic-auth | api-key]
Set authentication parameters. Either basic-auth with generic-username and generic-password or api-key with a key-name and key-value
Create Rules
A single key-value pair comprises each rule. The key-value pair indicates what messages to include or drop from event information sent to a notification channel. You can create more than one rule for a single filter. Creating multiple rules for a given filter can provide a very defined filter. For example, you can specify rules around hostnames or interface names, enabling you to filter messages specific to those hosts or interfaces. You should have already defined channels (as described earlier).
NetQ includes a predefined fixed set of valid rule keys. You enter values as regular expressions, which vary according to your deployment.
Rule Keys and Values
Service
Rule Key
Description
Example Rule Values
BGP
message_type
Network protocol or service identifier
bgp
hostname
User-defined, text-based name for a switch or host
server02, leaf11, exit01, spine-4
peer
User-defined, text-based name for a peer switch or host
server4, leaf-3, exit02, spine06
desc
Text description
vrf
Name of VRF interface
mgmt, default
old_state
Previous state of the BGP service
Established, Failed
new_state
Current state of the BGP service
Established, Failed
old_last_reset_time
Previous time that BGP service was reset
Apr3, 2019, 4:17 PM
new_last_reset_time
Most recent time that BGP service was reset
Apr8, 2019, 11:38 AM
ConfigDiff
message_type
Network protocol or service identifier
configdiff
hostname
User-defined, text-based name for a switch or host
server02, leaf11, exit01, spine-4
vni
Virtual Network Instance identifier
12, 23
old_state
Previous state of the configuration file
created, modified
new_state
Current state of the configuration file
created, modified
EVPN
message_type
Network protocol or service identifier
evpn
hostname
User-defined, text-based name for a switch or host
server02, leaf-9, exit01, spine04
vni
Virtual Network Instance identifier
12, 23
old_in_kernel_state
Previous VNI state, in kernel or not
true, false
new_in_kernel_state
Current VNI state, in kernel or not
true, false
old_adv_all_vni_state
Previous VNI advertising state, advertising all or not
true, false
new_adv_all_vni_state
Current VNI advertising state, advertising all or not
true, false
LCM
message_type
Network protocol or service identifier
clag
hostname
User-defined, text-based name for a switch or host
server02, leaf-9, exit01, spine04
old_conflicted_bonds
Previous pair of interfaces in a conflicted bond
swp7 swp8, swp3 swp4
new_conflicted_bonds
Current pair of interfaces in a conflicted bond
swp11 swp12, swp23 swp24
old_state_protodownbond
Previous state of the bond
protodown, up
new_state_protodownbond
Current state of the bond
protodown, up
Link
message_type
Network protocol or service identifier
link
hostname
User-defined, text-based name for a switch or host
server02, leaf-6, exit01, spine7
ifname
Software interface name
eth0, swp53
LLDP
message_type
Network protocol or service identifier
lldp
hostname
User-defined, text-based name for a switch or host
server02, leaf41, exit01, spine-5, tor-36
ifname
Software interface name
eth1, swp12
old_peer_ifname
Previous software interface name
eth1, swp12, swp27
new_peer_ifname
Current software interface name
eth1, swp12, swp27
old_peer_hostname
Previous user-defined, text-based name for a peer switch or host
server02, leaf41, exit01, spine-5, tor-36
new_peer_hostname
Current user-defined, text-based name for a peer switch or host
server02, leaf41, exit01, spine-5, tor-36
MLAG (CLAG)
message_type
Network protocol or service identifier
clag
hostname
User-defined, text-based name for a switch or host
server02, leaf-9, exit01, spine04
old_conflicted_bonds
Previous pair of interfaces in a conflicted bond
swp7 swp8, swp3 swp4
new_conflicted_bonds
Current pair of interfaces in a conflicted bond
swp11 swp12, swp23 swp24
old_state_protodownbond
Previous state of the bond
protodown, up
new_state_protodownbond
Current state of the bond
protodown, up
Node
message_type
Network protocol or service identifier
node
hostname
User-defined, text-based name for a switch or host
server02, leaf41, exit01, spine-5, tor-36
ntp_state
Current state of NTP service
in sync, not sync
db_state
Current state of DB
Add, Update, Del, Dead
NTP
message_type
Network protocol or service identifier
ntp
hostname
User-defined, text-based name for a switch or host
server02, leaf-9, exit01, spine04
old_state
Previous state of service
in sync, not sync
new_state
Current state of service
in sync, not sync
Port
message_type
Network protocol or service identifier
port
hostname
User-defined, text-based name for a switch or host
server02, leaf13, exit01, spine-8, tor-36
ifname
Interface name
eth0, swp14
old_speed
Previous speed rating of port
10 G, 25 G, 40 G, unknown
old_transreceiver
Previous transceiver
40G Base-CR4, 25G Base-CR
old_vendor_name
Previous vendor name of installed port module
Amphenol, OEM, NVIDIA, Fiberstore, Finisar
old_serial_number
Previous serial number of installed port module
MT1507VS05177, AVE1823402U, PTN1VH2
old_supported_fec
Previous forward error correction (FEC) support status
User-defined, text-based name for a switch or host
server02, leaf-26, exit01, spine2-4
old_state
Previous state of a fan, power supply unit, or thermal sensor
Fan: ok, absent, bad PSU: ok, absent, bad Temp: ok, busted, bad, critical
new_state
Current state of a fan, power supply unit, or thermal sensor
Fan: ok, absent, bad PSU: ok, absent, bad Temp: ok, busted, bad, critical
old_s_state
Previous state of a fan or power supply unit.
Fan: up, down PSU: up, down
new_s_state
Current state of a fan or power supply unit.
Fan: up, down PSU: up, down
new_s_max
Current maximum temperature threshold value
Temp: 110
new_s_crit
Current critical high temperature threshold value
Temp: 85
new_s_lcrit
Current critical low temperature threshold value
Temp: -25
new_s_min
Current minimum temperature threshold value
Temp: -50
Services
message_type
Network protocol or service identifier
services
hostname
User-defined, text-based name for a switch or host
server02, leaf03, exit01, spine-8
name
Name of service
clagd, lldpd, ssh, ntp, netqd, netq-agent
old_pid
Previous process or service identifier
12323, 52941
new_pid
Current process or service identifier
12323, 52941
old_status
Previous status of service
up, down
new_status
Current status of service
up, down
Rule names are case sensitive, and you cannot use wildcards. Rule names can contain spaces, but you must enclose them with single quotes in commands. It is easier to use dashes in place of spaces or mixed case for better readability. For example, use *bgpSessionChanges* or *BGP-session-changes* or *BGPsessions*, instead of *BGP Session Changes*. Use Tab completion to view the command options syntax.
cumulus@switch:~$ netq add notification rule swp52 key port value swp52
Successfully added/updated rule swp52
View the Rule Configurations
Use the netq show notification command to view the rules on your
platform.
cumulus@switch:~$ netq show notification rule
Matching config_notify records:
Name Rule Key Rule Value
--------------- ---------------- --------------------
bgpHostname hostname spine-01
evpnVni vni 42
fecSupport new_supported_fe supported
c
overTemp new_s_crit 24
svcStatus new_status down
swp52 port swp52
sysconf configdiff updated
Create Filters
You can limit or direct event messages using filters. Filters get created based on rules you define, like those in the previous section. Each filter contains one or more rules. When a message matches the rule, it gets sent to the indicated destination. Before you can create filters, you need to have already defined the rules and configured channels (as described earlier).
As you create filters, they get added to the bottom of a filter list. By default, NetQ processes filters in the order they appear in this list (from top to bottom) until it finds a match. This means that NetQ first evaluates each event message by the first filter listed, and if it matches then NetQ it, ignoring all other filters, and the system moves on to the next event message received. If the event does not match the first filter, NetQ tests it against the second filter, and if it matches then NetQ processes it and the system moves on to the next event received, and so forth. NetQ ignores events that do not match any filter.
You mght have to change the order of filters in the list to ensure you capture the events you want and drop the events you do not want. This is possible using the before or after keywords to ensure one rule gets processed before or after another.
This diagram shows an example with four defined filters with sample output results.
Filter names can contain spaces, but must be enclosed with single quotes in commands. It is easier to use dashes in place of spaces or mixed case for better readability. For example, use bgpSessionChanges or BGP-session-changes or BGPsessions, instead of 'BGP Session Changes'. Filter names are also case sensitive.
Example Filters
Create a filter for BGP Events on a Particular Device:
Create a Filter to Drop Messages from a Given Interface, and match
against this filter before any other filters. To create a drop style
filter, do not specify a channel. To put the filter first, use the
before option.
Use the netq show notification command to view the filters on your
platform.
cumulus@switch:~$ netq show notification filter
Matching config_notify records:
Name Order Severity Channels Rules
--------------- ---------- ---------------- ---------------- ----------
swp52Drop 1 error NetqDefaultChann swp52
el
bgpSpine 2 info pd-netq-events bgpHostnam
e
vni42 3 warning pd-netq-events evpnVni
configChange 4 info slk-netq-events sysconf
newFEC 5 info slk-netq-events fecSupport
svcDown 6 critical slk-netq-events svcStatus
critTemp 7 critical onprem-email overTemp
Reorder Filters
When you look at the results of the netq show notification filter command above, you might notice that although you have the drop-based filter first (no point in looking at something you are going to drop anyway, so that is good), but the critical severity events get last, per the current definitions. If you wanted to process those before lesser severity events, you can reorder the list using the before and after options.
For example, to put the two critical severity event filters just below the drop filter:
You do not need to reenter all the severity, channel, and rule information for existing rules if you only want to change their processing order.
Run the netq show notification command again to verify the changes:
cumulus@switch:~$ netq show notification filter
Matching config_notify records:
Name Order Severity Channels Rules
--------------- ---------- ---------------- ---------------- ----------
swp52Drop 1 error NetqDefaultChann swp52
el
critTemp 2 critical onprem-email overTemp
svcDown 3 critical slk-netq-events svcStatus
bgpSpine 4 info pd-netq-events bgpHostnam
e
vni42 5 warning pd-netq-events evpnVni
configChange 6 info slk-netq-events sysconf
newFEC 7 info slk-netq-events fecSupport
Suppress Events
NetQ can generate many network events. You can configure whether to suppress any events from appearing in NetQ output. By default, all events get delivered.
You can suppress an event until a certain period of time; otherwise, the event gets suppressed for 2 years. Providing an end time eliminates the generation of messages for a short period of time, which is useful when you are testing a new network configuration and the switch might be generating many messages.
You can suppress events for the following types of messages:
agent: NetQ Agent messages
bgp: BGP-related messages
btrfsinfo: Messages related to the BTRFS file system in Cumulus Linux
clag: MLAG-related messages
clsupport: Messages generated when creating the cl-support script
configdiff: Messages related to the difference between two configurations
evpn: EVPN-related messages
link: Messages related to links, including state and interface name
ntp: NTP-related messages
ospf: OSPF-related messages
sensor: Messages related to various sensors
services: Service-related information, including whether a service is active or inactive
ssdutil: Messages related to the storage on the switch
Add an Event Suppression Configuration
When you add a new configuration, you can specify a scope, which limits the suppression in the following order:
Hostname.
Severity.
Message type-specific filters. For example, the target VNI for EVPN messages, or the interface name for a link message.
NetQ has a predefined set of filter conditions. To see these conditions, run netq show events-config show-filter-conditions:
cumulus@switch:~$ netq show events-config show-filter-conditions
Matching config_events records:
Message Name Filter Condition Name Filter Condition Hierarchy Filter Condition Description
------------------------ ------------------------------------------ ---------------------------------------------------- --------------------------------------------------------
evpn vni 3 Target VNI
evpn severity 2 Severity critical/info
evpn hostname 1 Target Hostname
clsupport fileAbsName 3 Target File Absolute Name
clsupport severity 2 Severity critical/info
clsupport hostname 1 Target Hostname
link new_state 4 up / down
link ifname 3 Target Ifname
link severity 2 Severity critical/info
link hostname 1 Target Hostname
ospf ifname 3 Target Ifname
ospf severity 2 Severity critical/info
ospf hostname 1 Target Hostname
sensor new_s_state 4 New Sensor State Eg. ok
sensor sensor 3 Target Sensor Name Eg. Fan, Temp
sensor severity 2 Severity critical/info
sensor hostname 1 Target Hostname
configdiff old_state 5 Old State
configdiff new_state 4 New State
configdiff type 3 File Name
configdiff severity 2 Severity critical/info
configdiff hostname 1 Target Hostname
ssdutil info 3 low health / significant health drop
ssdutil severity 2 Severity critical/info
ssdutil hostname 1 Target Hostname
agent db_state 3 Database State
agent severity 2 Severity critical/info
agent hostname 1 Target Hostname
ntp new_state 3 yes / no
ntp severity 2 Severity critical/info
ntp hostname 1 Target Hostname
bgp vrf 4 Target VRF
bgp peer 3 Target Peer
bgp severity 2 Severity critical/info
bgp hostname 1 Target Hostname
services new_status 4 active / inactive
services name 3 Target Service Name Eg.netqd, mstpd, zebra
services severity 2 Severity critical/info
services hostname 1 Target Hostname
btrfsinfo info 3 high btrfs allocation space / data storage efficiency
btrfsinfo severity 2 Severity critical/info
btrfsinfo hostname 1 Target Hostname
clag severity 2 Severity critical/info
clag hostname 1 Target Hostname
For example, to create a configuration called mybtrfs that suppresses OSPF-related events on leaf01 for the next 10 minutes, run:
When you filter for a message type, you must include the show-filter-conditions keyword to show the conditions associated with that message type and the hierarchy in which they get processed.
By putting all these channel, rule, and filter definitions together, you create a complete notification configuration. Using the three-step process outlined above, you can configure notifications like the following examples.
Create a Notification for BGP Events from a Selected Switch
This example creates a notification integration with a PagerDuty channel called pd-netq-events. It then creates a rule bgpHostname and a filter called 4bgpSpine for any notifications from spine-01. The result is that any info severity event messages from Spine-01 get filtered to the pd-netq-events channel.
cumulus@switch:~$ netq add notification channel pagerduty pd-netq-events integration-key 1234567890
Successfully added/updated channel pd-netq-events
cumulus@switch:~$ netq add notification rule bgpHostname key node value spine-01
Successfully added/updated rule bgpHostname
cumulus@switch:~$ netq add notification filter bgpSpine rule bgpHostname channel pd-netq-events
Successfully added/updated filter bgpSpine
cumulus@switch:~$ netq show notification channel
Matching config_notify records:
Name Type Severity Channel Info
--------------- ---------------- ---------------- ------------------------
pd-netq-events pagerduty info integration-key: 1234567
890
cumulus@switch:~$ netq show notification rule
Matching config_notify records:
Name Rule Key Rule Value
--------------- ---------------- --------------------
bgpHostname hostname spine-01
cumulus@switch:~$ netq show notification filter
Matching config_notify records:
Name Order Severity Channels Rules
--------------- ---------- ---------------- ---------------- ----------
bgpSpine 1 info pd-netq-events bgpHostnam
e
Create a Notification for Warnings on a Given EVPN VNI
This example creates a notification integration with a PagerDuty channel called pd-netq-events. It then creates a rule evpnVni and a filter called 3vni42 for any warnings messages from VNI 42 on the EVPN overlay network. The result is that any warning severity event messages from VNI 42 get filtered to the pd-netq-events channel.
cumulus@switch:~$ netq add notification channel pagerduty pd-netq-events integration-key 1234567890
Successfully added/updated channel pd-netq-events
cumulus@switch:~$ netq add notification rule evpnVni key vni value 42
Successfully added/updated rule evpnVni
cumulus@switch:~$ netq add notification filter vni42 rule evpnVni channel pd-netq-events
Successfully added/updated filter vni42
cumulus@switch:~$ netq show notification channel
Matching config_notify records:
Name Type Severity Channel Info
--------------- ---------------- ---------------- ------------------------
pd-netq-events pagerduty info integration-key: 1234567
890
cumulus@switch:~$ netq show notification rule
Matching config_notify records:
Name Rule Key Rule Value
--------------- ---------------- --------------------
bgpHostname hostname spine-01
evpnVni vni 42
cumulus@switch:~$ netq show notification filter
Matching config_notify records:
Name Order Severity Channels Rules
--------------- ---------- ---------------- ---------------- ----------
bgpSpine 1 info pd-netq-events bgpHostnam
e
vni42 2 warning pd-netq-events evpnVni
Create a Notification for Configuration File Changes
This example creates a notification integration with a Slack channel called slk-netq-events. It then creates a rule sysconf and a filter called configChange for any configuration file update messages. The result is that any configuration update messages get filtered to the slk-netq-events channel.
cumulus@switch:~$ netq add notification channel slack slk-netq-events webhook https://hooks.slack.com/services/text/moretext/evenmoretext
Successfully added/updated channel slk-netq-events
cumulus@switch:~$ netq add notification rule sysconf key message_type value configdiff
Successfully added/updated rule sysconf
cumulus@switch:~$ netq add notification filter configChange severity info rule sysconf channel slk-netq-events
Successfully added/updated filter configChange
cumulus@switch:~$ netq show notification channel
Matching config_notify records:
Name Type Severity Channel Info
--------------- ---------------- -------- ----------------------
slk-netq-events slack info webhook:https://hooks.s
lack.com/services/text/
moretext/evenmoretext
cumulus@switch:~$ netq show notification rule
Matching config_notify records:
Name Rule Key Rule Value
--------------- ---------------- --------------------
bgpHostname hostname spine-01
evpnVni vni 42
sysconf message_type configdiff
cumulus@switch:~$ netq show notification filter
Matching config_notify records:
Name Order Severity Channels Rules
--------------- ---------- ---------------- ---------------- ----------
bgpSpine 1 info pd-netq-events bgpHostnam
e
vni42 2 error pd-netq-events evpnVni
configChange 3 info slk-netq-events sysconf
Create a Notification for When a Service Goes Down
This example creates a notification integration with a Slack channel called slk-netq-events. It then creates a rule svcStatus and a filter called svcDown for any services state messages indicating a service is no longer operational. The result is that any service down messages get filtered to the slk-netq-events channel.
cumulus@switch:~$ netq add notification channel slack slk-netq-events webhook https://hooks.slack.com/services/text/moretext/evenmoretext
Successfully added/updated channel slk-netq-events
cumulus@switch:~$ netq add notification rule svcStatus key new_status value down
Successfully added/updated rule svcStatus
cumulus@switch:~$ netq add notification filter svcDown severity error rule svcStatus channel slk-netq-events
Successfully added/updated filter svcDown
cumulus@switch:~$ netq show notification channel
Matching config_notify records:
Name Type Severity Channel Info
--------------- ---------------- -------- ----------------------
slk-netq-events slack info webhook:https://hooks.s
lack.com/services/text/
moretext/evenmoretext
cumulus@switch:~$ netq show notification rule
Matching config_notify records:
Name Rule Key Rule Value
--------------- ---------------- --------------------
bgpHostname hostname spine-01
evpnVni vni 42
svcStatus new_status down
sysconf configdiff updated
cumulus@switch:~$ netq show notification filter
Matching config_notify records:
Name Order Severity Channels Rules
--------------- ---------- ---------------- ---------------- ----------
bgpSpine 1 info pd-netq-events bgpHostnam
e
vni42 2 warning pd-netq-events evpnVni
configChange 3 info slk-netq-events sysconf
svcDown 4 critical slk-netq-events svcStatus
Create a Filter to Drop Notifications from a Given Interface
This example creates a notification integration with a Slack channel called slk-netq-events. It then creates a rule swp52 and a filter called swp52Drop that drops all notifications for events from interface swp52.
cumulus@switch:~$ netq add notification channel slack slk-netq-events webhook https://hooks.slack.com/services/text/moretext/evenmoretext
Successfully added/updated channel slk-netq-events
cumulus@switch:~$ netq add notification rule swp52 key port value swp52
Successfully added/updated rule swp52
cumulus@switch:~$ netq add notification filter swp52Drop severity error rule swp52 before bgpSpine
Successfully added/updated filter swp52Drop
cumulus@switch:~$ netq show notification channel
Matching config_notify records:
Name Type Severity Channel Info
--------------- ---------------- -------- ----------------------
slk-netq-events slack info webhook:https://hooks.s
lack.com/services/text/
moretext/evenmoretext
cumulus@switch:~$ netq show notification rule
Matching config_notify records:
Name Rule Key Rule Value
--------------- ---------------- --------------------
bgpHostname hostname spine-01
evpnVni vni 42
svcStatus new_status down
swp52 port swp52
sysconf configdiff updated
cumulus@switch:~$ netq show notification filter
Matching config_notify records:
Name Order Severity Channels Rules
--------------- ---------- ---------------- ---------------- ----------
swp52Drop 1 error NetqDefaultChann swp52
el
bgpSpine 2 info pd-netq-events bgpHostnam
e
vni42 3 warning pd-netq-events evpnVni
configChange 4 info slk-netq-events sysconf
svcDown 5 critical slk-netq-events svcStatus
Create a Notification for a Given Device that Has a Tendency to Overheat (Using Multiple Rules)
This example creates a notification when switch leaf04 has passed over the high temperature threshold. Two rules were necessary to create this notification, one to identify the specific device and one to identify the temperature trigger. NetQ then sends the message to the pd-netq-events channel.
cumulus@switch:~$ netq add notification channel pagerduty pd-netq-events integration-key 1234567890
Successfully added/updated channel pd-netq-events
cumulus@switch:~$ netq add notification rule switchLeaf04 key hostname value leaf04
Successfully added/updated rule switchLeaf04
cumulus@switch:~$ netq add notification rule overTemp key new_s_crit value 24
Successfully added/updated rule overTemp
cumulus@switch:~$ netq add notification filter critTemp rule switchLeaf04 channel pd-netq-events
Successfully added/updated filter critTemp
cumulus@switch:~$ netq add notification filter critTemp severity critical rule overTemp channel pd-netq-events
Successfully added/updated filter critTemp
cumulus@switch:~$ netq show notification channel
Matching config_notify records:
Name Type Severity Channel Info
--------------- ---------------- ---------------- ------------------------
pd-netq-events pagerduty info integration-key: 1234567
890
cumulus@switch:~$ netq show notification rule
Matching config_notify records:
Name Rule Key Rule Value
--------------- ---------------- --------------------
bgpHostname hostname spine-01
evpnVni vni 42
overTemp new_s_crit 24
svcStatus new_status down
switchLeaf04 hostname leaf04
swp52 port swp52
sysconf configdiff updated
cumulus@switch:~$ netq show notification filter
Matching config_notify records:
Name Order Severity Channels Rules
--------------- ---------- ---------------- ---------------- ----------
swp52Drop 1 error NetqDefaultChann swp52
el
bgpSpine 2 info pd-netq-events bgpHostnam
e
vni42 3 warning pd-netq-events evpnVni
configChange 4 info slk-netq-events sysconf
svcDown 5 critical slk-netq-events svcStatus
critTemp 6 critical pd-netq-events switchLeaf
04
overTemp
View Notification Configurations in JSON Format
You can view configured integrations using the netq show notification commands. To view the channels, filters, and rules, run the three flavors of the command. Include the json option to display JSON-formatted output.
You might need to modify event notification configurations at some point in the lifecycle of your deployment. You can add channels, rules, filters, and a proxy at any time. You can remove channels, rules, and filters if they are not part of an existing notification configuration.
If you retire selected channels from a given notification application, you might want to remove them from NetQ as well. You can remove channels if they are not part of an existing notification configuration using the NetQ UI or the NetQ CLI.
To remove notification channels:
Click , and then click Channels in the Notifications column.
This opens the Channels view.
Click the tab for the type of channel you want to remove (Slack, PagerDuty, syslog, Email).
Select one or more channels.
Click .
To remove notification channels, run:
netq config del notification channel <text-channel-name-anchor>
This example removes a Slack integration and verifies it is no longer in
the configuration:
cumulus@switch:~$ netq del notification channel slk-netq-events
cumulus@switch:~$ netq show notification channel
Matching config_notify records:
Name Type Severity Channel Info
--------------- ---------------- ---------------- ------------------------
pd-netq-events pagerduty info integration-key: 1234567
890
Delete an Event Notification Rule
You might find after some experience with a given rule that you want to edit or remove the rule to better meet your needs. You can remove rules if they are not part of an existing notification configuration using the NetQ CLI.
To remove notification rules, run:
netq config del notification rule <text-rule-name-anchor>
This example removes a rule named swp52 and verifies it is no longer in
the configuration:
cumulus@switch:~$ netq del notification rule swp52
cumulus@switch:~$ netq show notification rule
Matching config_notify records:
Name Rule Key Rule Value
--------------- ---------------- --------------------
bgpHostname hostname spine-01
evpnVni vni 42
overTemp new_s_crit 24
svcStatus new_status down
switchLeaf04 hostname leaf04
sysconf configdiff updated
Delete an Event Notification Filter
You might find after some experience with a given filter that you want to edit or remove the filter to better meet your current needs. You can remove filters if they are not part of an existing notification configuration using the NetQ CLI.
To remove notification filters, run:
netq del notification filter <text-filter-name-anchor>
This example removes a filter named bgpSpine and verifies it is no longer in
the configuration:
cumulus@switch:~$ netq del notification filter bgpSpine
cumulus@switch:~$ netq show notification filter
Matching config_notify records:
Name Order Severity Channels Rules
--------------- ---------- ---------------- ---------------- ----------
swp52Drop 1 error NetqDefaultChann swp52
el
vni42 2 warning pd-netq-events evpnVni
configChange 3 info slk-netq-events sysconf
svcDown 4 critical slk-netq-events svcStatus
critTemp 5 critical pd-netq-events switchLeaf
04
overTemp
Delete an Event Notification Proxy
You can remove the proxy server by running the netq del notification proxy command. This changes the NetQ behavior to send events directly to the notification channels.
cumulus@switch:~$ netq del notification proxy
Successfully overwrote notifier proxy to null
Configure Threshold-Based Event Notifications
NetQ supports TCA events, which are a set of events that trigger at the crossing of a user-defined threshold. These events allow detection and prevention of network failures for selected ACL resources, digital optics, forwarding resources, interface errors and statistics, link flaps, resource utilization, and sensor events. You can find a complete list in the TCA Event Messages Reference.
A notification configuration must contain one rule. Each rule must contain a scope and a threshold. Optionally, you can specify an associated channel. If you want to deliver events to one or more notification channels (email, syslog, Slack, or PagerDuty), create them by following the instructions in Create a Channel, and then return here to define your rule.
If a rule is not associated with a channel, the event information is only reachable from the database.
Define a Scope
You use a scope to filter the events generated by a given rule. You set the scope values on a per TCA rule basis. You can filter all rules on the hostname. You can also filter some rules by other parameters.
Select Filter Parameters
For each event type, you can filter rules based on the following filter parameters.
Event ID
Scope Parameters
TCA_TCAM_IN_ACL_V4_FILTER_UPPER
Hostname
TCA_TCAM_EG_ACL_V4_FILTER_UPPER
Hostname
TCA_TCAM_IN_ACL_V4_MANGLE_UPPER
Hostname
TCA_TCAM_EG_ACL_V4_MANGLE_UPPER
Hostname
TCA_TCAM_IN_ACL_V6_FILTER_UPPER
Hostname
TCA_TCAM_EG_ACL_V6_FILTER_UPPER
Hostname
TCA_TCAM_IN_ACL_V6_MANGLE_UPPER
Hostname
TCA_TCAM_EG_ACL_V6_MANGLE_UPPER
Hostname
TCA_TCAM_IN_ACL_8021x_FILTER_UPPER
Hostname
TCA_TCAM_ACL_L4_PORT_CHECKERS_UPPER
Hostname
TCA_TCAM_ACL_REGIONS_UPPER
Hostname
TCA_TCAM_IN_ACL_MIRROR_UPPER
Hostname
TCA_TCAM_ACL_18B_RULES_UPPER
Hostname
TCA_TCAM_ACL_32B_RULES_UPPER
Hostname
TCA_TCAM_ACL_54B_RULES_UPPER
Hostname
TCA_TCAM_IN_PBR_V4_FILTER_UPPER
Hostname
TCA_TCAM_IN_PBR_V6_FILTER_UPPER
Hostname
Event ID
Scope Parameters
TCA_DOM_RX_POWER_ALARM_UPPER
Hostname, Interface
TCA_DOM_RX_POWER_ALARM_LOWER
Hostname, Interface
TCA_DOM_RX_POWER_WARNING_UPPER
Hostname, Interface
TCA_DOM_RX_POWER_WARNING_LOWER
Hostname, Interface
TCA_DOM_BIAS_CURRENT_ALARM_UPPER
Hostname, Interface
TCA_DOM_BIAS_CURRENT_ALARM_LOWER
Hostname, Interface
TCA_DOM_BIAS_CURRENT_WARNING_UPPER
Hostname, Interface
TCA_DOM_BIAS_CURRENT_WARNING_LOWER
Hostname, Interface
TCA_DOM_OUTPUT_POWER_ALARM_UPPER
Hostname, Interface
TCA_DOM_OUTPUT_POWER_ALARM_LOWER
Hostname, Interface
TCA_DOM_OUTPUT_POWER_WARNING_UPPER
Hostname, Interface
TCA_DOM_OUTPUT_POWER_WARNING_LOWER
Hostname, Interface
TCA_DOM_MODULE_TEMPERATURE_ALARM_UPPER
Hostname, Interface
TCA_DOM_MODULE_TEMPERATURE_ALARM_LOWER
Hostname, Interface
TCA_DOM_MODULE_TEMPERATURE_WARNING_UPPER
Hostname, Interface
TCA_DOM_MODULE_TEMPERATURE_WARNING_LOWER
Hostname, Interface
TCA_DOM_MODULE_VOLTAGE_ALARM_UPPER
Hostname, Interface
TCA_DOM_MODULE_VOLTAGE_ALARM_LOWER
Hostname, Interface
TCA_DOM_MODULE_VOLTAGE_WARNING_UPPER
Hostname, Interface
TCA_DOM_MODULE_VOLTAGE_WARNING_LOWER
Hostname, Interface
Event ID
Scope Parameters
TCA_TCAM_TOTAL_ROUTE_ENTRIES_UPPER
Hostname
TCA_TCAM_TOTAL_MCAST_ROUTES_UPPER
Hostname
TCA_TCAM_MAC_ENTRIES_UPPER
Hostname
TCA_TCAM_ECMP_NEXTHOPS_UPPER
Hostname
TCA_TCAM_IPV4_ROUTE_UPPER
Hostname
TCA_TCAM_IPV4_HOST_UPPER
Hostname
TCA_TCAM_IPV6_ROUTE_UPPER
Hostname
TCA_TCAM_IPV6_HOST_UPPER
Hostname
Event ID
Description
TCA_HW_IF_OVERSIZE_ERRORS
Hostname, Interface
TCA_HW_IF_UNDERSIZE_ERRORS
Hostname, Interface
TCA_HW_IF_ALIGNMENT_ERRORS
Hostname, Interface
TCA_HW_IF_JABBER_ERRORS
Hostname, Interface
TCA_HW_IF_SYMBOL_ERRORS
Hostname, Interface
Event ID
Scope Parameters
TCA_RXBROADCAST_UPPER
Hostname, Interface
TCA_RXBYTES_UPPER
Hostname, Interface
TCA_RXMULTICAST_UPPER
Hostname, Interface
TCA_TXBROADCAST_UPPER
Hostname, Interface
TCA_TXBYTES_UPPER
Hostname, Interface
TCA_TXMULTICAST_UPPER
Hostname, Interface
Event ID
Description
TCA_LINK
Hostname, Interface
Event ID
Scope Parameters
TCA_CPU_UTILIZATION_UPPER
Hostname
TCA_DISK_UTILIZATION_UPPER
Hostname
TCA_MEMORY_UTILIZATION_UPPER
Hostname
Event ID
Scope Parameters
Tx CNP Unicast No Buffer Discard
Hostname, Interface
Rx RoCE PFC Pause Duration
Hostname
Rx RoCE PG Usage Cells
Hostname, Interface
Tx RoCE TC Usage Cells
Hostname, Interface
Rx RoCE No Buffer Discard
Hostname, Interface
Tx RoCE PFC Pause Duration
Hostname, Interface
Tx CNP Buffer Usage Cells
Hostname, Interface
Tx ECN Marked Packets
Hostname, Interface
Tx RoCE PFC Pause Packets
Hostname, Interface
Rx CNP No Buffer Discard
Hostname, Interface
Rx CNP PG Usage Cells
Hostname, Interface
Tx CNP TC Usage Cells
Hostname, Interface
Rx RoCE Buffer Usage Cells
Hostname, Interface
Tx RoCE Unicast No Buffer Discard
Hostname, Interface
Rx CNP Buffer Usage Cells
Hostname, Interface
Rx RoCE PFC Pause Packets
Hostname, Interface
Tx RoCE Buffer Usage Cells
Hostname, Interface
Event ID
Scope Parameters
TCA_SENSOR_FAN_UPPER
Hostname, Sensor Name
TCA_SENSOR_POWER_UPPER
Hostname, Sensor Name
TCA_SENSOR_TEMPERATURE_UPPER
Hostname, Sensor Name
TCA_SENSOR_VOLTAGE_UPPER
Hostname, Sensor Name
Event ID
Scope Parameters
TCA_WJH_DROP_AGG_UPPER
Hostname, Reason
TCA_WJH_ACL_DROP_AGG_UPPER
Hostname, Reason, Ingress port
TCA_WJH_BUFFER_DROP_AGG_UPPER
Hostname, Reason
TCA_WJH_SYMBOL_ERROR_UPPER
Hostname, Port down reason
TCA_WJH_CRC_ERROR_UPPER
Hostname, Port down reason
Specify the Scope
Rules require a scope. The scope can be the entire complement of monitored devices or a subset. You define scopes as regular expressions, and they appear as regular expressions in NetQ. Each event has a set of attributes you can use to apply the rule to a subset of all devices. The definition and display is slightly different between the NetQ UI and the NetQ CLI, but the results are the same.
You define the scope in the Choose Attributes step when creating a TCA event rule. You can choose to apply the rule to all devices or narrow the scope using attributes. If you choose to narrow the scope, but then do not enter any values for the available attributes, the result is all devices and attributes.
Scopes appear in TCA rule cards using the following format: Attribute, Operation, Value.
In this example, three attributes are available. For one or more of these attributes, select the operation (equals or starts with) and enter a value. For drop reasons, click in the value field to open a list of reasons, and select one from the list.
Note that you should leave the drop type attribute blank.
Create rule to show events from a …
Attribute
Operation
Value
Single device
hostname
Equals
<hostname> such as spine01
Single interface
ifname
Equals
<interface-name> such as swp6
Single sensor
s_name
Equals
<sensor-name> such as fan2
Single WJH drop reason
reason or port_down_reason
Equals
<drop-reason> such as WRED
Single WJH ingress port
ingress_port
Equals
<port-name> such as 47
Set of devices
hostname
Starts with
<partial-hostname> such as leaf
Set of interfaces
ifname
Starts with
<partial-interface-name> such as swp or eth
Set of sensors
s_name
Starts with
<partial-sensor-name> such as fan, temp, or psu
Refer to WJH Event Messages Reference for WJH drop types and reasons. Leaving an attribute value blank defaults to all; all hostnames, interfaces, sensors, forwarding resources, ACL resources, and so forth.
Each attribute is displayed on the rule card as a regular expression equivalent to your choices above:
Equals is displayed as an equals sign (=)
Starts with is displayed as a caret (^)
Blank (all) is displayed as an asterisk (*)
Scopes are defined with regular expressions. When more than one scoping parameter is available, they must be separated by a comma (without spaces), and all parameters must be defined in order. When an asterisk (*) is used alone, it must be entered inside either single or double quotes. Single quotes are used here.
The single hostname scope parameter is used by the ACL resources, forwarding resources, and resource utilization events.
Scope Value
Example
Result
<hostname>
leaf01
Deliver events for the specified device
<partial-hostname>*
leaf*
Deliver events for devices with hostnames starting with specified text (leaf)
The hostname and interface scope parameters are used by the digital optics, interface errors, interface statistics, and link flaps events.
Scope Value
Example
Result
<hostname>,<interface>
leaf01,swp9
Deliver events for the specified interface (swp9) on the specified device (leaf01)
<hostname>,'*'
leaf01,'*'
Deliver events for all interfaces on the specified device (leaf01)
'*',<interface>
'*',swp9
Deliver events for the specified interface (swp9) on all devices
<partial-hostname>*,<interface>
leaf*,swp9
Deliver events for the specified interface (swp9) on all devices with hostnames starting with the specified text (leaf)
<hostname>,<partial-interface>*
leaf01,swp*
Deliver events for all interface with names starting with the specified text (swp) on the specified device (leaf01)
The hostname and sensor name scope parameters are used by the sensor events.
Scope Value
Example
Result
<hostname>,<sensorname>
leaf01,fan1
Deliver events for the specified sensor (fan1) on the specified device (leaf01)
'*',<sensorname>
'*',fan1
Deliver events for the specified sensor (fan1) for all devices
<hostname>,'*'
leaf01,'*'
Deliver events for all sensors on the specified device (leaf01)
<partial-hostname>*,<interface>
leaf*,fan1
Deliver events for the specified sensor (fan1) on all devices with hostnames starting with the specified text (leaf)
<hostname>,<partial-sensorname>*
leaf01,fan*
Deliver events for all sensors with names starting with the specified text (fan) on the specified device (leaf01)
The hostname, reason/port down reason, ingress port, and drop type scope parameters are used by the What Just Happened events.
Scope Value
Example
Result
<hostname>,<reason>,<ingress_port>,<drop_type>
leaf01,ingress-port-acl,'*','*'
Deliver WJH events for all ports on the specified device (leaf01) with the specified reason triggered (ingress-port-acl exceeded the threshold)
'*',<reason>,'*'
'*',tail-drop,'*'
Deliver WJH events for the specified reason (tail-drop) for all devices
Deliver WJH events for the specified reason (calibration-failure) on all devices with hostnames starting with the specified text (leaf)
<hostname>,<partial-reason>*,<drop_type>
leaf01,blackhole,'*'
Deliver WJH events for reasons starting with the specified text (blackhole [route]) on the specified device (leaf01)
Create a TCA Rule
Now that you know which events are supported and how to set the scope, you can create a basic rule to deliver one of the TCA events to a notification channel. This can be done using either the NetQ UI or the NetQ CLI.
To create a TCA rule:
Click to open the Main Menu.
Click Threshold Crossing Rules under Notifications.
Select the event type for the rule you want to create. Note that the total count of rules for each event type is also shown.
Click Create a Rule or (Add rule) to add a rule.
The Create TCA Rule dialog opens. Four steps create the rule.
You can move forward and backward until you are satisfied with your rule definition.
On the Enter Details step, enter a name for your rule and assign a severity. Verify the event type.
The rule name has a maximum of 20 characters (including spaces).
Click Next.
On the Choose Attribute step, select the attribute to measure against.
The attributes presented depend on the event type chosen in the Enter Details step. This example shows the attributes available when Resource Utilization was selected.
Click Next.
On the Set Threshold step, enter a threshold value.
For Digital Optics, you can choose to use the thresholds defined by the optics vendor (default) or specify your own.
Define the scope of the rule.
If you want to restrict the rule based on a particular parameter, enter values for one or more of the available attributes. For What Just Happened rules, select a reason from the available list.
If you want the rule to apply to all devices, click the scope toggle.
Click Next.
Optionally, select a notification channel where you want the events to be sent.
Only previously created channels are available for selection. If no channel is available or selected, the notifications can only be retrieved from the database. You can add a channel at a later time and then add it to the rule. Refer to Create a Channel and Modify TCA Rules.
Click Finish.
This example shows two interface statistics rules. The rule on the left triggers an informational event when the total received bytes exceeds the upper threshold of 5 M on any switches. The rule on the right triggers an alarm event when any switch exceeds the total received broadcast bytes af 560 K, indicating a broadcast storm. Note that the cards indicate both rules are currently Active.
The simplest configuration you can create is one that sends a TCA event generated by all devices and all interfaces to a single notification application. Use the netq add tca command to configure the event. Its syntax is:
Note that the event ID is case sensitive and must be in all uppercase.
For example, this rule tells NetQ to deliver an event notification to the tca_slack_ifstats pre-configured Slack channel when the CPU utilization exceeds 95% of its capacity on any monitored switch:
This rule tells NetQ to deliver an event notification to the tca_pd_ifstats PagerDuty channel when the number of transmit bytes per second (Bps) on the leaf12 switch exceeds 20,000 Bps on any interface:
This rule tells NetQ to deliver an event notification to the syslog-netq syslog channel when the temperature on sensor temp1 on the leaf12 switch exceeds 32 degrees Celcius:
This rule tells NetQ to deliver an event notification to the tca-slack channel when the total number of ACL drops on the leaf04 switch exceeds 20,000 for any reason, ingress port, or drop type.
For a Slack channel, the event messages should be similar to this:
Set the Severity of a Threshold-based Event
In addition to defining a scope for TCA rule, you can also set a severity of either info or critical. To add a severity to a rule, use the severity option.
For example, if you want to add a critical severity to the CPU utilization rule you created earlier:
Digital optics have the additional option of applying user- or vendor-defined thresholds, using the threshold_type and threshold options.
This example shows how to send an alarm event on channel ch1 when the upper threshold for module voltage exceeds the vendor-defined thresholds for interface swp31 on the mlx-2700-04 switch.
This example shows how to send an alarm event on channel ch1 when the upper threshold for module voltage exceeds the user-defined threshold of 3V for interface swp31 on the mlx-2700-04 switch.
Now you have four rules created (the original one, plus these three new ones) all based on the TCA_SENSOR_TEMPERATURE_UPPER event. To identify the various rules, NetQ automatically generates a TCA name for each rule. As you create each rule, NetQ adds an _# to the event name. The TCA Name for the first rule created is then TCA_SENSOR_TEMPERATURE_UPPER_1, the second rule created for this event is TCA_SENSOR_TEMPERATURE_UPPER_2, and so forth.
Manage Threshold-based Event Notifications
After you create some rules, you might want to modify them; view a list of them, disable a rule, delete a rule, and so forth.
View TCA Rules
You can view all the threshold-crossing event rules you have created in the NetQ UI or the NetQ CLI.
Click .
Select Threshold Crossing Rules under Notifications.
A card appears for every rule.
When you have at least one rule created, you can use the filters that appear above the rule cards to find the rules of interest. Filter by status, severity, channel, and/or events. When a filter is applied a badge indicating the number of items in the filter is shown on the filter dropdown.
To view TCA rules, run:
netq show tca [tca_id <text-tca-id-anchor>] [json]
This example displays all TCA rules:
cumulus@switch:~$ netq show tca
Matching config_tca records:
TCA Name Event Name Scope Severity Channel/s Active Threshold Unit Threshold Type Suppress Until
---------------------------- -------------------- -------------------------- -------- ------------------ ------ ------------------ -------- -------------- ----------------------------
TCA_CPU_UTILIZATION_UPPER_1 TCA_CPU_UTILIZATION_ {"hostname":"leaf01"} info pd-netq-events,slk True 87 % user_set Fri Oct 9 15:39:35 2020
UPPER -netq-events
TCA_CPU_UTILIZATION_UPPER_2 TCA_CPU_UTILIZATION_ {"hostname":"*"} critical slk-netq-events True 93 % user_set Fri Oct 9 15:39:56 2020
UPPER
TCA_DOM_BIAS_CURRENT_ALARM_U TCA_DOM_BIAS_CURRENT {"hostname":"leaf*","ifnam critical slk-netq-events True 0 mA vendor_set Fri Oct 9 16:02:37 2020
PPER_1 _ALARM_UPPER e":"*"}
TCA_DOM_RX_POWER_ALARM_UPPER TCA_DOM_RX_POWER_ALA {"hostname":"*","ifname":" info slk-netq-events True 0 mW vendor_set Fri Oct 9 15:25:26 2020
_1 RM_UPPER *"}
TCA_SENSOR_TEMPERATURE_UPPER TCA_SENSOR_TEMPERATU {"hostname":"leaf","s_name critical slk-netq-events True 32 degreeC user_set Fri Oct 9 15:40:18 2020
_1 RE_UPPER ":"temp1"}
TCA_TCAM_IPV4_ROUTE_UPPER_1 TCA_TCAM_IPV4_ROUTE_ {"hostname":"*"} critical pd-netq-events True 20000 % user_set Fri Oct 9 16:13:39 2020
UPPER
This example displays a specific TCA rule:
cumulus@switch:~$ netq show tca tca_id TCA_TXMULTICAST_UPPER_1
Matching config_tca records:
TCA Name Event Name Scope Severity Channel/s Active Threshold Suppress Until
---------------------------- -------------------- -------------------------- ---------------- ------------------ ------ ------------------ ----------------------------
TCA_TXMULTICAST_UPPER_1 TCA_TXMULTICAST_UPPE {"ifname":"swp3","hostname info tca-tx-bytes-slack True 0 Sun Dec 8 16:40:14 2269
R ":"leaf01"}
Change the Threshold on a TCA Rule
After receiving notifications based on a rule, you might find that you want to increase or decrease the threshold value to limit or increase the events you receive. You can accomplish this with the NetQ UI or the NetQ CLI.
To modify the threshold:
Click to open the Main Menu.
Click Threshold Crossing Rules under Notifications.
Locate the rule you want to modify and hover over the card.
After receiving notifications based on a rule, you might find that you want to narrow or widen the scope value to limit or increase the events you receive. You can accomplish this with the NetQ UI or the NetQ CLI.
To modify the scope:
Click to open the Main Menu.
Click Threshold Crossing Rules under Notifications.
Locate the rule you want to modify and hover over the card.
Click .
Change the scope, applying the rule to all devices or broadening or narrowing the scope. Refer to Specify the Scope for details.
In this example, the scope is across the entire network. Toggle the scope and select one or more hosts on which to apply this rule.
This example changes the scope for the rule TCA_CPU_UTILIZATION_UPPER to apply only to switches beginning with a hostname of leaf. You must also provide a threshold value. This example case uses a value of 95 percent. Note that this overwrites the existing scope and threshold values.
cumulus@switch:~$ netq add tca event_id TCA_CPU_UTILIZATION_UPPER scope hostname^leaf threshold 95
Successfully added/updated tca
cumulus@switch:~$ netq show tca
Matching config_tca records:
TCA Name Event Name Scope Severity Channel/s Active Threshold Suppress Until
---------------------------- -------------------- -------------------------- ---------------- ------------------ ------ ------------------ ----------------------------
TCA_CPU_UTILIZATION_UPPER_1 TCA_CPU_UTILIZATION_ {"hostname":"*"} critical onprem-email True 93 Mon Aug 31 20:59:57 2020
UPPER
TCA_CPU_UTILIZATION_UPPER_2 TCA_CPU_UTILIZATION_ {"hostname":"hostname^leaf info True 95 Tue Sep 1 18:47:24 2020
UPPER "}
Change, Add, or Remove the Channels on a TCA Rule
You can change the channels associated with a TCA rule, add more channels to receive the same events, or remove channels that you no longer want to receive the associated events.
Click to open the Main Menu.
Click Threshold Crossing Rules under Notifications.
Locate the rule you want to modify and hover over the card.
Click .
Click Channels.
Select one or more channels.
Click a channel to select it. Click again to unselect a channel.
You cannot change the name of a TCA rule using the NetQ CLI because the rules do not have names. They receive identifiers (the tca_id) automatically. In the NetQ UI, to change a rule name, you must delete the rule and re-create it with the new name. Refer to Delete a TCA Rule and then Create a TCA Rule.
Change the Severity of a TCA Rule
TCA rules have either an informational or critical severity.
In the NetQ UI, the severity cannot change by itself, you must delete the rule and re-create it using the new severity. Refer to Delete a TCA Rule and then Create a TCA Rule.
In the NetQ CLI, to change the severity, run:
netq add tca tca_id <text-tca-id-anchor> (severity info | severity critical)
This example changes the severity of the maximum CPU utilization 1 rule from critical to info:
During troubleshooting or maintenance of switches you might want to suppress a rule to prevent erroneous event messages. You accomplish this using the NetQ UI or the NetQ CLI.
The TCA rules have three possible states in the NetQ UI:
Active: Rule is operating, delivering events. This is the normal operating state.
Suppressed: Rule is disabled until a designated date and time. When that time occurs, the rule is automatically reenabled. This state is useful during troubleshooting or maintenance of a switch when you do not want erroneous events being generated.
Disabled: Rule is disabled until a user manually reenables it. This state is useful when you are unclear when you want the rule to be reenabled. This is not the same as deleting the rule.
To suppress a rule for a designated amount of time, you must change the state of the rule.
To suppress a rule:
Click to open the Main Menu.
Click Threshold Crossing Rules under Notifications.
Locate the rule you want to suppress.
Click Disable.
Click in the Date/Time field to set when you want the rule to be automatically reenabled.
Click Disable.
Note the changes in the card:
The state is now marked as Inactive, but remains green
The date and time that the rule will be enabled is noted in the Suppressed field
The Disable option has changed to Disable Forever. Refer to Disable a TCA Rule for information about this change.
Using the suppress_until option allows you to prevent the rule from being applied for a designated amout of time (in seconds). When this time has passed, the rule is automatically reenabled.
Whereas suppression temporarily disables a rule, you can deactivate a rule to disable it indefinitely. You can disable a rule using the NetQ UI or the NetQ CLI.
The TCA rules have three possible states in the NetQ UI:
Active: Rule is operating, delivering events. This is the normal operating state.
Suppressed: Rule is disabled until a designated date and time. When that time occurs, the rule is automatically reenabled. This state is useful during troubleshooting or maintenance of a switch when you do not want erroneous events being generated.
Disabled: Rule is disabled until a user manually reenables it. This state is useful when you are unclear when you want the rule to be reenabled. This is not the same as deleting the rule.
To disable a rule that is currently active:
Click to open the Main Menu.
Click Threshold Crossing Rules under Notifications.
Locate the rule you want to disable.
Click Disable.
Leave the Date/Time field blank.
Click Disable.
Note the changes in the card:
The state is now marked as Inactive and is red
The rule definition is grayed out
The Disable option has changed to Enable to reactivate the rule when you are ready
To disable a rule that is currently suppressed:
Click to open the Main Menu.
Click Threshold Crossing Rules under Notifications.
Locate the rule you want to disable.
Click Disable Forever.
Note the changes in the card:
The state is now marked as Inactive and is red
The rule definition is grayed out
The Disable option has changed to Enable to reactivate the rule when you are ready
To reenable the rule, set the is_active option to true.
Delete a TCA Rule
You might find that you no longer want to receive event notifications for a particular TCA event. In that case, you can either disable the event if you think you might want to receive them again or delete the rule altogether. Refer to Disable a TCA Rule for the first case. Follow the instructions here to remove the rule using either the NetQ UI or NetQ CLI.
The rule can be in any of the three states, active, suppressed, or disabled.
To delete a rule:
Click to open the Main Menu.
Click Threshold Crossing Rules under Notifications.
Locate the rule you want to remove and hover over the card.
Click .
To remove a rule altogether, run:
netq del tca tca_id <text-tca-id-anchor>
This example deletes the maximum receive bytes rule:
cumulus@switch:~$ netq del tca tca_id TCA_RXBYTES_UPPER_1
Successfully deleted TCA TCA_RXBYTES_UPPER_1
Resolve Scope Conflicts
There might be occasions where the scope defined by the multiple rules for a given TCA event might overlap each other. In such cases, NetQ uses the TCA rule with the most specific scope that is still true to generate the event.
To clarify this, consider this example. Three events occurred:
First event on switch leaf01, interface swp1
Second event on switch leaf01, interface swp3
Third event on switch spine01, interface swp1
NetQ attempts to match the TCA event against hostname and interface name with three TCA rules with different scopes:
Scope 1 send events for the swp1 interface on switch leaf01 (very specific)
Scope 2 send events for all interfaces on switches that start with leaf (moderately specific)
Scope 3 send events for all switches and interfaces (very broad)
The result is:
For the first event, NetQ applies the scope from rule 1 because it matches scope 1 exactly
For the second event, NetQ applies the scope from rule 2 because it does not match scope 1, but does match scope 2
For the third event, NetQ applies the scope from rule 3 because it does not match either scope 1 or scope 2
In summary:
Input Event
Scope Parameters
TCA Scope 1
TCA Scope 2
TCA Scope 3
Scope Applied
leaf01,swp1
Hostname, Interface
'*','*'
leaf*,'*'
leaf01,swp1
Scope 3
leaf01,swp3
Hostname, Interface
'*','*'
leaf*,'*'
leaf01,swp1
Scope 2
spine01,swp1
Hostname, Interface
'*','*'
leaf*,'*'
leaf01,swp1
Scope 1
Modify your TCA rules to remove the conflict.
Monitor System and TCA Events
NetQ offers multiple ways to view your event status. The NetQ UI provides a graphical and tabular view and the NetQ CLI provides a tabular view of system and threshold-based (TCA) events. System events include events associated with network protocols and services operation, hardware and software status, and system services. TCA events include events associated with digital optics, ACL and forwarding resources, interface statistics, resource utilization, and sensors. You can view all events across the entire network or all events on a device. For each of these, you can filter your view of events based on event type, severity, and timeframe.
Refer to the NetQ UI Card Reference for details of the cards used with the following procedures.
Monitor All System and TCA Events Networkwide
You can monitor all system and TCA events across the network with the NetQ UI and the NetQ CLI.
Click (main menu).
Click Events under the Network column.
You can filter the list by any column data (click ) and export a page of events at a time (click ).
All system and TCA events across the network
To view all system and all TCA events, run:
netq show events [between <text-time> and <text-endtime>] [json]
This example shows all system and TCA events between now and an hour ago.
netq show events
cumulus@switch:~$ netq show events
Matching events records:
Hostname Message Type Severity Message Timestamp
----------------- ------------------------ ---------------- ----------------------------------- -------------------------
leaf01 btrfsinfo critical data storage efficiency : space lef Wed Sep 2 20:04:30 2020
t after allocation greater than chu
nk size 0.57 GB
leaf02 btrfsinfo critical data storage efficiency : space lef Wed Sep 2 19:55:26 2020
t after allocation greater than chu
nk size 0.57 GB
leaf01 btrfsinfo critical data storage efficiency : space lef Wed Sep 2 19:34:29 2020
t after allocation greater than chu
nk size 0.57 GB
leaf02 btrfsinfo critical data storage efficiency : space lef Wed Sep 2 19:25:24 2020
t after allocation greater than chu
nk size 0.57 GB
This example shows all events between now and 24 hours ago.
netq show events between now and 24hr
cumulus@switch:~$ netq show events between now and 24hr
Matching events records:
Hostname Message Type Severity Message Timestamp
----------------- ------------------------ ---------------- ----------------------------------- -------------------------
leaf01 btrfsinfo critical data storage efficiency : space lef Wed Sep 2 20:04:30 2020
t after allocation greater than chu
nk size 0.57 GB
leaf02 btrfsinfo critical data storage efficiency : space lef Wed Sep 2 19:55:26 2020
t after allocation greater than chu
nk size 0.57 GB
leaf01 btrfsinfo critical data storage efficiency : space lef Wed Sep 2 19:34:29 2020
t after allocation greater than chu
nk size 0.57 GB
leaf02 btrfsinfo critical data storage efficiency : space lef Wed Sep 2 19:25:24 2020
t after allocation greater than chu
nk size 0.57 GB
leaf01 btrfsinfo critical data storage efficiency : space lef Wed Sep 2 19:04:22 2020
t after allocation greater than chu
nk size 0.57 GB
leaf02 btrfsinfo critical data storage efficiency : space lef Wed Sep 2 18:55:17 2020
t after allocation greater than chu
nk size 0.57 GB
leaf01 btrfsinfo critical data storage efficiency : space lef Wed Sep 2 18:34:21 2020
t after allocation greater than chu
nk size 0.57 GB
leaf02 btrfsinfo critical data storage efficiency : space lef Wed Sep 2 18:25:16 2020
t after allocation greater than chu
nk size 0.57 GB
leaf01 btrfsinfo critical data storage efficiency : space lef Wed Sep 2 18:04:19 2020
t after allocation greater than chu
nk size 0.57 GB
leaf02 btrfsinfo critical data storage efficiency : space lef Wed Sep 2 17:55:15 2020
t after allocation greater than chu
nk size 0.57 GB
leaf01 btrfsinfo critical data storage efficiency : space lef Wed Sep 2 17:34:18 2020
t after allocation greater than chu
nk size 0.57 GB
...
Monitor All System and TCA Events on a Device
You can monitor all system and TCA events on a given device with the NetQ UI and the NetQ CLI.
Click (main menu).
Click Events under the Network column.
Click .
Enter a hostname or IP address in the Hostname field.
You can enter additional filters for message type, severity, and time range to further narrow the output.
Click Apply.
All system and TCA events on spine01 switch
To view all system and TCA events on a switch, run:
netq <hostname> show events [between <text-time> and <text-endtime>] [json]
This example shows all system and TCA events that have occurred on the leaf01 switch between now and an hour ago.
cumulus@switch:~$ netq leaf01 show events
Matching events records:
Hostname Message Type Severity Message Timestamp
----------------- ------------------------ ---------------- ----------------------------------- -------------------------
leaf01 btrfsinfo critical data storage efficiency : space lef Wed Sep 2 20:34:31 2020
t after allocation greater than chu
nk size 0.57 GB
leaf01 btrfsinfo critical data storage efficiency : space lef Wed Sep 2 20:04:30 2020
t after allocation greater than chu
nk size 0.57 GB
This example shows that no events have occurred on the spine01 switch in the last hour.
cumulus@switch:~$ netq spine01 show events
No matching event records found
Monitor System and TCA Events Networkwide by Type
You can view all system and TCA events of a given type on a networkwide basis using the NetQ UI and the NetQ CLI.
Click (main menu).
Click Events under the Network column.
Click .
Enter the name of network protocol or service (agent, bgp, link, tca_dom, and so on) in the Message Type field.
You can enter additional filters for severity and time range to further narrow the output.
Click Apply.
All LLDP events
To view all system events for a given network protocol or service, run:
netq show events (type agents|bgp|btrfsinfo|clag|clsupport|configdiff|evpn|interfaces|interfaces-physical|lcm|lldp|macs|mtu|ntp|os|ospf|roceconfig|sensors|services|tca_roce|trace|vlan|vxlan) [between <text-time> and <text-endtime>] [json]
This example shows all services events between now and 30 days ago.
cumulus@switch:~$ netq show events type services between now and 30d
Matching events records:
Hostname Message Type Severity Message Timestamp
----------------- ------------------------ ---------------- ----------------------------------- -------------------------
spine03 services critical Service netqd status changed from a Mon Aug 10 19:55:52 2020
ctive to inactive
spine04 services critical Service netqd status changed from a Mon Aug 10 19:55:51 2020
ctive to inactive
spine02 services critical Service netqd status changed from a Mon Aug 10 19:55:50 2020
ctive to inactive
spine03 services info Service netqd status changed from i Mon Aug 10 19:55:38 2020
nactive to active
spine04 services info Service netqd status changed from i Mon Aug 10 19:55:37 2020
nactive to active
spine02 services info Service netqd status changed from i Mon Aug 10 19:55:35 2020
You can enter a severity using the level option to further narrow the output.
Monitor System and TCA Events on a Device by Type
You can view all system and TCA events of a given type on a given device using the NetQ UI and the NetQ CLI.
Click (main menu).
Click Events under the Network column.
Click .
Enter the hostname of the device for which you want to see events in the Hostname field.
Enter the name of a network protocol or service in the Message Type field.
You can enter additional filters for severity and time range to further narrow the output.
Click Apply.
All agent events on the spine01 switch
To view all system events for a given network protocol or service, run:
netq <hostname> show events (type agents|bgp|btrfsinfo|clag|clsupport|configdiff|evpn|interfaces|interfaces-physical|lcm|lldp|macs|mtu|ntp|os|ospf|roceconfig|sensors|services|tca_roce|trace|vlan|vxlan) [between <text-time> and <text-endtime>] [json]
This example shows all services events on the spine03 switch between now and 30 days ago.
cumulus@switch:~$ netq spine03 show events type services between now and 30d
Matching events records:
Hostname Message Type Severity Message Timestamp
----------------- ------------------------ ---------------- ----------------------------------- -------------------------
spine03 services critical Service netqd status changed from a Mon Aug 10 19:55:52 2020
ctive to inactive
spine03 services info Service netqd status changed from i Mon Aug 10 19:55:38 2020
nactive to active
You can enter a severity using the level option to further narrow the output.
Monitor System and TCA Events Networkwide by Severity
You can view system and TCA events by their severity on a networkwide basis with the NetQ UI and the NetQ CLI using the:
Events list: with events of all severities at on time or filter by severity
Events|Alarms card: view events with critical severity
Events|Info card: view events with info, error, and warning severities
netq show events level command
System event severities include info, error, warning, critical or debug. TCA event severities include info or critical.
Click (main menu).
Click Events under the Network column.
Click .
Enter a severity in the Severity field. Default is Info.
You can enter additional filters for message type and time range to further narrow the output.
Click Apply.
All system and TCA events with info severity
View Alarm Status Summary
A summary of the critical alarms in the network includes the number of alarms, a trend indicator, a performance indicator, and a distribution of those alarms.
To view the summary, open the small Alarms card.
In this example, there are a small number of alarms (2), the number of alarms is decreasing (down arrow), and there are fewer alarms right now than the average number of alarms during this time period. This would indicate no further investigation is needed. Note that with such a small number of alarms, the rating might be a bit skewed.
View the Distribution of Alarms
It is helpful to know where and when alarms are occurring in your network. The Alarms card workflow enables you to see the distribution of alarms based on its source: network services, interfaces, system services, and threshold-based events.
To view the alarm distribution, open the medium Alarms card. Scroll down to view all of the charts.
Monitor Alarm Details
The Alarms card workflow enables users to easily view and track critical severity alarms occurring anywhere in your network. You can sort alarms based on their occurrence or view devices with the most network services alarms.
To view critical alarms, open the large Alarms card.
From this card, you can view the distribution of alarms for each of the categories over time. The charts are sorted by total alarm count, with the highest number of alarms in a category listed at the top. Scroll down to view any hidden charts. A list of the associated alarms is also displayed. By default, the list of the most recent alarms is displayed when viewing the large card.
View Devices with the Most Alarms
You can filter instead for the devices that have the most alarms.
To view devices with the most alarms, open the large Alarms card, and then select Devices by event count from the dropdown.
You can open the switch card for any of the listed devices by clicking on the device name.
Filter Alarms by Category
You can focus your view to include alarms for one or more selected alarm categories.
To filter for selected categories:
Click the checkbox to the left of one or more charts to remove that set of alarms from the table on the right.
Select the Devices by event count to view the devices with the most alarms for the selected categories.
Switch back to most recent events by selecting Events by most recent.
Click the checkbox again to return a category’s data to the table.
In this example, we removed the Services from the event listing.
Compare Alarms with a Prior Time
You can change the time period for the data to compare with a prior time. If the same devices are consistently indicating the most alarms, you might want to look more carefully at those devices using the Switches card workflow.
To compare two time periods:
Open a second Alarm Events card. Remember it goes to the bottom of the workbench.
Switch to the large size card.
Move the card to be next to the original Alarm Events card. Note that moving large cards can take a few extra seconds since they contain a large amount of data.
Hover over the card and click .
Select a different time period.
Compare the two cards with the Devices by event count filter applied.
In this example, the total alarm count and the devices with the most alarms in each time period have changed for the better overall. You could go back further in time or investigate the current status of the largest offenders.
View All Alarm Events
You can view all events in the network either by clicking the Show All Events link under the table on the large Alarm Events card, or by opening the full screen Alarm Events card.
OR
To return to your workbench, click in the top right corner of the card.
View Info Status Summary
A summary of the informational events occurring in the network can be found on the small, medium, and large Info cards. Additional details are available as you increase the size of the card.
To view the summary with the small Info card, simply open the card. This card gives you a high-level view in a condensed visual, including the number and distribution of the info events along with the alarms that have occurred during the same time period.
To view the summary with the medium Info card, simply open the card. This card gives you the same count and distribution of info and alarm events, but it also provides information about the sources of the info events and enables you to view a small slice of time using the distribution charts.
Use the chart at the top of the card to view the various sources of info events. The four or so types with the most info events are called out separately, with all others collected together into an Other category. Hover over segment of chart to view the count for each type.
To view the summary with the large Info card, open the card. The left side of the card provides the same capabilities as the medium Info card.
Compare Timing of Info and Alarm Events
While you can see the relative relationship between info and alarm events on the small Info card, the medium and large cards provide considerably more information. Open either of these to view individual line charts for the events. Generally, alarms have some corollary info events. For example, when a network service becomes unavailable, a critical alarm is often issued, and when the service becomes available again, an info event of severity warning is generated. For this reason, you might see some level of tracking between the info and alarm counts and distributions. Some other possible scenarios:
When a critical alarm is resolved, you might see a temporary increase in info events as a result.
When you get a burst of info events, you might see a follow-on increase in critical alarms, as the info events might have been warning you of something beginning to go wrong.
You set logging to debug, and a large number of info events of severity debug are seen. You would not expect to see an increase in critical alarms.
View All Info Events Sorted by Time of Occurrence
You can view all info events using the large Info card. Open the large card and confirm the Events By Most Recent option is selected in the filter above the table on the right. When this option is selected, all of the info events are listed with the most recently occurring event at the top. Scrolling down shows you the info events that have occurred at an earlier time within the selected time period for the card.
View Devices with the Most Info Events
You can filter instead for the devices that have the most info events by selecting the Devices by Event Count option from the filter above the table.
You can open the switch card for any of the listed devices by clicking on the device name.
View All Info Events
You can view all events in the network either by clicking the Show All Events link under the table on the large Info Events card, or by opening the full screen Info Events card.
OR
System events
System and TCA events
To return to your workbench, click in the top right corner of the card.
To view all system events of a given severity, run:
netq show events (level info | level error | level warning | level critical | level debug) [between <text-time> and <text-endtime>] [json]
This example shows all events with critical severity between now and 24 hours ago.
cumulus@switch:~$ netq show events level critical
Matching events records:
Hostname Message Type Severity Message Timestamp
----------------- ------------------------ ---------------- ----------------------------------- -------------------------
Matching events records:
Hostname Message Type Severity Message Timestamp
----------------- ------------------------ ---------------- ----------------------------------- -------------------------
leaf02 btrfsinfo critical data storage efficiency : space lef Tue Sep 8 21:32:32 2020
t after allocation greater than chu
nk size 0.57 GB
leaf01 btrfsinfo critical data storage efficiency : space lef Tue Sep 8 21:13:28 2020
t after allocation greater than chu
nk size 0.57 GB
leaf02 btrfsinfo critical data storage efficiency : space lef Tue Sep 8 21:02:31 2020
t after allocation greater than chu
nk size 0.57 GB
leaf01 btrfsinfo critical data storage efficiency : space lef Tue Sep 8 20:43:27 2020
t after allocation greater than chu
nk size 0.57 GB
You can use the type and between options to further narrow the output.
Monitor System and TCA Events on a Device by Severity
You can view system and TCA events by their severity on a given device with the NetQ UI and the NetQ CLI using the:
Events list: view events of all severities at on time or by one severity filtered by device
Events|Alarms card: view events with critical severity filtered by device
Events|Info card: view events with info, error, and warning severities filtered by device
Switch card: view all events with critical severity on the given device
netq <hostname> show events level command
System event severities include info, error, warning, critical or debug severity. TCA event severities include info or critical.
Click (main menu).
Click Events under the Network column.
Click .
Enter the hostname for the device of interest in the Hostname field.
Enter a severity in the Severity field. Default is Info.
You can enter additional filters for message type and time range to further narrow the output.
Click Apply.
All critical severity events on the spine01 switch
The Events|Alarms card shows critical severity events. You can view the devices that have the most alarms or you can view all alarms on a device.
To view devices with the most alarms:
Locate or open the Events|Alarms card on your workbench.
Change to the large size card using the size picker.
Select Devices by event count from the dropdown above the table.
You can open the switch card for any of the listed devices by clicking on the device name.
To view all alarms on a given device:
Click the Show All Events link under the table on the large Events|Alarms card, or open the full screen Events|Alarms card.
OR
Click and enter a hostname for the device of interest.
Click Apply.
To return to your workbench, click in the top right corner of the card.
The Events|Info card shows all non-critical severity events. You can view the devices that have the most info events or you can view all non-critical events on a device.
To view devices with the most non-critical events:
Locate or open the Events|Info card on your workbench.
Change to the large size card using the size picker.
Select Devices by event count from the dropdown above the table.
You can open the switch card for any of the listed devices by clicking on the device name.
To view all info events on a given device:
Click the Show All Events link under the table on the large Events|Info card, or open the full screen Events|Info card.
OR
Click and enter a hostname for the device of interest.
Click Apply.
To return to your workbench, click in the top right corner of the card.
The Switch card displays the alarms (events of critical severity) for the switch.
Open the Switch card for the switch of interest.
Click .
Click Open a switch card.
Enter the switch hostname.
Click Add.
Change to the full screen card using the size picker.
Enter a severity in the Severity field. Default is Info.
You can enter additional filters for message type and time range to further narrow the output.
Click Apply.
To return to your workbench, click in the top right corner of the card.
To view all system events for a given severity on a device, run:
netq <hostname> show events (level info | level error | level warning | level critical | level debug) [between <text-time> and <text-endtime>] [json]
This example shows all critical severity events on the leaf01 switch between now and 24 hours ago.
cumulus@switch:~$ netq leaf01 show events level critical
Matching events records:
Hostname Message Type Severity Message Timestamp
----------------- ------------------------ ---------------- ----------------------------------- -------------------------
leaf01 btrfsinfo critical data storage efficiency : space lef Wed Sep 9 18:44:49 2020
t after allocation greater than chu
nk size 0.57 GB
leaf01 btrfsinfo critical data storage efficiency : space lef Wed Sep 9 18:14:48 2020
t after allocation greater than chu
nk size 0.57 GB
You can use the type or between options to further narrow the output.
Monitor System and TCA Events Networkwide by Time
You can monitor all system and TCA events across the network currently or for a time in the past with the NetQ UI and the NetQ CLI.
Events list: view events for a time range in the past 24 hours
Events|Alarms card: view critical events for 6 hours, 12 hours, 24 hours, a week, a month, or a quarter in the past
Events|Info card: view non-critical events for 6 hours, 12 hours, 24 hours, a week, a month, or a quarter in the past
netq show events between command: view events for a time range in the past
Click (main menu).
Click Events under the Network column.
Click .
Click in the Timestamp fields to enter a start and end date for a time range in the past 24 hours.
This allows you to view only the most recent events or events within a particular hour or few hours over the last day.
Click Apply.
All system and TCA events across the network between midnight and 11:30am
All cards have a default time period for the data shown on the card, typically the last 24 hours. You can change the time period to view the data during a different time range to aid analysis of previous or existing issues. You can also compare the current events with a prior time. If the same devices are consistently indicating the most alarms, you might want to look more carefully at those devices using the Switches card workflow.
To view critical events for a time in the past using the small, medium, or large Events|Alarms card:
Locate or open the Events|Alarms card on your workbench.
Hover over the card, and click in the header.
Select a time period from the dropdown list.
Small, medium, and large card
To view critical events for a time in the past using the full-screen Events|Alarms card:
Locate or open the Events|Alarms card on your workbench.
Hover over the card, and change to the full-screen card.
Select a time period from the dropdown list.
Full-screen card
Changing the time period in this manner only changes the time period for this card. No other cards are impacted.
To compare the event data for two time periods:
Open a second Events|Alarms card. Remember the card is placed at the bottom of the workbench.
Change to the medium or large size card.
Move the card to be next to the original Alarm Events card. Note that moving large cards can take a few extra seconds since they contain a large amount of data.
Hover over the card and click .
Select a different time period.
Compare the two cards with the Devices by event count filter applied.
In this example, the total alarm count and the devices with the most alarms in each time period have changed for the better overall. You could go back further in time or investigate the current status of the largest offenders.
All cards have a default time period for the data shown on the card, typically the last 24 hours. You can change the time period to view the data during a different time range to aid analysis of previous or existing issues. You can also compare the current events with a prior time. If the same devices are consistently indicating the most alarms, you might want to look more carefully at those devices using the Switches card workflow.
To view informational events for a time in the past using the small, medium, or large Events|Info card:
Locate or open the Events|Info card on your workbench.
Hover over the card, and click in the header.
Select a time period from the dropdown list.
To view informational events for a time in the past using the full-screen Events|Info card:
Locate or open the Events|Info card on your workbench.
Hover over the card, and change to the full-screen card.
Select a time period from the dropdown list.
Full-screen card
Changing the time period in this manner only changes the time period for this card. No other cards are impacted.
To compare the event data for two time periods:
Open a second Events|Alarms card. Remember the card is placed at the bottom of the workbench.
Change to the medium or large size card.
Move the card to be next to the original Alarm Events card. Note that moving large cards can take a few extra seconds since they contain a large amount of data.
Hover over the card and click .
Select a different time period.
Compare the two cards.
In this example, the total info event count has reduced dramatically. Optionally change to the large size of each card to compare which devices have been experiencing the most events, using the Devices by event count filter.
The NetQ CLI uses a default of one hour unless otherwise specified. To view all system and all TCA events for a time beyond an hour in the past, run:
netq show events [between <text-time> and <text-endtime>] [json]
This example shows all system and TCA events between now and 24 hours ago.
netq show events between now and 24hr
cumulus@switch:~$ netq show events between now and 24hr
Matching events records:
Hostname Message Type Severity Message Timestamp
----------------- ------------------------ ---------------- ----------------------------------- -------------------------
leaf01 btrfsinfo critical data storage efficiency : space lef Wed Sep 2 20:04:30 2020
t after allocation greater than chu
nk size 0.57 GB
leaf02 btrfsinfo critical data storage efficiency : space lef Wed Sep 2 19:55:26 2020
t after allocation greater than chu
nk size 0.57 GB
leaf01 btrfsinfo critical data storage efficiency : space lef Wed Sep 2 19:34:29 2020
t after allocation greater than chu
nk size 0.57 GB
leaf02 btrfsinfo critical data storage efficiency : space lef Wed Sep 2 19:25:24 2020
t after allocation greater than chu
nk size 0.57 GB
leaf01 btrfsinfo critical data storage efficiency : space lef Wed Sep 2 19:04:22 2020
t after allocation greater than chu
nk size 0.57 GB
leaf02 btrfsinfo critical data storage efficiency : space lef Wed Sep 2 18:55:17 2020
t after allocation greater than chu
nk size 0.57 GB
leaf01 btrfsinfo critical data storage efficiency : space lef Wed Sep 2 18:34:21 2020
t after allocation greater than chu
nk size 0.57 GB
leaf02 btrfsinfo critical data storage efficiency : space lef Wed Sep 2 18:25:16 2020
t after allocation greater than chu
nk size 0.57 GB
leaf01 btrfsinfo critical data storage efficiency : space lef Wed Sep 2 18:04:19 2020
t after allocation greater than chu
nk size 0.57 GB
leaf02 btrfsinfo critical data storage efficiency : space lef Wed Sep 2 17:55:15 2020
t after allocation greater than chu
nk size 0.57 GB
leaf01 btrfsinfo critical data storage efficiency : space lef Wed Sep 2 17:34:18 2020
t after allocation greater than chu
nk size 0.57 GB
...
This example shows all system and TCA events between one and three days ago.
cumulus@switch:~$ netq show events between 1d and 3d
Matching events records:
Hostname Message Type Severity Message Timestamp
----------------- ------------------------ ---------------- ----------------------------------- -------------------------
leaf01 btrfsinfo critical data storage efficiency : space lef Wed Sep 9 16:14:37 2020
t after allocation greater than chu
nk size 0.57 GB
leaf02 btrfsinfo critical data storage efficiency : space lef Wed Sep 9 16:03:31 2020
t after allocation greater than chu
nk size 0.57 GB
leaf01 btrfsinfo critical data storage efficiency : space lef Wed Sep 9 15:44:36 2020
t after allocation greater than chu
nk size 0.57 GB
leaf02 btrfsinfo critical data storage efficiency : space lef Wed Sep 9 15:33:30 2020
t after allocation greater than chu
nk size 0.57 GB
leaf01 btrfsinfo critical data storage efficiency : space lef Wed Sep 9 15:14:35 2020
t after allocation greater than chu
nk size 0.57 GB
leaf02 btrfsinfo critical data storage efficiency : space lef Wed Sep 9 15:03:28 2020
t after allocation greater than chu
nk size 0.57 GB
leaf01 btrfsinfo critical data storage efficiency : space lef Wed Sep 9 14:44:34 2020
t after allocation greater than chu
nk size 0.57 GB
leaf02 btrfsinfo critical data storage efficiency : space lef Wed Sep 9 14:33:21 2020
t after allocation greater than chu
nk size 0.57 GB
...
Monitor System and TCA Events on a Device by Time
You can monitor all system and TCA events on a device currently or for a time in the past with the NetQ UI and the NetQ CLI.
Events list: view events for a device at a time range in the past 24 hours
Events|Alarms card: view critical events for 6 hours, 12 hours, 24 hours, a week, a month, or a quarter in the past
Events|Info card: view non-critical events for 6 hours, 12 hours, 24 hours, a week, a month, or a quarter in the past
Switch card: view critical events on a switch for a time range in the past
netq <hostname> show events between command: view events for a time range in the past
Click (main menu).
Click Events under the Network column.
Click .
Enter a hostname into the Hostname field.
Click in the Timestamp fields to enter a start and end date for a time range in the past 24 hours.
This allows you to view only the most recent events or events within a particular hour or few hours over the last day.
Click Apply.
All system and TCA events on the leaf02 switch between midnight and 11:30am
Return to your workbench. Click in the top right corner of the card.
All cards have a default time period for the data shown on the card, typically the last 24 hours. You can change the time period to view the data during a different time range to aid analysis of previous or existing issues.
To view critical events for a device at a time in the past:
Locate or open the Events|Alarms card on your workbench.
Hover over the card, and change to the full-screen card.
Select a time period from the dropdown list.
Full-screen card
Changing the time period in this manner only changes the time period for this card. No other cards are impacted.
Click .
Enter a hostname into the Hostname field, and click Apply.
All system and TCA events on the leaf02 switch in the past week
Return to your workbench. Click in the top right corner of the card.
All cards have a default time period for the data shown on the card, typically the last 24 hours. You can change the time period to view the data during a different time range to aid analysis of previous or existing issues.
To view informational events for a time in the past:
Locate or open the Events|Info card on your workbench.
Hover over the card, and change to the full-screen card.
Select a time period from the dropdown list.
Full-screen card
Changing the time period in this manner only changes the time period for this card. No other cards are impacted.
Click .
Enter a hostname into the Hostname field, and click Apply.
All system and TCA events on the spine02 switch in the past quarter
Return to your workbench. Click in the top right corner of the card.
The Switch card displays the alarms (events of critical severity) for the switch.
Open the Switch card for the switch of interest.
Click .
Click Open a switch card.
Enter the switch hostname.
Click Add.
Change to the full screen card using the size picker.
Enter start and end dates in the Timestamp fields.
Click Apply.
All system and TCA events on the leaf02 switch between September 7 at midnight and September 10 and 3:15 pm
Return to your workbench. Click in the top right corner of the card.
The NetQ CLI uses a displays data collected within the last hour unless otherwise specified. To view all system and all TCA events on a given device for a time beyond an hour in the past, run:
netq <hostname> show events [between <text-time> and <text-endtime>] [json]
This example shows all system and TCA events on the leaf02 switch between now and 24 hours ago.
netq leaf02 show events between now and 24hr
cumulus@switch:~$ netq show events between now and 24hr
Matching events records:
Hostname Message Type Severity Message Timestamp
----------------- ------------------------ ---------------- ----------------------------------- -------------------------
leaf02 btrfsinfo critical data storage efficiency : space lef Wed Sep 2 19:55:26 2020
t after allocation greater than chu
nk size 0.57 GB
leaf02 btrfsinfo critical data storage efficiency : space lef Wed Sep 2 19:25:24 2020
t after allocation greater than chu
nk size 0.57 GB
leaf02 btrfsinfo critical data storage efficiency : space lef Wed Sep 2 18:55:17 2020
t after allocation greater than chu
nk size 0.57 GB
leaf02 btrfsinfo critical data storage efficiency : space lef Wed Sep 2 18:25:16 2020
t after allocation greater than chu
nk size 0.57 GB
leaf02 btrfsinfo critical data storage efficiency : space lef Wed Sep 2 17:55:15 2020
t after allocation greater than chu
nk size 0.57 GB
...
This example shows all system and TCA events on the leaf01 switch between one and three days ago.
cumulus@switch:~$ netq leaf01 show events between 1d and 3d
Matching events records:
Hostname Message Type Severity Message Timestamp
----------------- ------------------------ ---------------- ----------------------------------- -------------------------
leaf01 btrfsinfo critical data storage efficiency : space lef Wed Sep 9 16:14:37 2020
t after allocation greater than chu
nk size 0.57 GB
leaf01 btrfsinfo critical data storage efficiency : space lef Wed Sep 9 15:44:36 2020
t after allocation greater than chu
nk size 0.57 GB
leaf01 btrfsinfo critical data storage efficiency : space lef Wed Sep 9 15:14:35 2020
t after allocation greater than chu
nk size 0.57 GB
leaf01 btrfsinfo critical data storage efficiency : space lef Wed Sep 9 14:44:34 2020
t after allocation greater than chu
nk size 0.57 GB
...
Configure and Monitor What Just Happened
The What Just Happened (WJH) feature, available on NVIDIA switches, streams detailed and contextual telemetry data for analysis. This provides real-time visibility into problems in the network, such as hardware packet drops due to buffer congestion, incorrect routing, and ACL or layer 1 problems. You must have Cumulus Linux 4.0.0 or later, SONiC 202012 or later, and NetQ 2.4.0 or later to take advantage of this feature.
WJH is only supported on NVIDIA Spectrum switches.
When you combine WJH capabilities with NetQ, you have the ability to home in on losses, anywhere in the fabric, from a single management console. You can:
View any current or historic drop information, including the reason for the drop
Identify problematic flows or endpoints, and pin-point exactly where communication is failing in the network
By default, Cumulus Linux 4.0.0 and later provides the NetQ Agent and CLI. Depending on the version of Cumulus Linux running on your NVIDIA switch, you might need to upgrade the NetQ Agent and optionally the CLI to the latest release.
WJH is enabled by default on NVIDIA switches and Cumulus Linux 4.0.0 requires no configuration; however, you must enable the NetQ Agent to collect the data.
To enable WJH in NetQ on any switch or server:
Configure the NetQ Agent on the NVIDIA switch.
cumulus@switch:~$ sudo netq config add agent wjh
Restart the NetQ Agent to start collecting the WJH data.
cumulus@switch:~$ sudo netq config restart agent
When you finish viewing the WJH metrics, you might want to stop the NetQ Agent from collecting WJH data to reduce network traffic. Use netq config del agent wjh followed by netq config restart agent to disable the WJH feature on the given switch.
Using wjh_dump.py on an NVIDIA platform that is running Cumulus Linux and the NetQ agent causes the NetQ WJH client to stop receiving packet drop call backs. To prevent this issue, run wjh_dump.py on a different system than the one where the NetQ Agent has WJH enabled, or disable wjh_dump.py and restart the NetQ Agent (run netq config restart agent).
Configure Latency and Congestion Thresholds
WJH latency and congestion threshold configuration is supported on NVIDIA Spectrum 2 switches and above.
WJH latency and congestion metrics depend on threshold settings to trigger the events. WJH measures packet latency as the time spent inside a single system (switch). When specified, WJH triggers events when measured values cross high thresholds and events are suppressed when values are below low thresholds.
This example creates congestion thresholds for Class 4 traffic on port swp1 where the upper threshold is 200 cells and the lower threshold is 10 cells, where a cell is a unit of 144 bytes:
You can filter the WJH events at the NetQ Agent before the NetQ system processes it. You perform filtering on a drop-type basis. You can filter the drop type further by specifying one or more drop reasons or severity. Filter events by creating a NetQ Configuration profile in the NetQ UI or using the netq config add agent wjh-drop-filter command in the NetQ CLI.
On the NetQ Configurations card, click Add Config.
Click Enable to enable WJH, then click Customize.
By default, WJH includes all drop reasons and severities. Uncheck any drop reasons or severity you do not want to use to generate WJH events, then click Done.
Click Add to save the configuration profile, or click Close to discard it.
To configure the NetQ Agent to filter WJH drops, run:
You can view the WJH metrics from the NetQ UI or the NetQ CLI.
View the What Just Happened card on your workbench:
The WJH card can be expanded to see a larger summary of WJH data:
Expanding the card to it’s fullest setting will open the advanced WJH dashboard. You can also access this dashboard by clicking (main menu) and selecting What Just Happened under the Network column:
Hovering over the color-coded chart allows one to view and expand individual WJH event categories:
Clicking on a category in the chart will expand the details for that category in the dashboard:
Use the various options to restrict the output accordingly.
This example uses the first form of the command to show drops on switch leaf03 for the past week.
cumulus@switch:~$ netq leaf03 show wjh-drop between now and 7d
Matching wjh records:
Drop type Aggregate Count
------------------ ------------------------------
L1 560
Buffer 224
Router 144
L2 0
ACL 0
Tunnel 0
This example uses the second form of the command to show drops on switch leaf03 for the past week including the drop reasons.
cumulus@switch:~$ netq leaf03 show wjh-drop details between now and 7d
Matching wjh records:
Drop type Aggregate Count Reason
------------------ ------------------------------ ---------------------------------------------
L1 556 None
Buffer 196 WRED
Router 144 Blackhole route
Buffer 14 Packet Latency Threshold Crossed
Buffer 14 Port TC Congestion Threshold
L1 4 Oper down
This example shows the drops seen at layer 2 across the network.
cumulus@mlx-2700-03:mgmt:~$ netq show wjh-drop l2
Matching wjh records:
Hostname Ingress Port Reason Agg Count Src Ip Dst Ip Proto Src Port Dst Port Src Mac Dst Mac First Timestamp Last Timestamp
----------------- ------------------------ --------------------------------------------- ------------------ ---------------- ---------------- ------ ---------------- ---------------- ------------------ ------------------ ------------------------------ ----------------------------
mlx-2700-03 swp1s2 Port loopback filter 10 27.0.0.19 27.0.0.22 0 0 0 00:02:00:00:00:73 0c:ff:ff:ff:ff:ff Mon Dec 16 11:54:15 2019 Mon Dec 16 11:54:15 2019
mlx-2700-03 swp1s2 Source MAC equals destination MAC 10 27.0.0.19 27.0.0.22 0 0 0 00:02:00:00:00:73 00:02:00:00:00:73 Mon Dec 16 11:53:17 2019 Mon Dec 16 11:53:17 2019
mlx-2700-03 swp1s2 Source MAC equals destination MAC 10 0.0.0.0 0.0.0.0 0 0 0 00:02:00:00:00:73 00:02:00:00:00:73 Mon Dec 16 11:40:44 2019 Mon Dec 16 11:40:44 2019
The following two examples include the severity of a drop event (error, warning or notice) for ACLs and routers.
cumulus@switch:~$ netq show wjh-drop acl
Matching wjh records:
Hostname Ingress Port Reason Severity Agg Count Src Ip Dst Ip Proto Src Port Dst Port Src Mac Dst Mac Acl Rule Id Acl Bind Point Acl Name Acl Rule First Timestamp Last Timestamp
----------------- ------------------------ --------------------------------------------- ---------------- ------------------ ---------------- ---------------- ------ ---------------- ---------------- ------------------ ------------------ ---------------------- ---------------------------- ---------------- ---------------- ------------------------------ ----------------------------
leaf01 swp2 Ingress router ACL Error 49 55.0.0.1 55.0.0.2 17 8492 21423 00:32:10:45:76:89 00:ab:05:d4:1b:13 0x0 0 Tue Oct 6 15:29:13 2020 Tue Oct 6 15:29:39 2020
cumulus@switch:~$ netq show wjh-drop router
Matching wjh records:
Hostname Ingress Port Reason Severity Agg Count Src Ip Dst Ip Proto Src Port Dst Port Src Mac Dst Mac First Timestamp Last Timestamp
----------------- ------------------------ --------------------------------------------- ---------------- ------------------ ---------------- ---------------- ------ ---------------- ---------------- ------------------ ------------------ ------------------------------ ----------------------------
leaf01 swp1 Blackhole route Notice 36 46.0.1.2 47.0.2.3 6 1235 43523 00:01:02:03:04:05 00:06:07:08:09:0a Tue Oct 6 15:29:13 2020 Tue Oct 6 15:29:47 2020
gNMI Streaming
You can use gRPC Network Management Interface (gNMI) to collect system resource, interface, and counter information from Cumulus Linux and export it to your own gNMI client.
Configure the gNMI Agent
The gNMI agent is disabled by default. To enable it, run:
The gNMI agent listens over port 9339. You can change the default port in case you use that port in another application. The /etc/netq/netq.yml file stores the configuration.
Use the following commands to adjust the settings:
Restart the NetQ agent to incorporate the configuration changes:
cumulus@switch:~$ netq config restart agent
Use the gNMI Agent Only
NVIDIA recommends collecting data with both the gNMI and NetQ agents. However, if you do not want to collect data with both agents, you can disable the NetQ agent. Data is then sent exclusively to the gNMI agent.
To disable the NetQ agent, use the following command:
You cannot disable both the NetQ and gNMI agents. If both agents are enabled on Cumulus Linux and a NetQ server is unreachable, the data from the following models are not sent to gNMI:
openconfig-interfaces
openconfig-if-ethernet
openconfig-if-ethernet-ext
openconfig-system
nvidia-if-ethernet-ext
WJH, openconfig-platform, and openconfig-lldp data continue streaming to gNMI in this state. If you are only using gNMI and a NetQ telemetry server does not exist, you should disable the NetQ agent by setting opta-enable to false.
Supported Models
Cumulus Linux supports the following OpenConfig models:
The client should use the following YANG models as a reference:
▼
nvidia-if-ethernet-ext
module nvidia-if-ethernet-counters-ext {
// xPath --> /interfaces/interface[name=*]/ethernet/counters/state/
namespace "http://nvidia.com/yang/nvidia-ethernet-counters";
prefix "nvidia-if-ethernet-counters-ext";
// import some basic types
import openconfig-interfaces { prefix oc-if; }
import openconfig-if-ethernet { prefix oc-eth; }
import openconfig-yang-types { prefix oc-yang; }
revision "2021-10-12" {
description
"Initial revision";
reference "1.0.0.";
}
grouping ethernet-counters-ext {
leaf alignment-error {
type oc-yang:counter64;
}
leaf in-acl-drops {
type oc-yang:counter64;
}
leaf in-buffer-drops {
type oc-yang:counter64;
}
leaf in-dot3-frame-errors {
type oc-yang:counter64;
}
leaf in-dot3-length-errors {
type oc-yang:counter64;
}
leaf in-l3-drops {
type oc-yang:counter64;
}
leaf in-pfc0-packets {
type oc-yang:counter64;
}
leaf in-pfc1-packets {
type oc-yang:counter64;
}
leaf in-pfc2-packets {
type oc-yang:counter64;
}
leaf in-pfc3-packets {
type oc-yang:counter64;
}
leaf in-pfc4-packets {
type oc-yang:counter64;
}
leaf in-pfc5-packets {
type oc-yang:counter64;
}
leaf in-pfc6-packets {
type oc-yang:counter64;
}
leaf in-pfc7-packets {
type oc-yang:counter64;
}
leaf out-non-q-drops {
type oc-yang:counter64;
}
leaf out-pfc0-packets {
type oc-yang:counter64;
}
leaf out-pfc1-packets {
type oc-yang:counter64;
}
leaf out-pfc2-packets {
type oc-yang:counter64;
}
leaf out-pfc3-packets {
type oc-yang:counter64;
}
leaf out-pfc4-packets {
type oc-yang:counter64;
}
leaf out-pfc5-packets {
type oc-yang:counter64;
}
leaf out-pfc6-packets {
type oc-yang:counter64;
}
leaf out-pfc7-packets {
type oc-yang:counter64;
}
leaf out-q0-wred-drops {
type oc-yang:counter64;
}
leaf out-q1-wred-drops {
type oc-yang:counter64;
}
leaf out-q2-wred-drops {
type oc-yang:counter64;
}
leaf out-q3-wred-drops {
type oc-yang:counter64;
}
leaf out-q4-wred-drops {
type oc-yang:counter64;
}
leaf out-q5-wred-drops {
type oc-yang:counter64;
}
leaf out-q6-wred-drops {
type oc-yang:counter64;
}
leaf out-q7-wred-drops {
type oc-yang:counter64;
}
leaf out-q8-wred-drops {
type oc-yang:counter64;
}
leaf out-q9-wred-drops {
type oc-yang:counter64;
}
leaf out-q-drops {
type oc-yang:counter64;
}
leaf out-q-length {
type oc-yang:counter64;
}
leaf out-wred-drops {
type oc-yang:counter64;
}
leaf symbol-errors {
type oc-yang:counter64;
}
leaf out-tx-fifo-full {
type oc-yang:counter64;
}
}
augment "/oc-if:interfaces/oc-if:interface/oc-eth:ethernet/" +
"oc-eth:state/oc-eth:counters" {
uses ethernet-counters-ext;
}
}
▼
nvidia-if-wjh-drop-aggregate
module nvidia-wjh {
// Entrypoint /oc-if:interfaces/oc-if:interface
//
// xPath L1 --> interfaces/interface[name=*]/wjh/aggregate/l1
// xPath L2 --> /interfaces/interface[name=*]/wjh/aggregate/l2/reasons/reason[id=*][severity=*]
// xPath Router --> /interfaces/interface[name=*]/wjh/aggregate/router/reasons/reason[id=*][severity=*]
// xPath Tunnel --> /interfaces/interface[name=*]/wjh/aggregate/tunnel/reasons/reason[id=*][severity=*]
// xPath Buffer --> /interfaces/interface[name=*]/wjh/aggregate/buffer/reasons/reason[id=*][severity=*]
// xPath ACL --> /interfaces/interface[name=*]/wjh/aggregate/acl/reasons/reason[id=*][severity=*]
import openconfig-interfaces { prefix oc-if; }
namespace "http://nvidia.com/yang/what-just-happened-config";
prefix "nvidia-wjh";
revision "2021-10-12" {
description
"Initial revision";
reference "1.0.0.";
}
augment "/oc-if:interfaces/oc-if:interface" {
uses interfaces-wjh;
}
grouping interfaces-wjh {
description "Top-level grouping for What-just happened data.";
container wjh {
container aggregate {
container l1 {
container state {
leaf drop {
type string;
description "Drop list based on wjh-drop-types module encoded in JSON";
}
}
}
container l2 {
uses reason-drops;
}
container router {
uses reason-drops;
}
container tunnel {
uses reason-drops;
}
container acl {
uses reason-drops;
}
container buffer {
uses reason-drops;
}
}
}
}
grouping reason-drops {
container reasons {
list reason {
key "id severity";
leaf id {
type leafref {
path "../state/id";
}
description "reason ID";
}
leaf severity {
type leafref {
path "../state/severity";
}
description "Reason severity";
}
container state {
leaf id {
type uint32;
description "Reason ID";
}
leaf name {
type string;
description "Reason name";
}
leaf severity {
type string;
mandatory "true";
description "Reason severity";
}
leaf drop {
type string;
description "Drop list based on wjh-drop-types module encoded in JSON";
}
}
}
}
}
}
module wjh-drop-types {
namespace "http://nvidia.com/yang/what-just-happened-config-types";
prefix "wjh-drop-types";
container l1-aggregated {
uses l1-drops;
}
container l2-aggregated {
uses l2-drops;
}
container router-aggregated {
uses router-drops;
}
container tunnel-aggregated {
uses tunnel-drops;
}
container acl-aggregated {
uses acl-drops;
}
container buffer-aggregated {
uses buffer-drops;
}
grouping reason-key {
leaf id {
type uint32;
mandatory "true";
description "reason ID";
}
leaf severity {
type string;
mandatory "true";
description "Severity";
}
}
grouping reason_info {
leaf reason {
type string;
mandatory "true";
description "Reason name";
}
leaf drop_type {
type string;
mandatory "true";
description "reason drop type";
}
leaf ingress_port {
type string;
mandatory "true";
description "Ingress port name";
}
leaf ingress_lag {
type string;
description "Ingress LAG name";
}
leaf egress_port {
type string;
description "Egress port name";
}
leaf agg_count {
type uint64;
description "Aggregation count";
}
leaf severity {
type string;
description "Severity";
}
leaf first_timestamp {
type uint64;
description "First timestamp";
}
leaf end_timestamp {
type uint64;
description "End timestamp";
}
}
grouping packet_info {
leaf smac {
type string;
description "Source MAC";
}
leaf dmac {
type string;
description "Destination MAC";
}
leaf sip {
type string;
description "Source IP";
}
leaf dip {
type string;
description "Destination IP";
}
leaf proto {
type uint32;
description "Protocol";
}
leaf sport {
type uint32;
description "Source port";
}
leaf dport {
type uint32;
description "Destination port";
}
}
grouping l1-drops {
description "What-just happened drops.";
leaf ingress_port {
type string;
description "Ingress port";
}
leaf is_port_up {
type boolean;
description "Is port up";
}
leaf port_down_reason {
type string;
description "Port down reason";
}
leaf description {
type string;
description "Description";
}
leaf state_change_count {
type uint64;
description "State change count";
}
leaf symbol_error_count {
type uint64;
description "Symbol error count";
}
leaf crc_error_count {
type uint64;
description "CRC error count";
}
leaf first_timestamp {
type uint64;
description "First timestamp";
}
leaf end_timestamp {
type uint64;
description "End timestamp";
}
leaf timestamp {
type uint64;
description "Timestamp";
}
}
grouping l2-drops {
description "What-just happened drops.";
uses reason_info;
uses packet_info;
}
grouping router-drops {
description "What-just happened drops.";
uses reason_info;
uses packet_info;
}
grouping tunnel-drops {
description "What-just happened drops.";
uses reason_info;
uses packet_info;
}
grouping acl-drops {
description "What-just happened drops.";
uses reason_info;
uses packet_info;
leaf acl_rule_id {
type uint64;
description "ACL rule ID";
}
leaf acl_bind_point {
type uint32;
description "ACL bind point";
}
leaf acl_name {
type string;
description "ACL name";
}
leaf acl_rule {
type string;
description "ACL rule";
}
}
grouping buffer-drops {
description "What-just happened drops.";
uses reason_info;
uses packet_info;
leaf traffic_class {
type uint32;
description "Traffic Class";
}
leaf original_occupancy {
type uint32;
description "Original occupancy";
}
leaf original_latency {
type uint64;
description "Original latency";
}
}
}
Collect WJH Data Using gNMI
You can export What Just Happened data from the NetQ agent to your own gNMI client. Refer to the previous section for the nvidia-if-wjh-drop-aggregate reference YANG model.
Supported Features
The gNMI agent supports capability and stream subscribe requests for WJH events.
If you are using SONiC, WJH data can only be collected using gNMI.
WJH Drop Reasons
The data NetQ sends to the gNMI agent is in the form of WJH drop reasons. The reasons are generated by the SDK and are stored in the /usr/etc/wjh_lib_conf.xml file on the switch. Use this file as a guide to filter for specific reason types (L1, ACL, and so forth), reason IDs, or event severities.
L1 Drop Reasons
Reason ID
Reason
Description
10021
Port admin down
Validate port configuration
10022
Auto-negotiation failure
Set port speed manually, disable auto-negotiation
10023
Logical mismatch with peer link
Check cable/transceiver
10024
Link training failure
Check cable/transceiver
10025
Peer is sending remote faults
Replace cable/transceiver
10026
Bad signal integrity
Replace cable/transceiver
10027
Cable/transceiver is not supported
Use supported cable/transceiver
10028
Cable/transceiver is unplugged
Plug cable/transceiver
10029
Calibration failure
Check cable/transceiver
10030
Cable/transceiver bad status
Check cable/transceiver
10031
Other reason
Other L1 drop reason
L2 Drop Reasons
Reason ID
Reason
Severity
Description
201
MLAG port isolation
Notice
Expected behavior
202
Destination MAC is reserved (DMAC=01-80-C2-00-00-0x)
Error
Bad packet was received from the peer
203
VLAN tagging mismatch
Error
Validate the VLAN tag configuration on both ends of the link
204
Ingress VLAN filtering
Error
Validate the VLAN membership configuration on both ends of the link
205
Ingress spanning tree filter
Notice
Expected behavior
206
Unicast MAC table action discard
Error
Validate MAC table for this destination MAC
207
Multicast egress port list is empty
Warning
Validate why IGMP join or multicast router port does not exist
208
Port loopback filter
Error
Validate MAC table for this destination MAC
209
Source MAC is multicast
Error
Bad packet was received from peer
210
Source MAC equals destination MAC
Error
Bad packet was received from peer
Router Drop Reasons
Reason ID
Reason
Severity
Description
301
Non-routable packet
Notice
Expected behavior
302
Blackhole route
Warning
Validate routing table for this destination IP
303
Unresolved neighbor/next hop
Warning
Validate ARP table for the neighbor/next hop
304
Blackhole ARP/neighbor
Warning
Validate ARP table for the next hop
305
IPv6 destination in multicast scope FFx0:/16
Notice
Expected behavior - packet is not routable
306
IPv6 destination in multicast scope FFx1:/16
Notice
Expected behavior - packet is not routable
307
Non-IP packet
Notice
Destination MAC is the router, packet is not routable
308
Unicast destination IP but multicast destination MAC
Error
Bad packet was received from the peer
309
Destination IP is loopback address
Error
Bad packet was received from the peer
310
Source IP is multicast
Error
Bad packet was received from the peer
311
Source IP is in class E
Error
Bad packet was received from the peer
312
Source IP is loopback address
Error
Bad packet was received from the peer
313
Source IP is unspecified
Error
Bad packet was received from the peer
314
Checksum or IPver or IPv4 IHL too short
Error
Bad cable or bad packet was received from the peer
315
Multicast MAC mismatch
Error
Bad packet was received from the peer
316
Source IP equals destination IP
Error
Bad packet was received from the peer
317
IPv4 source IP is limited broadcast
Error
Bad packet was received from the peer
318
IPv4 destination IP is local network (destination=0.0.0.0/8)
Error
Bad packet was received from the peer
320
Ingress router interface is disabled
Warning
Validate your configuration
321
Egress router interface is disabled
Warning
Validate your configuration
323
IPv4 routing table (LPM) unicast miss
Warning
Validate routing table for this destination IP
324
IPv6 routing table (LPM) unicast miss
Warning
Validate routing table for this destination IP
325
Router interface loopback
Warning
Validate the interface configuration
326
Packet size is larger than router interface MTU
Warning
Validate the router interface MTU configuration
327
TTL value is too small
Warning
Actual path is longer than the TTL
Tunnel Drop Reasons
Reason ID
Reason
Severity
Description
402
Overlay switch - Source MAC is multicast
Error
The peer sent a bad packet
403
Overlay switch - Source MAC equals destination MAC
Error
The peer sent a bad packet
404
Decapsulation error
Error
The peer sent a bad packet
ACL Drop Reasons
Reason ID
Reason
Severity
Description
601
Ingress port ACL
Notice
Validate ACL configuration
602
Ingress router ACL
Notice
Validate ACL configuration
603
Egress router ACL
Notice
Validate ACL configuration
604
Egress port ACL
Notice
Validate ACL configuration
Buffer Drop Reasons
Reason ID
Reason
Severity
Description
503
Tail drop
Warning
Monitor network congestion
504
WRED
Warning
Monitor network congestion
505
Port TC congestion threshold crossed
Notice
Monitor network congestion
506
Packet latency threshold crossed
Notice
Monitor network congestion
gNMI Client Requests
You can use your gNMI client on a host server to request capabilities and data that the agent is subscribed to.
The following example shows a gNMI client request for interface speed:
The following table lists all system event messages organized by type. You can view these messages through third-party notification applications. For details about configuring notifications for these events, refer to Configure System Event Notifications.
Agent Events
Type
Trigger
Severity
Message Format
Example
agent
NetQ Agent state changed to Rotten (not heard from in over 15 seconds)
Critical
Agent state changed to rotten
Agent state changed to rotten
agent
NetQ Agent rebooted
Critical
Netq-agent rebooted at (@last_boot)
Netq-agent rebooted at 1573166417
agent
Node running NetQ Agent rebooted
Critical
Switch rebooted at (@sys_uptime)
Switch rebooted at 1573166131
agent
NetQ Agent state changed to Fresh
Info
Agent state changed to fresh
Agent state changed to fresh
agent
NetQ Agent state was reset
Info
Agent state was paused and resumed at (@last_reinit)
Agent state was paused and resumed at 1573166125
agent
Version of NetQ Agent has changed
Info
Agent version has been changed old_version:@old_version and new_version:@new_version. Agent reset at @sys_uptime
Agent version has been changed old_version:2.1.2 and new_version:2.3.1. Agent reset at 1573079725
BGP Events
Type
Trigger
Severity
Message Format
Example
bgp
BGP Session state changed
Critical
BGP session with peer @peer @neighbor vrf @vrf state changed from @old_state to @new_state
BGP session with peer leaf03 leaf04 vrf mgmt state changed from Established to Failed
bgp
BGP Session state changed from Failed to Established
Info
BGP session with peer @peer @peerhost @neighbor vrf @vrf session state changed from Failed to Established
BGP session with peer swp5 spine02 spine03 vrf default session state changed from Failed to Established
bgp
BGP Session state changed from Established to Failed
Info
BGP session with peer @peer @neighbor vrf @vrf state changed from established to failed
BGP session with peer leaf03 leaf04 vrf mgmt state changed from down to up
bgp
The reset time for a BGP session changed
Info
BGP session with peer @peer @neighbor vrf @vrf reset time changed from @old_last_reset_time to @new_last_reset_time
BGP session with peer spine03 swp9 vrf vrf2 reset time changed from 1559427694 to 1559837484
BTRFS Events
Type
Trigger
Severity
Message Format
Example
btrfsinfo
Disk space available after BTRFS allocation is less than 80% of partition size or only 2 GB remain.
Critical
@info : @details
high btrfs allocation space : greater than 80% of partition size, 61708420
btrfsinfo
Indicates if a rebalance operation can free up space on the disk
Critical
@info : @details
data storage efficiency : space left after allocation greater than chunk size 6170849.2","
Cable Events
Type
Trigger
Severity
Message Format
Example
cable
Link speed is not the same on both ends of the link
Critical
@ifname speed @speed, mismatched with peer @peer @peer_if speed @peer_speed
swp2 speed 10, mismatched with peer server02 swp8 speed 40
cable
The speed setting for a given port changed
Info
@ifname speed changed from @old_speed to @new_speed
swp9 speed changed from 10 to 40
cable
The transceiver status for a given port changed
Info
@ifname transceiver changed from @old_transceiver to @new_transceiver
swp4 transceiver changed from disabled to enabled
cable
The vendor of a given transceiver changed
Info
@ifname vendor name changed from @old_vendor_name to @new_vendor_name
swp23 vendor name changed from Broadcom to NVIDIA
cable
The part number of a given transceiver changed
Info
@ifname part number changed from @old_part_number to @new_part_number
swp7 part number changed from FP1ZZ5654002A to MSN2700-CS2F0
cable
The serial number of a given transceiver changed
Info
@ifname serial number changed from @old_serial_number to @new_serial_number
swp4 serial number changed from 571254X1507020 to MT1552X12041
cable
The status of forward error correction (FEC) support for a given port changed
Info
@ifname supported fec changed from @old_supported_fec to @new_supported_fec
swp12 supported fec changed from supported to unsupported
swp12 supported fec changed from unsupported to supported
cable
The advertised support for FEC for a given port changed
Info
@ifname supported fec changed from @old_advertised_fec to @new_advertised_fec
swp24 supported FEC changed from advertised to not advertised
cable
The FEC status for a given port changed
Info
@ifname fec changed from @old_fec to @new_fec
swp15 fec changed from disabled to enabled
CLAG/MLAG Events
Type
Trigger
Severity
Message Format
Example
clag
CLAG remote peer state changed from up to down
Critical
Peer state changed to down
Peer state changed to down
clag
Local CLAG host MTU does not match its remote peer MTU
Critical
SVI @svi1 on vlan @vlan mtu @mtu1 mismatched with peer mtu @mtu2
SVI svi7 on vlan 4 mtu 1592 mistmatched with peer mtu 1680
clag
CLAG SVI on VLAN is missing from remote peer state
Warning
SVI on vlan @vlan is missing from peer
SVI on vlan vlan4 is missing from peer
clag
CLAG peerlink is not opperating at full capacity. At least one link is down.
Warning
Clag peerlink not at full redundancy, member link @slave is down
Clag peerlink not at full redundancy, member link swp40 is down
clag
CLAG remote peer state changed from down to up
Info
Peer state changed to up
Peer state changed to up
clag
Local CLAG host state changed from down to up
Info
Clag state changed from down to up
Clag state changed from down to up
clag
CLAG bond in Conflicted state updated with new bonds
Info
Clag conflicted bond changed from @old_conflicted_bonds to @new_conflicted_bonds
Clag conflicted bond changed from swp7 swp8 to @swp9 swp10
clag
CLAG bond changed state from protodown to up state
Info
Clag conflicted bond changed from @old_state_protodownbond to @new_state_protodownbond
Clag conflicted bond changed from protodown to up
CL Support Events
Type
Trigger
Severity
Message Format
Example
clsupport
A new CL Support file has been created for the given node
Critical
HostName @hostname has new CL SUPPORT file
HostName leaf01 has new CL SUPPORT file
Config Diff Events
Type
Trigger
Severity
Message Format
Example
configdiff
Configuration file deleted on a device
Critical
@hostname config file @type was deleted
spine03 config file /etc/frr/frr.conf was deleted
configdiff
Configuration file has been created
Info
@hostname config file @type was created
leaf12 config file /etc/lldp.d/README.conf was created
configdiff
Configuration file has been modified
Info
@hostname config file @type was modified
spine03 config file /etc/frr/frr.conf was modified
EVPN Events
Type
Trigger
Severity
Message Format
Example
evpn
A VNI was configured and moved from the up state to the down state
Critical
VNI @vni state changed from up to down
VNI 36 state changed from up to down
evpn
A VNI was configured and moved from the down state to the up state
Info
VNI @vni state changed from down to up
VNI 36 state changed from down to up
evpn
The kernel state changed on a VNI
Info
VNI @vni kernel state changed from @old_in_kernel_state to @new_in_kernel_state
VNI 3 kernel state changed from down to up
evpn
A VNI state changed from not advertising all VNIs to advertising all VNIs
Info
VNI @vni vni state changed from @old_adv_all_vni_state to @new_adv_all_vni_state
VNI 11 vni state changed from false to true
Lifecycle Management Events
Type
Trigger
Severity
Message Format
Example
lcm
Cumulus Linux backup started for a switch or host
Info
CL configuration backup started for hostname @hostname
CL configuration backup started for hostname spine01
lcm
Cumulus Linux backup completed for a switch or host
Info
CL configuration backup completed for hostname @hostname
CL configuration backup completed for hostname spine01
lcm
Cumulus Linux backup failed for a switch or host
Critical
CL configuration backup failed for hostname @hostname
CL configuration backup failed for hostname spine01
lcm
Cumulus Linux upgrade from one version to a newer version has started for a switch or host
Critical
CL Image upgrade from version @old_cl_version to version @new_cl_version started for hostname @hostname
CL Image upgrade from version 4.1.0 to version 4.2.1 started for hostname server01
lcm
Cumulus Linux upgrade from one version to a newer version has completed successfully for a switch or host
Info
CL Image upgrade from version @old_cl_version to version @new_cl_version completed for hostname @hostname
CL Image upgrade from version 4.1.0 to version 4.2.1 completed for hostname server01
lcm
Cumulus Linux upgrade from one version to a newer version has failed for a switch or host
Critical
CL Image upgrade from version @old_cl_version to version @new_cl_version failed for hostname @hostname
CL Image upgrade from version 4.1.0 to version 4.2.1 failed for hostname server01
lcm
Restoration of a Cumulus Linux configuration started for a switch or host
Info
CL configuration restore started for hostname @hostname
CL configuration restore started for hostname leaf01
lcm
Restoration of a Cumulus Linux configuration completed successfully for a switch or host
Info
CL configuration restore completed for hostname @hostname
CL configuration restore completed for hostname leaf01
lcm
Restoration of a Cumulus Linux configuration failed for a switch or host
Critical
CL configuration restore failed for hostname @hostname
CL configuration restore failed for hostname leaf01
lcm
Rollback of a Cumulus Linux image has started for a switch or host
Critical
CL Image rollback from version @old_cl_version to version @new_cl_version started for hostname @hostname
CL Image rollback from version 4.2.1 to version 4.1.0 started for hostname leaf01
lcm
Rollback of a Cumulus Linux image has completed successfully for a switch or host
Info
CL Image rollback from version @old_cl_version to version @new_cl_version completed for hostname @hostname
CL Image rollback from version 4.2.1 to version 4.1.0 completed for hostname leaf01
lcm
Rollback of a Cumulus Linux image has failed for a switch or host
Critical
CL Image rollback from version @old_cl_version to version @new_cl_version failed for hostname @hostname
CL Image rollback from version 4.2.1 to version 4.1.0 failed for hostname leaf01
lcm
Installation of a NetQ image has started for a switch or host
Info
NetQ Image version @netq_version installation started for hostname @hostname
NetQ Image version 3.2.0 installation started for hostname spine02
lcm
Installation of a NetQ image has completed successfully for a switch or host
Info
NetQ Image version @netq_version installation completed for hostname @hostname
NetQ Image version 3.2.0 installation completed for hostname spine02
lcm
Installation of a NetQ image has failed for a switch or host
Critical
NetQ Image version @netq_version installation failed for hostname @hostname
NetQ Image version 3.2.0 installation failed for hostname spine02
lcm
Upgrade of a NetQ image has started for a switch or host
Info
NetQ Image upgrade from version @old_netq_version to version @netq_version started for hostname @hostname
NetQ Image upgrade from version 3.1.0 to version 3.2.0 started for hostname spine02
lcm
Upgrade of a NetQ image has completed successfully for a switch or host
Info
NetQ Image upgrade from version @old_netq_version to version @netq_version completed for hostname @hostname
NetQ Image upgrade from version 3.1.0 to version 3.2.0 completed for hostname spine02
lcm
Upgrade of a NetQ image has failed for a switch or host
Critical
NetQ Image upgrade from version @old_netq_version to version @netq_version failed for hostname @hostname
NetQ Image upgrade from version 3.1.0 to version 3.2.0 failed for hostname spine02
Link Events
Type
Trigger
Severity
Message Format
Example
link
Link operational state changed from up to down
Critical
HostName @hostname changed state from @old_state to @new_state Interface:@ifname
HostName leaf01 changed state from up to down Interface:swp34
link
Link operational state changed from down to up
Info
HostName @hostname changed state from @old_state to @new_state Interface:@ifname
HostName leaf04 changed state from down to up Interface:swp11
LLDP Events
Type
Trigger
Severity
Message Format
Example
lldp
Local LLDP host has new neighbor information
Info
LLDP Session with host @hostname and @ifname modified fields @changed_fields
LLDP Session with host leaf02 swp6 modified fields leaf06 swp21
lldp
Local LLDP host has new peer interface name
Info
LLDP Session with host @hostname and @ifname @old_peer_ifname changed to @new_peer_ifname
LLDP Session with host spine01 and swp5 swp12 changed to port12
lldp
Local LLDP host has new peer hostname
Info
LLDP Session with host @hostname and @ifname @old_peer_hostname changed to @new_peer_hostname
LLDP Session with host leaf03 and swp2 leaf07 changed to exit01
MTU Events
Type
Trigger
Severity
Message Format
Example
mtu
VLAN interface link MTU is smaller than that of its parent MTU
Warning
vlan interface @link mtu @mtu is smaller than parent @parent mtu @parent_mtu
vlan interface swp3 mtu 1500 is smaller than parent peerlink-1 mtu 1690
mtu
Bridge interface MTU is smaller than the member interface with the smallest MTU
Warning
bridge @link mtu @mtu is smaller than least of member interface mtu @min
bridge swp0 mtu 1280 is smaller than least of member interface mtu 1500
NTP Events
Type
Trigger
Severity
Message Format
Example
ntp
NTP sync state changed from in sync to not in sync
Critical
Sync state changed from @old_state to @new_state for @hostname
Sync state changed from in sync to not sync for leaf06
ntp
NTP sync state changed from not in sync to in sync
Info
Sync state changed from @old_state to @new_state for @hostname
Sync state changed from not sync to in sync for leaf06
OSPF Events
Type
Trigger
Severity
Message Format
Example
ospf
OSPF session state on a given interface changed from Full to a down state
Critical
OSPF session @ifname with @peer_address changed from Full to @down_state
OSPF session swp7 with 27.0.0.18 state changed from Full to Fail
OSPF session swp7 with 27.0.0.18 state changed from Full to ExStart
ospf
OSPF session state on a given interface changed from a down state to full
Info
OSPF session @ifname with @peer_address changed from @down_state to Full
OSPF session swp7 with 27.0.0.18 state changed from Down to Full
OSPF session swp7 with 27.0.0.18 state changed from Init to Full
OSPF session swp7 with 27.0.0.18 state changed from Fail to Full
Package Information Events
Type
Trigger
Severity
Message Format
Example
packageinfo
Package version on device does not match the version identified in the existing manifest
Critical
@package_name manifest version mismatch
netq-apps manifest version mismatch
PTM Events
Type
Trigger
Severity
Message Format
Example
ptm
Physical interface cabling does not match configuration specified in topology.dot file
Critical
PTM cable status failed
PTM cable status failed
ptm
Physical interface cabling matches configuration specified in topology.dot file
Critical
PTM cable status passed
PTM cable status passed
Resource Events
Type
Trigger
Severity
Message Format
Example
resource
A physical resource has been deleted from a device
Critical
Resource Utils deleted for @hostname
Resource Utils deleted for spine02
resource
Root file system access on a device has changed from Read/Write to Read Only
Critical
@hostname root file system access mode set to Read Only
server03 root file system access mode set to Read Only
resource
Root file system access on a device has changed from Read Only to Read/Write
Info
@hostname root file system access mode set to Read/Write
leaf11 root file system access mode set to Read/Write
resource
A physical resource has been added to a device
Info
Resource Utils added for @hostname
Resource Utils added for spine04
Running Config Diff Events
Type
Trigger
Severity
Message Format
Example
runningconfigdiff
Running configuration file has been modified
Info
@commandname config result was modified
@commandname config result was modified
Sensor Events
Type
Trigger
Severity
Message Format
Example
sensor
A fan or power supply unit sensor has changed state
Critical
Sensor @sensor state changed from @old_s_state to @new_s_state
Sensor fan state changed from up to down
sensor
A temperature sensor has crossed the maximum threshold for that sensor
Critical
Sensor @sensor max value @new_s_max exceeds threshold @new_s_crit
Sensor temp max value 110 exceeds the threshold 95
sensor
A temperature sensor has crossed the minimum threshold for that sensor
Critical
Sensor @sensor min value @new_s_lcrit fall behind threshold @new_s_min
Sensor psu min value 10 fell below threshold 25
sensor
A temperature, fan, or power supply sensor state changed
Info
Sensor @sensor state changed from @old_state to @new_state
Sensor temperature state changed from critical to ok
Sensor fan state changed from absent to ok
Sensor psu state changed from bad to ok
sensor
A fan or power supply sensor state changed
Info
Sensor @sensor state changed from @old_s_state to @new_s_state
Sensor fan state changed from down to up
Sensor psu state changed from down to up
Services Events
Type
Trigger
Severity
Message Format
Example
services
A service status changed from down to up
Critical
Service @name status changed from @old_status to @new_status
Service bgp status changed from down to up
services
A service status changed from up to down
Critical
Service @name status changed from @old_status to @new_status
Service lldp status changed from up to down
services
A service changed state from inactive to active
Info
Service @name changed state from inactive to active
Service bgp changed state from inactive to active
Service lldp changed state from inactive to active
SSD Utilization Events
Type
Trigger
Severity
Message Format
Example
ssdutil
3ME3 disk health has dropped below 10%
Critical
@info: @details
low health : 5.0%
ssdutil
A dip in 3ME3 disk health of more than 2% has occurred within the last 24 hours
Critical
@info: @details
significant health drop : 3.0%
Version Events
Type
Trigger
Severity
Message Format
Example
version
An unknown version of the operating system was detected
Critical
unexpected os version @my_ver
unexpected os version cl3.2
version
Desired version of the operating system is not available
Critical
os version @ver
os version cl3.7.9
version
An unknown version of a software package was detected
Critical
expected release version @ver
expected release version cl3.6.2
version
Desired version of a software package is not available
Critical
different from version @ver
different from version cl4.0
VXLAN Events
Type
Trigger
Severity
Message Format
Example
vxlan
Replication list is contains an inconsistent set of nodes<>
Critical<>
VNI @vni replication list inconsistent with @conflicts diff:@diff<>
VNI 14 replication list inconsistent with ["leaf03","leaf04"] diff:+:["leaf03","leaf04"] -:["leaf07","leaf08"]
TCA Event Messages Reference
This reference lists the threshold-based events that NetQ supports for ACL resources, digital optics, forwarding resources, interface errors and statistics, link flaps, resource utilization, sensors, and What Just Happened. You can view these messages through third-party notification applications. For details about configuring notifications for these events, refer to Configure Threshold-Based Event Notifications.
ACL Resources
NetQ UI Name
NetQ CLI Event ID
Description
Ingress ACL IPv4 %
TCA_TCAM_IN_ACL_V4_FILTER_UPPER
Number of ingress ACL filters for IPv4 addresses on a given switch or host exceeded user-defined threshold
Egress ACL IPv4 %
TCA_TCAM_EG_ACL_V4_FILTER_UPPER
Number of egress ACL filters for IPv4 addresses on a given switch or host exceeded user-defined maximum threshold
Ingress ACL IPv4 Mangle %
TCA_TCAM_IN_ACL_V4_MANGLE_UPPER
Number of ingress ACL mangles for IPv4 addresses on a given switch or host exceeded user-defined maximum threshold
Ingress ACL IPv4 Mangle %
TCA_TCAM_EG_ACL_V4_MANGLE_UPPER
Number of egress ACL mangles for IPv4 addresses on a given switch or host exceeded user-defined maximum threshold
Ingress ACL IPv6 %
TCA_TCAM_IN_ACL_V6_FILTER_UPPER
Number of ingress ACL filters for IPv6 addresses on a given switch or host exceeded user-defined maximum threshold
Egress ACL IPv6 %
TCA_TCAM_EG_ACL_V6_FILTER_UPPER
Number of egress ACL filters for IPv6 addresses on a given switch or host exceeded user-defined maximum threshold
Ingress ACL IPv6 Mangle %
TCA_TCAM_IN_ACL_V6_MANGLE_UPPER
Number of ingress ACL mangles for IPv6 addresses on a given switch or host exceeded user-defined maximum threshold
Egress ACL IPv6 Mangle %
TCA_TCAM_EG_ACL_V6_MANGLE_UPPER
Number of egress ACL mangles for IPv6 addresses on a given switch or host exceeded user-defined maximum threshold
Ingress ACL 8021x %
TCA_TCAM_IN_ACL_8021x_FILTER_UPPER
Number of ingress ACL 802.1 filters on a given switch or host exceeded user-defined maximum threshold
ACL L4 port %
TCA_TCAM_ACL_L4_PORT_CHECKERS_UPPER
Number of ACL port range checkers on a given switch or host exceeded user-defined maximum threshold
ACL Regions %
TCA_TCAM_ACL_REGIONS_UPPER
Number of ACL regions on a given switch or host exceeded user-defined maximum threshold
Ingress ACL Mirror %
TCA_TCAM_IN_ACL_MIRROR_UPPER
Number of ingress ACL mirrors on a given switch or host exceeded user-defined maximum threshold
ACL 18B Rules %
TCA_TCAM_ACL_18B_RULES_UPPER
Number of ACL 18B rules on a given switch or host exceeded user-defined maximum threshold
ACL 32B %
TCA_TCAM_ACL_32B_RULES_UPPER
Number of ACL 32B rules on a given switch or host exceeded user-defined maximum threshold
ACL 54B %
TCA_TCAM_ACL_54B_RULES_UPPER
Number of ACL 54B rules on a given switch or host exceeded user-defined maximum threshold
Ingress PBR IPv4 %
TCA_TCAM_IN_PBR_V4_FILTER_UPPER
Number of ingress policy-based routing (PBR) filters for IPv4 addresses on a given switch or host exceeded user-defined maximum threshold
Ingress PBR IPv6 %
TCA_TCAM_IN_PBR_V6_FILTER_UPPER
Number of ingress policy-based routing (PBR) filters for IPv6 addresses on a given switch or host exceeded user-defined maximum threshold
Digital Optics
Some of the event IDs have changed. If you have TCA rules configured for digital optics for a NetQ 3.1.0 deployment or earlier, verify that they are using the correct event IDs. You might need to remove and recreate some of the events.
NetQ UI Name
NetQ CLI Event ID
Description
Laser RX Power Alarm Upper
TCA_DOM_RX_POWER_ALARM_UPPER
Transceiver Input power (mW) for the digital optical module on a given switch or host interface exceeded user-defined the maximum alarm threshold
Laser RX Power Alarm Lower
TCA_DOM_RX_POWER_ALARM_LOWER
Transceiver Input power (mW) for the digital optical module on a given switch or host exceeded user-defined minimum alarm threshold
Laser RX Power Warning Upper
TCA_DOM_RX_POWER_WARNING_UPPER
Transceiver Input power (mW) for the digital optical module on a given switch or host exceeded user-defined specified warning threshold
Laser RX Power Warning Lower
TCA_DOM_RX_POWER_WARNING_LOWER
Transceiver Input power (mW) for the digital optical module on a given switch or host exceeded user-defined minimum warning threshold
Laser Bias Current Alarm Upper
TCA_DOM_BIAS_CURRENT_ALARM_UPPER
Laser bias current (mA) for the digital optical module on a given switch or host exceeded user-defined maximum alarm threshold
Laser Bias Current Alarm Lower
TCA_DOM_BIAS__CURRENT_ALARM_LOWER
Laser bias current (mA) for the digital optical module on a given switch or host exceeded user-defined minimum alarm threshold
Laser Bias Current Warning Upper
TCA_DOM_BIAS_CURRENT_WARNING_UPPER
Laser bias current (mA) for the digital optical module on a given switch or host exceeded user-defined maximum warning threshold
Laser Bias Current Warning Lower
TCA_DOM_BIAS__CURRENT_WARNING_LOWER
Laser bias current (mA) for the digital optical module on a given switch or host exceeded user-defined minimum warning threshold
Laser Output Power Alarm Upper
TCA_DOM_OUTPUT_POWER_ALARM_UPPER
Laser output power (mW) for the digital optical module on a given switch or host exceeded user-defined maximum alarm threshold
Laser Output Power Alarm Lower
TCA_DOM_OUTPUT_POWER_ALARM_LOWER
Laser output power (mW) for the digital optical module on a given switch or host exceeded user-defined minimum alarm threshold
Laser Output Power Alarm Upper
TCA_DOM_OUTPUT_POWER_WARNING_UPPER
Laser output power (mW) for the digital optical module on a given switch or host exceeded user-defined maximum warning threshold
Laser Output Power Warning Lower
TCA_DOM_OUTPUT_POWER_WARNING_LOWER
Laser output power (mW) for the digital optical module on a given switch or host exceeded user-defined minimum warning threshold
Laser Module Temperature Alarm Upper
TCA_DOM_MODULE_TEMPERATURE_ALARM_UPPER
Digital optical module temperature (°C) on a given switch or host exceeded user-defined maximum alarm threshold
Laser Module Temperature Alarm Lower
TCA_DOM_MODULE_TEMPERATURE_ALARM_LOWER
Digital optical module temperature (°C) on a given switch or host exceeded user-defined minimum alarm threshold
Laser Module Temperature Warning Upper
TCA_DOM_MODULE_TEMPERATURE_WARNING_UPPER
Digital optical module temperature (°C) on a given switch or host exceeded user-defined maximum warning threshold
Laser Module Temperature Warning Lower
TCA_DOM_MODULE_TEMPERATURE_WARNING_LOWER
Digital optical module temperature (°C) on a given switch or host exceeded user-defined minimum warning threshold
Laser Module Voltage Alarm Upper
TCA_DOM_MODULE_VOLTAGE_ALARM_UPPER
Transceiver voltage (V) on a given switch or host exceeded user-defined maximum alarm threshold
Laser Module Voltage Alarm Lower
TCA_DOM_MODULE_VOLTAGE_ALARM_LOWER
Transceiver voltage (V) on a given switch or host exceeded user-defined minimum alarm threshold
Laser Module Voltage Warning Upper
TCA_DOM_MODULE_VOLTAGE_WARNING_UPPER
Transceiver voltage (V) on a given switch or host exceeded user-defined maximum warning threshold
Laser Module Voltage Warning Lower
TCA_DOM_MODULE_VOLTAGE_WARNING_LOWER
Transceiver voltage (V) on a given switch or host exceeded user-defined minimum warning threshold
Forwarding Resources
NetQ UI Name
NetQ CLI Event ID
Description
Total Route Entries %
TCA_TCAM_TOTAL_ROUTE_ENTRIES_UPPER
Number of routes on a given switch or host exceeded user-defined maximum threshold
Mcast Routes %
TCA_TCAM_TOTAL_MCAST_ROUTES_UPPER
Number of multicast routes on a given switch or host exceeded user-defined maximum threshold
MAC entries %
TCA_TCAM_MAC_ENTRIES_UPPER
Number of MAC addresses on a given switch or host exceeded user-defined maximum threshold
IPv4 Routes %
TCA_TCAM_IPV4_ROUTE_UPPER
Number of IPv4 routes on a given switch or host exceeded user-defined maximum threshold
IPv4 Hosts %
TCA_TCAM_IPV4_HOST_UPPER
Number of IPv4 hosts on a given switch or host exceeded user-defined maximum threshold
Exceeding IPV6 Routes %
TCA_TCAM_IPV6_ROUTE_UPPER
Number of IPv6 routes on a given switch or host exceeded user-defined maximum threshold
IPv6 Hosts %
TCA_TCAM_IPV6_HOST_UPPER
Number of IPv6 hosts on a given switch or host exceeded user-defined maximum threshold
ECMP Next Hop %
TCA_TCAM_ECMP_NEXTHOPS_UPPER
Number of equal cost multi-path (ECMP) next hop entries on a given switch or host exceeded user-defined maximum threshold
Interface Errors
NetQ UI Name
NetQ CLI Event ID
Description
Oversize Errors
TCA_HW_IF_OVERSIZE_ERRORS
Number of times a frame longer than maximum size (1518 Bytes) exceeded user-defined threshold
Undersize Errors
TCA_HW_IF_UNDERSIZE_ERRORS
Number of times a frame shorter than minimum size (64 Bytes) exceeded user-defined threshold
Alignment Errors
TCA_HW_IF_ALIGNMENT_ERRORS
Number of times a frame with an uneven byte count and a CRC error exceeded user-defined threshold
Jabber Errors
TCA_HW_IF_JABBER_ERRORS
Number of times a frame longer than maximum size (1518 bytes) and with a CRC error exceeded user-defined threshold
Symbol Errors
TCA_HW_IF_SYMBOL_ERRORS
Number of times that detected undefined or invalid symbols exceeded user-defined threshold
Interface Statistics
NetQ UI Name
NetQ CLI Event ID
Description
Example Message
Broadcast Received Bytes
TCA_RXBROADCAST_UPPER
Number of broadcast receive bytes per second exceeded user-defined maximum threshold on a switch interface
Number of link flaps user-defined maximum threshold
Resource Utilization
NetQ UI Name
NetQ CLI Event ID
Description
Example Message
CPU Utilization
TCA_CPU_UTILIZATION_UPPER
Percentage of CPU utilization exceeded user-defined maximum threshold on a switch or host
CPU Utilization for host leaf11 exceed configured mark 85
Disk Utilization
TCA_DISK_UTILIZATION_UPPER
Percentage of disk utilization exceeded user-defined maximum threshold on a switch or host
Disk Utilization for host leaf11 exceed configured mark 90
Memory Utilization
TCA_MEMORY_UTILIZATION_UPPER
Percentage of memory utilization exceeded user-defined maximum threshold on a switch or host
Memory Utilization for host leaf11 exceed configured mark 95
RoCE
NetQ UI Name
NetQ CLI Event ID
Description
Rx CNP Buffer Usage Cells
TCA_RX_CNP_BUFFER_USAGE_CELLS
Percentage of Rx General+CNP buffer usage exceeded user-defined maximum threshold on a switch interface
Rx CNP No Buffer Discard
TCA_RX_CNP_NO_BUFFER_DISCARD
Rate of Rx General+CNP no buffer discard exceeded user-defined maximum threshold on a switch interface
Rx CNP PG Usage Cells
TCA_RX_CNP_PG_USAGE_CELLS
Percentage of Rx General+CNP PG usage exceeded user-defined maximum threshold on a switch interface
Rx RoCE Buffer Usage Cells
TCA_RX_ROCE_BUFFER_USAGE_CELLS
Percentage of Rx RoCE buffer usage exceeded user-defined maximum threshold on a switch interface
Rx RoCE No Buffer Discard
TCA_RX_ROCE_NO_BUFFER_DISCARD
Rate of Rx RoCE no buffer discard exceeded user-defined maximum threshold on a switch interface
Rx RoCE PG Usage Cells
TCA_RX_ROCE_PG_USAGE_CELLS
Percentage of Rx RoCE PG usage exceeded user-defined maximum threshold on a switch interface
Rx RoCE PFC Pause Duration
TCA_RX_ROCE_PFC_PAUSE_DURATION
Number of Rx RoCE PFC pause duration exceeded user-defined maximum threshold on a switch interface
Rx RoCE PFC Pause Packets
TCA_RX_ROCE_PFC_PAUSE_PACKETS
Rate of Rx RoCE PFC pause packets exceeded user-defined maximum threshold on a switch interface
Tx CNP Buffer Usage Cells
TCA_TX_CNP_BUFFER_USAGE_CELLS
Percentage of Tx General+CNP buffer usage exceeded user-defined maximum threshold on a switch interface
Tx CNP TC Usage Cells
TCA_TX_CNP_TC_USAGE_CELLS
Percentage of Tx CNP TC usage exceeded user-defined maximum threshold on a switch interface
Tx CNP Unicast No Buffer Discard
TCA_TX_CNP_UNICAST_NO_BUFFER_DISCARD
Rate of Tx CNP unicast no buffer discard exceeded user-defined maximum threshold on a switch interface
Tx ECN Marked Packets
TCA_TX_ECN_MARKED_PACKETS
Rate of Tx Port ECN marked packets exceeded user-defined maximum threshold on a switch interface
Tx RoCE Buffer Usage Cells
TCA_TX_ROCE_BUFFER_USAGE_CELLS
Percentage of Tx RoCE buffer usage exceeded user-defined maximum threshold on a switch interface
Tx RoCE PFC Pause Duration
TCA_TX_ROCE_PFC_PAUSE_DURATION
Number of Tx RoCE PFC pause duration exceeded user-defined maximum threshold on a switch interface
Tx RoCE PFC Pause Packets
TCA_TX_ROCE_PFC_PAUSE_PACKETS
Rate of Tx RoCE PFC pause packets exceeded user-defined maximum threshold on a switch interface
Tx RoCE TC Usage Cells
TCA_TX_ROCE_TC_USAGE_CELLS
Percentage of Tx RoCE TC usage exceeded user-defined maximum threshold on a switch interface
Tx RoCE Unicast No Buffer Discard
TCA_TX_ROCE_UNICAST_NO_BUFFER_DISCARD
Rate of Tx RoCE unicast no buffer discard exceeded user-defined maximum threshold on a switch interface
Sensors
NetQ UI Name
NetQ CLI Event ID
Description
Example Message
Fan Speed
TCA_SENSOR_FAN_UPPER
Fan speed exceeded user-defined maximum threshold on a switch
Sensor for spine03 exceeded threshold fan speed 700 for sensor fan2
Power Supply Watts
TCA_SENSOR_POWER_UPPER
Power supply output exceeded user-defined maximum threshold on a switch
Sensor for leaf14 exceeded threshold power 120 watts for sensor psu1
Power Supply Volts
TCA_SENSOR_VOLTAGE_UPPER
Power supply voltage exceeded user-defined maximum threshold on a switch
Sensor for leaf14 exceeded threshold voltage 12 volts for sensor psu2
Switch Temperature
TCA_SENSOR_TEMPERATURE_UPPER
Temperature (° C) exceeded user-defined maximum threshold on a switch
Sensor for leaf14 exceeded threshold temperature 90 for sensor temp1
What Just Happened
NetQ UI Name
NetQ CLI Event ID
Drop Type
Reason/Port Down Reason
Description
ACL Drop Aggregate Upper
TCA_WJH_ACL_DROP_AGG_UPPER
ACL
Egress port ACL
ACL action set to deny on the physical egress port or bond
ACL Drop Aggregate Upper
TCA_WJH_ACL_DROP_AGG_UPPER
ACL
Egress router ACL
ACL action set to deny on the egress switch virtual interfaces (SVIs)
ACL Drop Aggregate Upper
TCA_WJH_ACL_DROP_AGG_UPPER
ACL
Ingress port ACL
ACL action set to deny on the physical ingress port or bond
ACL Drop Aggregate Upper
TCA_WJH_ACL_DROP_AGG_UPPER
ACL
Ingress router ACL
ACL action set to deny on the ingress switch virtual interfaces (SVIs)
Buffer Drop Aggregate Upper
TCA_WJH_BUFFER_DROP_AGG_UPPER
Buffer
Packet Latency Threshold Crossed
Time a packet spent within the switch exceeded or dropped below the specified high or low threshold
Buffer Drop Aggregate Upper
TCA_WJH_BUFFER_DROP_AGG_UPPER
Buffer
Port TC Congestion Threshold Crossed
Percentage of the occupancy buffer exceeded or dropped below the specified high or low threshold
Buffer Drop Aggregate Upper
TCA_WJH_BUFFER_DROP_AGG_UPPER
Buffer
Tail drop
Tail drop is enabled, and buffer queue is filled to maximum capacity
Buffer Drop Aggregate Upper
TCA_WJH_BUFFER_DROP_AGG_UPPER
Buffer
WRED
Weighted Random Early Detection is enabled, and buffer queue is filled to maximum capacity or the RED engine dropped the packet as of random congestion prevention
CRC Error Upper
TCA_WJH_CRC_ERROR_UPPER
L1
Auto-negotiation failure
Negotiation of port speed with peer has failed
CRC Error Upper
TCA_WJH_CRC_ERROR_UPPER
L1
Bad signal integrity
Integrity of the signal on port is not sufficient for good communication
CRC Error Upper
TCA_WJH_CRC_ERROR_UPPER
L1
Cable/transceiver is not supported
The attached cable or transceiver is not supported by this port
CRC Error Upper
TCA_WJH_CRC_ERROR_UPPER
L1
Cable/transceiver is unplugged
A cable or transceiver is missing or not fully inserted into the port
CRC Error Upper
TCA_WJH_CRC_ERROR_UPPER
L1
Calibration failure
Calibration failure
CRC Error Upper
TCA_WJH_CRC_ERROR_UPPER
L1
Link training failure
Link is not able to go operational up due to link training failure
CRC Error Upper
TCA_WJH_CRC_ERROR_UPPER
L1
Peer is sending remote faults
Peer node is not operating correctly
CRC Error Upper
TCA_WJH_CRC_ERROR_UPPER
L1
Port admin down
Port has been purposely set down by user
Drop Aggregate Upper
TCA_WJH_DROP_AGG_UPPER
L2
Destination MAC is reserved (DMAC=01-80-C2-00-00-0x)
The address cannot be used by this link
Drop Aggregate Upper
TCA_WJH_DROP_AGG_UPPER
L2
Ingress spanning tree filter
Port is in Spanning Tree blocking state
Drop Aggregate Upper
TCA_WJH_DROP_AGG_UPPER
L2
Ingress VLAN filtering
Frames whose port is not a member of the VLAN are discarded
Drop Aggregate Upper
TCA_WJH_DROP_AGG_UPPER
L2
MLAG port isolation
Not supported for port isolation implemented with system ACL
Drop Aggregate Upper
TCA_WJH_DROP_AGG_UPPER
L2
Multicast egress port list is empty
No ports are defined for multicast egress
Drop Aggregate Upper
TCA_WJH_DROP_AGG_UPPER
L2
Port loopback filter
Port is operating in loopback mode; packets are being sent to itself (source MAC address is the same as the destination MAC address
Drop Aggregate Upper
TCA_WJH_DROP_AGG_UPPER
L2
Unicast MAC table action discard
Currently not supported
Drop Aggregate Upper
TCA_WJH_DROP_AGG_UPPER
L2
VLAN tagging mismatch
VLAN tags on the source and destination do not match
Drop Aggregate Upper
TCA_WJH_DROP_AGG_UPPER
Router
Blackhole ARP/neighbor
Packet received with blackhole adjacency
Drop Aggregate Upper
TCA_WJH_DROP_AGG_UPPER
Router
Blackhole route
Packet received with action equal to discard
Drop Aggregate Upper
TCA_WJH_DROP_AGG_UPPER
Router
Checksum or IPver or IPv4 IHL too short
Cannot read packet due to header checksum error, IP version mismatch, or IPv4 header length is too short
Drop Aggregate Upper
TCA_WJH_DROP_AGG_UPPER
Router
Destination IP is loopback address
Cannot read packet as destination IP address is a loopback address (dip=>127.0.0.0/8)
Drop Aggregate Upper
TCA_WJH_DROP_AGG_UPPER
Router
Egress router interface is disabled
Packet destined to a different subnet cannot be routed because egress router interface is disabled
Drop Aggregate Upper
TCA_WJH_DROP_AGG_UPPER
Router
Ingress router interface is disabled
Packet destined to a different subnet cannot be routed because ingress router interface is disabled
Drop Aggregate Upper
TCA_WJH_DROP_AGG_UPPER
Router
IPv4 destination IP is link local
Packet has IPv4 destination address that is a local link (destination in 169.254.0.0/16)
Drop Aggregate Upper
TCA_WJH_DROP_AGG_UPPER
Router
IPv4 destination IP is local network (destination=0.0.0.0/8)
Packet has IPv4 destination address that is a local network (destination=0.0.0.0/8)
Drop Aggregate Upper
TCA_WJH_DROP_AGG_UPPER
Router
IPv4 routing table (LPM) unicast miss
No route available in routing table for packet
Drop Aggregate Upper
TCA_WJH_DROP_AGG_UPPER
Router
IPv4 source IP is limited broadcast
Packet has broadcast source IP address
Drop Aggregate Upper
TCA_WJH_DROP_AGG_UPPER
Router
IPv6 destination in multicast scope FFx0:/16
Packet received with multicast destination address in FFx0:/16 address range
Drop Aggregate Upper
TCA_WJH_DROP_AGG_UPPER
Router
IPv6 destination in multicast scope FFx1:/16
Packet received with multicast destination address in FFx1:/16 address range
Drop Aggregate Upper
TCA_WJH_DROP_AGG_UPPER
Router
IPv6 routing table (LPM) unicast miss
No route available in routing table for packet
Drop Aggregate Upper
TCA_WJH_DROP_AGG_UPPER
Router
Multicast MAC mismatch
For IPv4, destination MAC address is not equal to {0x01-00-5E-0 (25 bits), DIP[22:0]} and DIP is multicast. For IPv6, destination MAC address is not equal to {0x3333, DIP[31:0]} and DIP is multicast
Drop Aggregate Upper
TCA_WJH_DROP_AGG_UPPER
Router
Non IP packet
Cannot read packet header because it is not an IP packet
Drop Aggregate Upper
TCA_WJH_DROP_AGG_UPPER
Router
Non-routable packet
Packet has no route in routing table
Drop Aggregate Upper
TCA_WJH_DROP_AGG_UPPER
Router
Packet size is larger than router interface MTU
Packet has larger MTU configured than the VLAN
Drop Aggregate Upper
TCA_WJH_DROP_AGG_UPPER
Router
Router interface loopback
Packet has destination IP address that is local. For example, SIP = 1.1.1.1, DIP = 1.1.1.128.
Drop Aggregate Upper
TCA_WJH_DROP_AGG_UPPER
Router
Source IP equals destination IP
Packet has a source IP address equal to the destination IP address
Drop Aggregate Upper
TCA_WJH_DROP_AGG_UPPER
Router
Source IP is in class E
Cannot read packet as source IP address is a Class E address
Drop Aggregate Upper
TCA_WJH_DROP_AGG_UPPER
Router
Source IP is loopback address
Cannot read packet as source IP address is a loopback address ( ipv4 => 127.0.0.0/8 for ipv6 => ::1/128)
Drop Aggregate Upper
TCA_WJH_DROP_AGG_UPPER
Router
Source IP is multicast
Cannot read packet as source IP address is a multicast address (ipv4 SIP => 224.0.0.0/4)
Drop Aggregate Upper
TCA_WJH_DROP_AGG_UPPER
Router
Source IP is unspecified
Cannot read packet as source IP address is unspecified (ipv4 = 0.0.0.0/32; for ipv6 = ::0)
Drop Aggregate Upper
TCA_WJH_DROP_AGG_UPPER
Router
TTL value is too small
Packet has TTL value of 1
Drop Aggregate Upper
TCA_WJH_DROP_AGG_UPPER
Router
Unicast destination IP but multicast destination MAC
Cannot read packet with IP unicast address when destination MAC address is not unicast (FF:FF:FF:FF:FF:FF)
Drop Aggregate Upper
TCA_WJH_DROP_AGG_UPPER
Router
Unresolved neighbor/next-hop
The next hop in the route is unknown
Drop Aggregate Upper
TCA_WJH_DROP_AGG_UPPER
Tunnel
Decapsulation error
De-capsulation produced incorrect format of packet. For example, encapsulation of packet with many VLANs or IP options on the underlay can cause de-capsulation to result in a short packet.
Drop Aggregate Upper
TCA_WJH_DROP_AGG_UPPER
Tunnel
Overlay switch - Source MAC equals destination MAC
Overlay packet’s source MAC address is the same as the destination MAC address
Drop Aggregate Upper
TCA_WJH_DROP_AGG_UPPER
Tunnel
Overlay switch - Source MAC is multicast
Overlay packet’s source MAC address is multicast
Symbol Error Upper
TCA_WJH_SYMBOL_ERROR_UPPER
L1
Auto-negotiation failure
Negotiation of port speed with peer has failed
Symbol Error Upper
TCA_WJH_SYMBOL_ERROR_UPPER
L1
Bad signal integrity
Integrity of the signal on port is not sufficient for good communication
Symbol Error Upper
TCA_WJH_SYMBOL_ERROR_UPPER
L1
Cable/transceiver is not supported
The attached cable or transceiver is not supported by this port
Symbol Error Upper
TCA_WJH_SYMBOL_ERROR_UPPER
L1
Cable/transceiver is unplugged
A cable or transceiver is missing or not fully inserted into the port
Symbol Error Upper
TCA_WJH_SYMBOL_ERROR_UPPER
L1
Calibration failure
Calibration failure
Symbol Error Upper
TCA_WJH_SYMBOL_ERROR_UPPER
L1
Link training failure
Link is not able to go operational up due to link training failure
Symbol Error Upper
TCA_WJH_SYMBOL_ERROR_UPPER
L1
Peer is sending remote faults
Peer node is not operating correctly
Symbol Error Upper
TCA_WJH_SYMBOL_ERROR_UPPER
L1
Port admin down
Port has been purposely set down by user
WJH Event Messages Reference
This reference lists all the NetQ-supported WJH metrics and provides a brief description of each. The full outputs vary slightly based on the type of drop and whether you are viewing the results in the NetQ UI or through one of the NetQ CLI commands.
Displays the reason why an ACL has dropped packets.
Reason
Description
Ingress port ACL
ACL action set to deny on the physical ingress port or bond
Ingress router ACL
ACL action set to deny on the ingress switch virtual interfaces (SVIs)
Egress port ACL
ACL action set to deny on the physical egress port or bond
Egress router ACL
ACL action set to deny on the egress SVIs
Buffer Drops
Displays the reason why the server buffer has dropped packets.
Reason
Description
Tail drop
Tail drop is enabled, and buffer queue is filled to maximum capacity
WRED
Weighted Random Early Detection is enabled, and buffer queue is filled to maximum capacity or the RED engine dropped the packet as of random congestion prevention
Port TC Congestion Threshold Crossed
Percentage of the occupancy buffer exceeded or dropped below the specified high or low threshold
Packet Latency Threshold Crossed
Time a packet spent within the switch exceeded or dropped below the specified high or low threshold
Layer 1 Drops
Displays the reason why a port is in the down state.
Reason
Description
Port admin down
Port has been purposely set down by user
Auto-negotiation failure
Negotiation of port speed with peer has failed
Logical mismatch with peer link
Logical mismatch with peer link
Link training failure
Link is not able to go operational up due to link training failure
Peer is sending remote faults
Peer node is not operating correctly
Bad signal integrity
Integrity of the signal on port is not sufficient for good communication
Cable/transceiver is not supported
The attached cable or transceiver is not supported by this port
Cable/transceiver is unplugged
A cable or transceiver is missing or not fully inserted into the port
Calibration failure
Calibration failure
Port state changes counter
Cumulative number of state changes
Symbol error counter
Cumulative number of symbol errors
CRC error counter
Cumulative number of CRC errors
In addition to the reason, the information provided for these drops includes:
Parameter
Description
Corrective Action
Provides recommend actions to take to resolve the port down state
First Timestamp
Date and time this port was marked as down for the first time
Ingress Port
Port accepting incoming traffic
CRC Error Count
Number of CRC errors generated by this port
Symbol Error Count
Number of Symbol errors generated by this port
State Change Count
Number of state changes that have occurred on this port
OPID
Operation identifier; used for internal purposes
Is Port Up
Indicates whether the port is in an Up (true) or Down (false) state
Layer 2 Drops
Displays the reason for a link to be down.
Reason
Description
MLAG port isolation
Not supported for port isolation implemented with system ACL
Destination MAC is reserved (DMAC=01-80-C2-00-00-0x)
The address cannot be used by this link
VLAN tagging mismatch
VLAN tags on the source and destination do not match
Ingress VLAN filtering
Frames whose port is not a member of the VLAN are discarded
Ingress spanning tree filter
Port is in Spanning Tree blocking state
Unicast MAC table action discard
Currently not supported
Multicast egress port list is empty
No ports are defined for multicast egress
Port loopback filter
Port is operating in loopback mode; packets are being sent to itself (source MAC address is the same as the destination MAC address
Source MAC is multicast
Packets have multicast source MAC address
Source MAC equals destination MAC
Source MAC address is the same as the destination MAC address
In addition to the reason, the information provided for these drops includes:
Parameter
Description
Source Port
Port ID where the link originates
Source IP
Port IP address where the link originates
Source MAC
Port MAC address where the link originates
Destination Port
Port ID where the link terminates
Destination IP
Port IP address where the link terminates
Destination MAC
Port MAC address where the link terminates
First Timestamp
Date and time this link was marked as down for the first time
Aggregate Count
Total number of dropped packets
Protocol
ID of the communication protocol running on this link
Ingress Port
Port accepting incoming traffic
OPID
Operation identifier; used for internal purposes
Router Drops
Displays the reason why the server is unable to route a packet.
Reason
Description
Non-routable packet
Packet has no route in routing table
Blackhole route
Packet received with action equal to discard
Unresolved next hop
The next hop in the route is unknown
Blackhole ARP/neighbor
Packet received with blackhole adjacency
IPv6 destination in multicast scope FFx0:/16
Packet received with multicast destination address in FFx0:/16 address range
IPv6 destination in multicast scope FFx1:/16
Packet received with multicast destination address in FFx1:/16 address range
Non-IP packet
Cannot read packet header because it is not an IP packet
Unicast destination IP but non-unicast destination MAC
Cannot read packet with IP unicast address when destination MAC address is not unicast (FF:FF:FF:FF:FF:FF)
Destination IP is loopback address
Cannot read packet as destination IP address is a loopback address (dip=>127.0.0.0/8)
Source IP is multicast
Cannot read packet as source IP address is a multicast address (ipv4 SIP => 224.0.0.0/4)
Source IP is in class E
Cannot read packet as source IP address is a Class E address
Source IP is loopback address
Cannot read packet as source IP address is a loopback address ( ipv4 => 127.0.0.0/8 for ipv6 => ::1/128)
Source IP is unspecified
Cannot read packet as source IP address is unspecified (ipv4 = 0.0.0.0/32; for ipv6 = ::0)
Checksum or IP ver or IPv4 IHL too short
Cannot read packet due to header checksum error, IP version mismatch, or IPv4 header length is too short
Multicast MAC mismatch
For IPv4, destination MAC address is not equal to {0x01-00-5E-0 (25 bits), DIP[22:0]} and DIP is multicast. For IPv6, destination MAC address is not equal to {0x3333, DIP[31:0]} and DIP is multicast
Source IP equals destination IP
Packet has a source IP address equal to the destination IP address
IPv4 source IP is limited broadcast
Packet has broadcast source IP address
IPv4 destination IP is local network (destination = 0.0.0.0/8)
Packet has IPv4 destination address that is a local network (destination=0.0.0.0/8)
IPv4 destination IP is link-local (destination in 169.254.0.0/16)
Packet has IPv4 destination address that is a local link
Ingress router interface is disabled
Packet destined to a different subnet cannot be routed because ingress router interface is disabled
Egress router interface is disabled
Packet destined to a different subnet cannot be routed because egress router interface is disabled
IPv4 routing table (LPM) unicast miss
No route available in routing table for packet
IPv6 routing table (LPM) unicast miss
No route available in routing table for packet
Router interface loopback
Packet has destination IP address that is local. For example, SIP = 1.1.1.1, DIP = 1.1.1.128.
Packet size is larger than MTU
Packet has larger MTU configured than the VLAN
TTL value is too small
Packet has TTL value of 1
Tunnel Drops
Displays the reason for a tunnel to be down.
Reason
Description
Overlay switch - source MAC is multicast
Overlay packet’s source MAC address is multicast
Overlay switch - source MAC equals destination MAC
Overlay packet’s source MAC address is the same as the destination MAC address
Decapsulation error
De-capsulation produced incorrect format of packet. For example, encapsulation of packet with many VLANs or IP options on the underlay can cause de-capsulation to result in a short packet.
Monitor Operations
After you deploy the network, the day-to-day tasks of monitoring the devices, protocols and services begin. The topics in this section provide instructions for monitoring:
Switches and hosts
Physical, data link, network, and application layer protocols and services
Overlay network protocols
Additionally, this section provides instructions for monitoring devices and the network using a topology view.
With the NetQ UI and CLI, a user can monitor the network inventory of switches and hosts, including such items as the number and type of operating systems installed. Additional details are available about the hardware and software components on individual switches, such as the motherboard, ASIC, microprocessor, disk, memory, fan and power supply information. The commands and cards available to obtain this type of information help you to answer questions such as:
What switches do I have in the network?
Are NetQ agents running on all of my switches?
How many transmit and receive packets have been dropped?
How healthy are the fans and power supply?
What software is installed on my switches?
What is the ACL and forwarding resources usage?
Monitor Switch Performance
With the NetQ UI and NetQ CLI, you can monitor the health of individual switches, including interface performance and resource utilization.
Three categories of performance metrics are available for switches:
System configuration: alarms, interfaces, IP and MAC addresses, VLANs, IP routes, IP neighbors, and installed software packages
Utilization statistics: CPU, memory, disk, ACL and forwarding resources, SSD, and BTRFS
Physical sensing: digital optics and chassis sensors
For information about the health of network services and protocols (BGP, EVPN, NTP, and so forth) running on switches, refer to the relevant layer monitoring topic.
For switch inventory information for all switches (ASIC, platform, CPU, memory, disk, and OS), refer to Monitor Switch Inventory.
View Overall Health
The NetQ UI provides several views that enable users to easily track the overall health of switch, some high-level metrics, and attributes of the switch.
View Overall Health of a Switch
When you want to view an overview of the current or past health of a particular switch, open the NetQ UI small Switch card. It is unlikely that you would have this card open for every switch in your network at the same time, but it is useful for tracking selected switches that might have been problematic in the recent past or that you have recently installed. The card shows you alarm status, a summary health score, and health trend.
To view the summary:
Click (Switches), then click Open a switch card.
Begin typing the hostname of the switch you are interested in. Select it from the suggested matches when it appears.
Select Small from the card size dropdown.
Click Add.
This example shows the leaf01 switch has had very few alarms overall, but the number is trending upward, with a total count of 24 alarms currently.
View High-Level Health Metrics
When you are monitoring switches that have been problematic or are newly installed, you might want to view more than a summary. Instead, seeing key performance metrics can help you determine where issues might be occurring or how new devices are functioning in the network.
To view the key metrics, use the NetQ UI to open the medium Switch card. The card shows you the overall switch health score and the scores for the key metrics that comprise that score. The key metric scores are based on the number of alarms attributed to the following activities on the switch:
Network services, such as BGP, EVPN, MLAG, NTP, and so forth
Interface performance
System performance
Locate or open the relevant Switch card:
Click (Switches), then click Open a switch card.
Begin typing the hostname of the device you are interested in. Select it from the suggested matches when it appears.
Click Add.
Also included on the card is the total alarm count for all of these metrics. You can view the key performance metrics as numerical scores or as line charts over time, by clicking Alarms or Charts at the top of the card.
View Switch Attributes
For a quick look at the key attributes of a particular switch, open the large Switch card.
Locate or open the relevant Switch card:
Hover over the card, then change to the large card using the card size picker.
OR
Click (Switches), then click Open a switch card.
Begin typing the hostname of the device you are interested in. Select it from the suggested matches when it appears.
Select Large from the card size dropdown.
Click Add.
Attributes are displayed as the default tab on the large Switch card. You can view the static information about the switch, including its hostname, addresses, server and ASIC vendors and models, OS and NetQ software information. You can also view the state of the interfaces and NetQ Agent on the switch.
From a performance perspective, this example shows that five interfaces are down and the NetQ Agent is communicating with the NetQ appliance or VM. Investigate the interfaces (refer to interface statistics).
System Configuration
At some point in the lifecycle of a switch, you are likely to want more detail about how the switch is configured and what software is running on it. The NetQ UI and the NetQ CLI can provide this information.
View All Switch Alarms
You can focus on all critical alarms for a given switch using the NetQ UI or NetQ CLI.
To view all alarms:
Open the full-screen Switch card and click Alarms.
Use the filter to sort by message type.
Use the filter to look at alarms during a different time range.
Return to your workbench by clicking in the top right corner.
To view all critical alarms on the switch, run:
netq <hostname> show events level critical [between <text-time> and <text-endtime>] [json]
This example shows the critical alarms on spine01 in the last two months.
cumulus@switch:~$ netq spine01 show events level critical between now and 60d
Matching events records:
Hostname Message Type Severity Message Timestamp
----------------- ------------------------ ---------------- ----------------------------------- -------------------------
spine01 agent critical Netq-agent rebooted at (Mon Aug 10 Mon Aug 10 19:55:19 2020
19:55:07 UTC 2020)
View Status of All Interfaces
You can view all configured interfaces on a switch in one place making it easier to see inconsistencies in the configuration, quickly see when changes occurred, and the operational status.
To view all interfaces:
Open the full-screen Switch card and click All Interfaces.
Look for interfaces that are down, shown in the State column.
Look for recent changes to the interfaces, shown in the Last Changed column.
View details about each interface, shown in the Details column.
Verify they are of the correct kind for their intended function, shown in the Type column.
Verify the correct VRF interface is assigned to an interface, shown in the VRF column.
To return to the workbench, click in the top right corner.
You can view all interfaces or filter by the interface type.
You can view all MAC address currently used by a switch using the NetQ UI or the NetQ CLI.
Open the full-screen switch card for the switch of interest.
Review the addresses.
Optionally, click to filter by MAC address, VLAN, origin, or alternate time range.
You can view all MAC addresses on a switch, or filter the list to view a particular address, only the addresses on the egress port, a particular VLAN, or those that are owned by the switch. You can also view the number addresses.
Use the following commands to obtain this MAC address information:
This example shows all MAC addresses on the leaf01 switch:
cumulus@switch:~$ netq leaf01 show macs
Matching mac records:
Origin MAC Address VLAN Hostname Egress Port Remote Last Changed
------ ------------------ ------ ----------------- ------------------------------ ------ -------------------------
yes 00:00:00:00:00:1a 10 leaf01 bridge no Wed Sep 16 16:16:09 2020
no 44:38:39:00:00:5d 30 leaf01 vni30030:leaf03 yes Wed Sep 16 16:16:09 2020
no 46:38:39:00:00:46 20 leaf01 vni30020:leaf03 yes Wed Sep 16 16:16:09 2020
no 44:38:39:00:00:5e 20 leaf01 vni30020:leaf03 yes Wed Sep 16 16:16:09 2020
yes 44:38:39:00:00:59 30 leaf01 bridge no Wed Sep 16 16:16:09 2020
yes 44:38:39:00:00:59 4001 leaf01 bridge no Wed Sep 16 16:16:09 2020
yes 44:38:39:00:00:59 4002 leaf01 bridge no Wed Sep 16 16:16:09 2020
no 44:38:39:00:00:36 30 leaf01 {bond3}:{server03} no Wed Sep 16 16:16:09 2020
yes 44:38:39:00:00:59 20 leaf01 bridge no Wed Sep 16 16:16:09 2020
yes 44:38:39:be:ef:aa 4001 leaf01 bridge no Wed Sep 16 16:16:09 2020
yes 44:38:39:00:00:59 10 leaf01 bridge no Wed Sep 16 16:16:09 2020
no 46:38:39:00:00:48 30 leaf01 vni30030:leaf03 yes Wed Sep 16 16:16:09 2020
yes 44:38:39:be:ef:aa 4002 leaf01 bridge no Wed Sep 16 16:16:09 2020
no 46:38:39:00:00:38 10 leaf01 {bond1}:{server01} no Wed Sep 16 16:16:09 2020
no 46:38:39:00:00:36 30 leaf01 {bond3}:{server03} no Wed Sep 16 16:16:09 2020
no 44:38:39:00:00:34 20 leaf01 {bond2}:{server02} no Wed Sep 16 16:16:09 2020
no 44:38:39:00:00:5e 30 leaf01 vni30030:leaf03 yes Wed Sep 16 16:16:09 2020
no 44:38:39:00:00:3e 10 leaf01 vni30010:leaf03 yes Wed Sep 16 16:16:09 2020
no 44:38:39:00:00:42 30 leaf01 vni30030:leaf03 yes Wed Sep 16 16:16:09 2020
no 46:38:39:00:00:34 20 leaf01 {bond2}:{server02} no Wed Sep 16 16:16:09 2020
no 46:38:39:00:00:3c 30 leaf01 {bond3}:{server03} no Wed Sep 16 16:16:09 2020
no 46:38:39:00:00:3e 10 leaf01 vni30010:leaf03 yes Wed Sep 16 16:16:09 2020
no 44:38:39:00:00:5e 10 leaf01 vni30010:leaf03 yes Wed Sep 16 16:16:09 2020
no 44:38:39:00:00:5d 20 leaf01 vni30020:leaf03 yes Wed Sep 16 16:16:09 2020
no 44:38:39:00:00:5d 10 leaf01 vni30010:leaf03 yes Wed Sep 16 16:16:09 2020
yes 00:00:00:00:00:1b 20 leaf01 bridge no Wed Sep 16 16:16:09 2020
...
This example shows all MAC addresses on VLAN 10 on the leaf01 switch:
cumulus@switch:~$ netq leaf01 show macs
Matching mac records:
Origin MAC Address VLAN Hostname Egress Port Remote Last Changed
------ ------------------ ------ ----------------- ------------------------------ ------ -------------------------
yes 00:00:00:00:00:1a 10 leaf01 bridge no Wed Sep 16 16:16:09 2020
yes 44:38:39:00:00:59 10 leaf01 bridge no Wed Sep 16 16:16:09 2020
no 46:38:39:00:00:38 10 leaf01 {bond1}:{server01} no Wed Sep 16 16:16:09 2020
no 44:38:39:00:00:3e 10 leaf01 vni30010:leaf03 yes Wed Sep 16 16:16:09 2020
no 46:38:39:00:00:3e 10 leaf01 vni30010:leaf03 yes Wed Sep 16 16:16:09 2020
no 44:38:39:00:00:5e 10 leaf01 vni30010:leaf03 yes Wed Sep 16 16:16:09 2020
no 44:38:39:00:00:5d 10 leaf01 vni30010:leaf03 yes Wed Sep 16 16:16:09 2020
no 44:38:39:00:00:32 10 leaf01 {bond1}:{server01} no Wed Sep 16 16:16:09 2020
no 46:38:39:00:00:44 10 leaf01 vni30010:leaf03 yes Wed Sep 16 16:16:09 2020
no 46:38:39:00:00:32 10 leaf01 {bond1}:{server01} no Wed Sep 16 16:16:09 2020
no 44:38:39:00:00:5a 10 leaf01 {peerlink}:{leaf02} no Wed Sep 16 16:16:09 2020
no 44:38:39:00:00:62 10 leaf01 vni30010:border01 yes Wed Sep 16 16:16:09 2020
no 44:38:39:00:00:61 10 leaf01 vni30010:border01 yes Wed Sep 16 16:16:09 2020
This example shows the total number of MAC address on the leaf01 switch:
cumulus@switch:~$ netq leaf01 show macs count
Count of matching mac records: 55
This example show the addresses on the bridge egress port on the leaf01 switch:
cumulus@switch:~$ netq leaf01 show macs egress-port bridge
Matching mac records:
Origin MAC Address VLAN Hostname Egress Port Remote Last Changed
------ ------------------ ------ ----------------- ------------------------------ ------ -------------------------
yes 00:00:00:00:00:1a 10 leaf01 bridge no Thu Sep 17 16:16:11 2020
yes 44:38:39:00:00:59 4001 leaf01 bridge no Thu Sep 17 16:16:11 2020
yes 44:38:39:00:00:59 30 leaf01 bridge no Thu Sep 17 16:16:11 2020
yes 44:38:39:00:00:59 20 leaf01 bridge no Thu Sep 17 16:16:11 2020
yes 44:38:39:00:00:59 4002 leaf01 bridge no Thu Sep 17 16:16:11 2020
yes 44:38:39:00:00:59 10 leaf01 bridge no Thu Sep 17 16:16:11 2020
yes 44:38:39:be:ef:aa 4001 leaf01 bridge no Thu Sep 17 16:16:11 2020
yes 44:38:39:be:ef:aa 4002 leaf01 bridge no Thu Sep 17 16:16:11 2020
yes 00:00:00:00:00:1b 20 leaf01 bridge no Thu Sep 17 16:16:11 2020
yes 00:00:00:00:00:1c 30 leaf01 bridge no Thu Sep 17 16:16:11 2020
View All VLANs on a Switch
You can view all VLANs running on a given switch using the NetQ UI or NetQ CLI.
To view all VLANs on a switch:
Open the full-screen Switch card and click VLANs.
Review the VLANs.
Optionally, click to filter by interface name or type.
To view all VLANs on a switch, run:
netq <hostname> show interfaces type vlan [state <remote-interface-state>] [around <text-time>] [count] [json]
Filter the output for VLANs with state option to view VLANs that are up or down, the around option to view VLAN information for a time in the past, or the count option to view the total number of VLANs on the device.
This example show all VLANs on the leaf01 switch:
cumulus@switch:~$ netq leaf01 show interfaces type vlan
Matching link records:
Hostname Interface Type State VRF Details Last Changed
----------------- ------------------------- ---------------- ---------- --------------- ----------------------------------- -------------------------
leaf01 vlan20 vlan up RED MTU: 9216 Thu Sep 17 16:16:11 2020
leaf01 vlan4002 vlan up BLUE MTU: 9216 Thu Sep 17 16:16:11 2020
leaf01 vlan4001 vlan up RED MTU: 9216 Thu Sep 17 16:16:11 2020
leaf01 vlan30 vlan up BLUE MTU: 9216 Thu Sep 17 16:16:11 2020
leaf01 vlan10 vlan up RED MTU: 9216 Thu Sep 17 16:16:11 2020
leaf01 peerlink.4094 vlan up default MTU: 9216 Thu Sep 17 16:16:11 2020
This example shows the total number of VLANs on the leaf01 switch:
cumulus@switch:~$ netq leaf01 show interfaces type vlan count
Count of matching link records: 6
This example shows the VLANs on the leaf01 switch that are down:
cumulus@switch:~$ netq leaf01 show interfaces type vlan state down
No matching link records found
View All IP Routes on a Switch
You can view all IP routes currently used by a switch using the NetQ UI or the NetQ CLI.
To view all IP routes on a switch:
Open the full-screen Switch card and click IP Routes.
By default all IP routes are listed. Click IPv6 or IPv4 to restrict the list to only those routes.
Optionally, click to filter by VRF or view a different time period.
To view all IPv4 and IPv6 routes or only IPv4 routes on a switch, run:
netq show ip routes [<ipv4>|<ipv4/prefixlen>] [vrf <vrf>] [origin] [around <text-time>] [json]
Optionally, filter the output with the following options:
ipv4 or ipv4/prefixlen to view a particular IPv4 route on the switch
vrf to view routes using a given VRF
origin to view routes that the switch owns
around to view routes at a time in the past
This example shows all IP routes for the spine01 switch:
This example shows information for the IPv4 route at 10.10.10.1 on the spine01 switch:
cumulus@switch:~$ netq spine01 show ip routes 10.10.10.1
Matching routes records:
Origin VRF Prefix Hostname Nexthops Last Changed
------ --------------- ------------------------------ ----------------- ----------------------------------- -------------------------
no default 10.10.10.1/32 spine01 169.254.0.1: swp1, Wed Sep 16 19:57:26 2020
169.254.0.1: swp2
View All IP Neighbors on a Switch
You can view all IP neighbors currently known by a switch using the NetQ UI or the NetQ CLI.
To view all IP neighbors on a switch:
Open the full-screen Switch card and click IP Neighbors.
By default all IP routes are listed. Click IPv6 or IPv4 to restrict the list to only those routes.
Optionally, click to filter by VRF or view a different time period.
To view all IP neighbors on a switch, run:
netq <hostname> show ip neighbors [<remote-interface>] [<ipv4>|<ipv4> vrf <vrf>|vrf <vrf>] [<mac>] [around <text-time>] [count] [json]
Optionally, filter the output with the following options:
ipv4, ipv4 vrf, orvrf to view the neighbor with a given IPv4 address, the neighbor with a given IPv4 address and VRF, or all neighbors using a given VRF on the switch
mac to view the neighbor with a given MAC address
count to view the total number of known IP neighbors
around to view neighbors at a time in the past
This example shows all IP neighbors for the leaf02 switch:
cumulus@switch:~$ netq leaf02 show ip neighbors
Matching neighbor records:
IP Address Hostname Interface MAC Address VRF Remote Last Changed
------------------------- ----------------- ------------------------- ------------------ --------------- ------ -------------------------
10.1.10.2 leaf02 vlan10 44:38:39:00:00:59 RED no Thu Sep 17 20:25:14 2020
169.254.0.1 leaf02 swp54 44:38:39:00:00:0f default no Thu Sep 17 20:25:16 2020
192.168.200.1 leaf02 eth0 44:38:39:00:00:6d mgmt no Thu Sep 17 20:07:59 2020
169.254.0.1 leaf02 peerlink.4094 44:38:39:00:00:59 default no Thu Sep 17 20:25:16 2020
169.254.0.1 leaf02 swp53 44:38:39:00:00:0d default no Thu Sep 17 20:25:16 2020
10.1.20.2 leaf02 vlan20 44:38:39:00:00:59 RED no Thu Sep 17 20:25:14 2020
169.254.0.1 leaf02 swp52 44:38:39:00:00:0b default no Thu Sep 17 20:25:16 2020
10.1.30.2 leaf02 vlan30 44:38:39:00:00:59 BLUE no Thu Sep 17 20:25:14 2020
169.254.0.1 leaf02 swp51 44:38:39:00:00:09 default no Thu Sep 17 20:25:16 2020
192.168.200.250 leaf02 eth0 44:38:39:00:01:80 mgmt no Thu Sep 17 20:07:59 2020
This example shows the neighbor with a MAC address of 44:38:39:00:00:0b on the leaf02 switch:
cumulus@switch:~$ netq leaf02 show ip neighbors 44:38:39:00:00:0b
Matching neighbor records:
IP Address Hostname Interface MAC Address VRF Remote Last Changed
------------------------- ----------------- ------------------------- ------------------ --------------- ------ -------------------------
169.254.0.1 leaf02 swp52 44:38:39:00:00:0b default no Thu Sep 17 20:25:16 2020
This example shows the neighbor with an IP address of 10.1.10.2 on the leaf02 switch:
cumulus@switch:~$ netq leaf02 show ip neighbors 10.1.10.2
Matching neighbor records:
IP Address Hostname Interface MAC Address VRF Remote Last Changed
------------------------- ----------------- ------------------------- ------------------ --------------- ------ -------------------------
10.1.10.2 leaf02 vlan10 44:38:39:00:00:59 RED no Thu Sep 17 20:25:14 2020
View All IP Addresses on a Switch
You can view all IP addresses currently known by a switch using the NetQ UI or the NetQ CLI.
To view all IP addresses on a switch:
Open the full-screen Switch card and click IP Addresses.
By default all IP addresses are listed. Click IPv6 or IPv4 to restrict the list to only those addresses.
Optionally, click to filter by interface or VRF, or view a different time period.
To view all IP addresses on a switch, run:
netq <hostname> show ip addresses [<remote-interface>] [<ipv4>|<ipv4/prefixlen>] [vrf <vrf>] [around <text-time>] [count] [json]
Optionally, filter the output with the following options:
ipv4 or ipv4/prefixlen to view a particular IPv4 address on the switch
vrf to view addresses using a given VRF
count to view the total number of known IP neighbors
around to view addresses at a time in the past
This example shows all IP address on the spine01 switch:
cumulus@switch:~$ netq spine01 show ip addresses
Matching address records:
Address Hostname Interface VRF Last Changed
------------------------- ----------------- ------------------------- --------------- -------------------------
192.168.200.21/24 spine01 eth0 mgmt Thu Sep 17 20:07:49 2020
10.10.10.101/32 spine01 lo default Thu Sep 17 20:25:05 2020
This example shows all IP addresses on the leaf03 switch:
cumulus@switch:~$ netq leaf03 show ip addresses
Matching address records:
Address Hostname Interface VRF Last Changed
------------------------- ----------------- ------------------------- --------------- -------------------------
10.1.20.2/24 leaf03 vlan20 RED Thu Sep 17 20:25:08 2020
10.1.10.1/24 leaf03 vlan10-v0 RED Thu Sep 17 20:25:08 2020
192.168.200.13/24 leaf03 eth0 mgmt Thu Sep 17 20:08:11 2020
10.1.20.1/24 leaf03 vlan20-v0 RED Thu Sep 17 20:25:09 2020
10.0.1.2/32 leaf03 lo default Thu Sep 17 20:28:12 2020
10.1.30.1/24 leaf03 vlan30-v0 BLUE Thu Sep 17 20:25:09 2020
10.1.10.2/24 leaf03 vlan10 RED Thu Sep 17 20:25:08 2020
10.10.10.3/32 leaf03 lo default Thu Sep 17 20:25:05 2020
10.1.30.2/24 leaf03 vlan30 BLUE Thu Sep 17 20:25:08 2020
This example shows all IP addresses using the BLUE VRF on the leaf03 switch:
cumulus@switch:~$ netq leaf03 show ip addresses vrf BLUE
Matching address records:
Address Hostname Interface VRF Last Changed
------------------------- ----------------- ------------------------- --------------- -------------------------
10.1.30.1/24 leaf03 vlan30-v0 BLUE Thu Sep 17 20:25:09 2020
10.1.30.2/24 leaf03 vlan30 BLUE Thu Sep 17 20:25:08 2020
View All Software Packages
If you are having an issue with a particular switch, you might want to verify all installed software and whether it needs updating.
You can view all the software installed on a given switch using the NetQ UI or NetQ CLI to quickly validate versions and total software installed.
To view all software packages:
Open the full-screen Switch card and click Installed Packages.
Look for packages of interest and their version and status. Sort by a particular parameter by clicking .
Optionally, export the list by selecting all or specific packages, then clicking .
To view package information for a switch, run:
netq <hostname> show cl-pkg-info [<text-package-name>] [around <text-time>] [json]
Use the text-package-name option to narrow the results to a particular package or the around option to narrow the output to a particular time range.
This example shows all installed software packages for spine01.
cumulus@switch:~$ netq spine01 show cl-pkg-info
Matching package_info records:
Hostname Package Name Version CL Version Package Status Last Changed
----------------- ------------------------ -------------------- ----------- -------------------- -------------------------
spine01 libxpm4 1:3.5.12-1 Cumulus Lin installed Tue May 25 16:01:24 2021
ux 4.3.0
spine01 libgdbm6 1.18.1-4 Cumulus Lin installed Tue May 25 16:01:24 2021
ux 4.3.0
spine01 multiarch-support 2.28-10 Cumulus Lin installed Tue May 25 16:01:24 2021
ux 4.3.0
spine01 diffutils 1:3.7-3 Cumulus Lin installed Tue May 25 16:01:24 2021
ux 4.3.0
spine01 adduser 3.118 Cumulus Lin installed Tue May 25 16:01:24 2021
ux 4.3.0
spine01 python-pkg-resources 40.8.0-1 Cumulus Lin installed Tue May 25 16:01:24 2021
ux 4.3.0
spine01 libtiff5 4.1.0+git191117-2~de Cumulus Lin installed Tue May 25 16:01:24 2021
b10u1 ux 4.3.0
spine01 make 4.2.1-1.2 Cumulus Lin installed Tue May 25 16:01:24 2021
ux 4.3.0
spine01 libpcre3 2:8.39-12 Cumulus Lin installed Tue May 25 16:01:24 2021
ux 4.3.0
spine01 cumulus-hyperconverged 0.1-cl4u3 Cumulus Lin installed Tue May 25 16:01:24 2021
ux 4.3.0
spine01 python3-urllib3 1.24.1-1 Cumulus Lin installed Tue May 25 16:01:24 2021
ux 4.3.0
spine01 python-markupsafe 1.1.0-1 Cumulus Lin installed Tue May 25 16:01:24 2021
ux 4.3.0
spine01 libusb-0.1-4 2:0.1.12-32 Cumulus Lin installed Tue May 25 16:01:24 2021
ux 4.3.0
spine01 cron 3.0pl1-133-cl4u1 Cumulus Lin installed Tue May 25 16:01:24 2021
ux 4.3.0
spine01 libsasl2-modules-db 2.1.27+dfsg-1+deb10u Cumulus Lin installed Tue May 25 16:01:24 2021
1 ux 4.3.0
...
This example shows the ntp package on the spine01 switch.
cumulus@switch:~$ netq spine01 show cl-pkg-info ntp
Matching package_info records:
Hostname Package Name Version CL Version Package Status Last Changed
----------------- ------------------------ -------------------- -------------------- -------------------- -------------------------
spine01 ntp 1:4.2.8p10-cl3u2 Cumulus Linux 3.7.12 installed Wed Aug 26 19:58:45 2020
Utilization Statistics
Utilization statistics provide a view into the operation of a switch. They indicate whether resources are becoming dangerously close to their maximum capacity or a user-defined threshold. Depending on the function of the switch, the acceptable thresholds can vary. You can use the NetQ UI or the NetQ CLI to access the utilization statistics.
View Compute Resources Utilization
You can view the current utilization of CPU, memory, and disk resources to determine whether a switch is reaching its maximum load and compare its performance with other switches.
To view the compute resources utilization:
Open the large Switch card.
Hover over the card and click .
The card is divided into two sections, displaying hardware-related performance through a series of charts.
Look at the hardware performance charts.
Are there any that are reaching critical usage levels? Is usage high at a particular time of day?
Change the time period. Is the performance about the same? Better? Worse? The results can guide your decisions about upgrade options.
Open the large Switch card for a comparable switch. Is the performance similar?
You can quickly determine how many compute resources — CPU, disk and memory — the switches on your network consume.
To obtain this information, run the relevant command:
netq <hostname> show resource-util [cpu | memory] [around <text-time>] [json]
netq <hostname> show resource-util disk [<text-diskname>] [around <text-time>] [json]
When no options are included the output shows the percentage of CPU and memory being consumed as well as the amount and percentage of disk space being consumed. You can use the around option to view the information for a particular time.
This example shows the CPU, memory, and disk utilization for the leaf01 switch.
cumulus@switch:~$ netq leaf01 show resource-util
Matching resource_util records:
Hostname CPU Utilization Memory Utilization Disk Name Total Used Disk Utilization Last Updated
----------------- -------------------- -------------------- -------------------- -------------------- -------------------- -------------------- ------------------------
leaf01 4.5 72.1 /dev/vda4 6170849280 1230303232 20.9 Wed Sep 16 20:35:57 2020
This example shows only the CPU utilization for the leaf01 switch.
cumulus@switch:~$ netq leaf01 show resource-util cpu
Matching resource_util records:
Hostname CPU Utilization Last Updated
----------------- -------------------- ------------------------
leaf01 4.2 Wed Sep 16 20:52:12 2020
This example shows only the memory utilization for the leaf01 switch.
This example shows only the disk utilization for the leaf01 switch. If you have more than one disk in your switch, the output displays utilization data for all disks. If you want to view the data for only one of the disks, you must specify a disk name.
cumulus@switch:~$ netq leaf01 show resource-util disk
Matching resource_util records:
Hostname Disk Name Total Used Disk Utilization Last Updated
----------------- -------------------- -------------------- -------------------- -------------------- ------------------------
leaf01 /dev/vda4 6170849280 1230393344 20.9 Wed Sep 16 20:54:14 2020
View Interface Statistics and Utilization
NetQ Agents collect performance statistics every 30 seconds for the physical interfaces on switches in your network. The NetQ Agent does not collect statistics for non-physical interfaces, such as bonds, bridges, and VXLANs. The NetQ Agent collects the following statistics:
You can view these statistics and utilization data using the NetQ UI or the NetQ CLI.
Locate the switch card of interest on your workbench and change to the large size card if needed. Otherwise, open the relevant switch card:
Click (Switches), and then select Open a switch card.
Begin typing the name of the switch of interest, and select when it appears in the suggestions list.
Select the Large card size.
Click Add.
Hover over the card and click to open the Interface Stats tab.
Select an interface from the list, scrolling down until you find it. By default the interfaces are sorted by Name, but you might find it easier to sort by the highest transmit or receive utilization using the filter above the list.
The charts update according to your selection. Scroll up and down to view the individual statistics. Look for high usage, a large number of drops or errors.
What you view next depends on what you see, but a couple of possibilities include:
Open the full screen card to view details about all of the interfaces on the switch.
Open another switch card to compare performance on a similar interface.
To view the interface statistics and utilization, run:
netq <hostname> show interface-stats [errors | all] [<physical-port>] [around <text-time>] [json]
netq <hostname> show interface-utilization [<text-port>] [tx|rx] [around <text-time>] [json]
Where the various options are:
hostname limits the output to a particular switch
errors limits the output to only the transmit and receive errors found on the designated interfaces
physical-port limits the output to a particular port
around enables viewing of the data at a time in the past
json outputs results in JSON format
text-port limits output to a particular host and port; this option requires a hostname
tx, rx limits output to the transmit or receive values, respectively
This example shows the interface statistics for the leaf01 switch for all its physical interfaces.
You can monitor the incoming and outgoing access control lists (ACLs) configured on a switch. This ACL resource information is available from the NetQ UI and NetQ CLI.
Both the Switch card and netq show cl-resource acl command display the ingress/egress IPv4/IPv6 filter/mangle, ingress 802.1x filter, ingress mirror, ingress/egress PBR IPv4/IPv6 filter/mangle, ACL Regions, 18B/32B/54B Rules Key, and layer 4 port range checker.
To view ACL resource utilization on a switch:
Open the Switch card for a switch by searching in the Global Search field.
Hover over the card and change to the full-screen card using the size picker.
Click ACL Resources.
To return to your workbench, click in the top right corner of the card.
To view ACL resource utilization on a switch, run:
For NetQ Appliances that have 3ME3 solid state drives (SSDs) installed (primarily in on-premises deployments), you can view the utilization of the drive on-demand. NetQ generates an alarm for drives that drop below 10% health, or have more than a two percent loss of health in 24 hours, indicating the need to rebalance the drive. Tracking SSD utilization over time enables you to see any downward trend or instability of the drive before you receive an alarm.
To view SSD utilization:
Open the full screen Switch card and click SSD Utilization.
View the average PE Cycles value for a given drive. Is it higher than usual?
View the Health value for a given drive. Is it lower than usual? Less than 10%?
Consider adding the switch cards that are suspect to a workbench for easy tracking.
To view SDD utilization, run:
netq <hostname> show cl-ssd-util [around <text-time>] [json]
This example shows the utilization for spine02 which has this type of SSD.
cumulus@switch:~$ netq spine02 show cl-ssd-util
Hostname Remaining PE Cycle (%) Current PE Cycles executed Total PE Cycles supported SSD Model Last Changed
spine02 80 576 2880 M.2 (S42) 3ME3 Thu Oct 31 00:15:06 2019
This output indicates that this drive is in a good state overall with 80% of its PE cycles remaining. Use the around option to view this information around a particular time in the past.
View Disk Storage After BTRFS Allocation
Customers running Cumulus Linux 3.x which uses the BTRFS (b-tree file system) might experience issues with disk space management. This is a known problem of BTRFS because it does not perform periodic garbage collection, or rebalancing. If left unattended, these errors can make it impossible to rebalance the partitions on the disk. To avoid this issue, NVIDIA recommends rebalancing the BTRFS partitions in a preemptive manner, but only when absolutely needed to avoid reduction in the lifetime of the disk. By tracking the state of the disk space usage, users can determine when they should rebalance.
Open the full-screen Switch card for a switch of interest:
Type the switch name in the Global Search entry field, then use the card size picker to open the full-screen card, or
Click (Switches), select Open a switch card, enter the switch name and select the full-screen card size.
Click BTRFS Utilization.
Look for the Rebalance Recommended column.
If the value in that column says Yes, then you are strongly encouraged to rebalance the BTRFS partitions. If it says No, then you can review the other values in the table to determine if you are getting close to needing a rebalance, and come back to view this table at a later time.
To view the disk utilization and whether a rebalance is recommended, run:
netq show cl-btrfs-util [around <text-time>] [json]
This example shows the utilization on the leaf01 switch:
cumulus@switch:~$ netq leaf01 show cl-btrfs-info
Matching btrfs_info records:
Hostname Device Allocated Unallocated Space Largest Chunk Size Unused Data Chunks S Rebalance Recommende Last Changed
pace d
----------------- -------------------- -------------------- -------------------- -------------------- -------------------- -------------------------
leaf01 37.79 % 3.58 GB 588.5 MB 771.91 MB yes Wed Sep 16 21:25:17 2020
Look for the Rebalance Recommended column. If the value in that column says Yes, then you are strongly encouraged to rebalance the BTRFS partitions. If it says No, then you can review the other values in the output to determine if you are getting close to needing a rebalance, and come back to view this data at a later time.
Optionally, use the around option to view the information for a particular time in the past.
Physical Sensing
Physical sensing features provide a view into the health of the switch chassis, including:
Power supply units (PSUs)
Fans
Digital optics modules
Temperature in various locations
View Chassis Health with Sensors
Fan, power supply unit (PSU), and temperature sensors are available to provide additional data about the switch operation.
Sensor information is available from the NetQ UI and NetQ CLI.
PSU Sensor card: view sensor name, current/previous state, input/output power, and input/output voltage on all devices (table)
Fan Sensor card: view sensor name, description, current/maximum/minimum speed, and current/previous state on all devices (table)
Temperature Sensor card: view sensor name, description, minimum/maximum threshold, current/critical(maximum)/lower critical (minimum) threshold, and current/previous state on all devices (table)
netq show sensors: view sensor name, description, current state, and time when data was last changed on all devices for all or one sensor type
Power Supply Unit Health
Click (main menu), then click Sensors in the Network heading.
The PSU tab is displayed by default.
Click to quickly locate a switch that does not appear on the first page of the switch list.
Enter a hostname in the Hostname field.
PSU Parameter
Description
Hostname
Name of the switch or host where the power supply is installed
Timestamp
Date and time the data was captured
Message Type
Type of sensor message; always PSU in this table
PIn(W)
Input power (Watts) for the PSU on the switch or host
POut(W)
Output power (Watts) for the PSU on the switch or host
Sensor Name
User-defined name for the PSU
Previous State
State of the PSU when data was captured in previous window
State
State of the PSU when data was last captured
VIn(V)
Input voltage (Volts) for the PSU on the switch or host
VOut(V)
Output voltage (Volts) for the PSU on the switch or host
To return to your workbench, click in the top right corner of the card.
Fan Health
Click (main menu), then click Sensors in the Network heading.
Click Fan.
Click to quickly locate a switch that does not appear on the first page of the switch list.
Enter a hostname in the Hostname field.
Fan Parameter
Description
Hostname
Name of the switch or host where the fan is installed
Timestamp
Date and time the data was captured
Message Type
Type of sensor message; always Fan in this table
Description
User specified description of the fan
Speed (RPM)
Revolution rate of the fan (revolutions per minute)
Max
Maximum speed (RPM)
Min
Minimum speed (RPM)
Message
Message
Sensor Name
User-defined name for the fan
Previous State
State of the fan when data was captured in previous window
State
State of the fan when data was last captured
To return to your workbench, click in the top right corner of the card.
Temperature Information
Click (main menu), then click Sensors in the Network heading.
Click Temperature.
Click to quickly locate a switch that does not appear on the first page of the switch list.
Enter a hostname in the Hostname field.
Temperature Parameter
Description
Hostname
Name of the switch or host where the temperature sensor is installed
Timestamp
Date and time the data was captured
Message Type
Type of sensor message; always Temp in this table
Critical
Current critical maximum temperature (°C) threshold setting
Description
User specified description of the temperature sensor
Lower Critical
Current critical minimum temperature (°C) threshold setting
Max
Maximum temperature threshold setting
Min
Minimum temperature threshold setting
Message
Message
Sensor Name
User-defined name for the temperature sensor
Previous State
State of the fan when data was captured in previous window
State
State of the fan when data was last captured
Temperature(Celsius)
Current temperature (°C) measured by sensor
To return to your workbench, click in the top right corner of the card.
View All Sensor Information for a Switch
To view information for power supplies, fans, and temperature sensors on a switch, run:
netq <hostname> show sensors all [around <text-time>] [json]
Use the around option to view sensor information for a time in the past.
This example show every sensor on the border01 switch.
cumulus@switch:~$ netq border01 show sensors all
Matching sensors records:
Hostname Name Description State Message Last Changed
----------------- --------------- ----------------------------------- ---------- ----------------------------------- -------------------------
border01 fan3 fan tray 2, fan 1 ok Wed Apr 22 17:07:56 2020
border01 fan1 fan tray 1, fan 1 ok Wed Apr 22 17:07:56 2020
border01 fan6 fan tray 3, fan 2 ok Wed Apr 22 17:07:56 2020
border01 fan5 fan tray 3, fan 1 ok Wed Apr 22 17:07:56 2020
border01 psu2fan1 psu2 fan ok Wed Apr 22 17:07:56 2020
border01 fan2 fan tray 1, fan 2 ok Wed Apr 22 17:07:56 2020
border01 fan4 fan tray 2, fan 2 ok Wed Apr 22 17:07:56 2020
border01 psu1fan1 psu1 fan ok Wed Apr 22 17:07:56 2020
View Only Power Supply Health
To view information from all PSU sensors or PSU sensors with a given name on a given switch, run:
netq <hostname> show sensors psu [<psu-name>] [around <text-time>] [json]
Use the psu-name option to view all PSU sensors with a particular name. Use the around option to view sensor information for a time in the past.
Use Tab completion to determine the names of the PSUs in your switches.
cumulus@switch:~$ netq <hostname> show sensors psu <press tab>
around : Go back in time to around ...
json : Provide output in JSON
psu1 : Power Supply
psu2 : Power Supply
<ENTER>
This example shows information from all PSU sensors on the border01 switch.
cumulus@switch:~$ netq border01 show sensor psu
Matching sensors records:
Hostname Name State Pin(W) Pout(W) Vin(V) Vout(V) Message Last Changed
----------------- --------------- ---------- ------------ -------------- ------------ -------------- ----------------------------------- -------------------------
border01 psu1 ok Tue Aug 25 21:45:21 2020
border01 psu2 ok Tue Aug 25
This example shows the state of psu2 on the leaf01 switch.
cumulus@switch:~$ netq leaf01 show sensors psu psu2
Matching sensors records:
Hostname Name State Message Last Changed
----------------- --------------- ---------- ----------------------------------- -------------------------
leaf01 psu2 ok Sun Apr 21 20:07:12 2019
View Only Fan Health
To view information from all fan sensors or fan sensors with a given name on your switch, run:
netq <hostname> show sensors fan [<fan-name>] [around <text-time>] [json]
Use the fan-name option to view all fan sensors with a particular name. Use the around option to view sensor information for a time in the past.
Use tab completion to determine the names of the fans in your switches:
cumulus@switch:~$ netq show sensors fan <<press tab>>
around : Go back in time to around ...
fan1 : Fan Name
fan2 : Fan Name
fan3 : Fan Name
fan4 : Fan Name
fan5 : Fan Name
fan6 : Fan Name
json : Provide output in JSON
psu1fan1 : Fan Name
psu2fan1 : Fan Name
<ENTER>
This example shows information from all fan sensors on the leaf01 switch.
cumulus@switch:~$ netq leaf01 show sensors fan
Matching sensors records:
Hostname Name Description State Speed Max Min Message Last Changed
----------------- --------------- ----------------------------------- ---------- ---------- -------- -------- ----------------------------------- -------------------------
leaf01 psu2fan1 psu2 fan ok 2500 29000 2500 Wed Aug 26 16:14:41 2020
leaf01 fan5 fan tray 3, fan 1 ok 2500 29000 2500 Wed Aug 26 16:14:41 2020
leaf01 fan3 fan tray 2, fan 1 ok 2500 29000 2500 Wed Aug 26 16:14:41 2020
leaf01 fan1 fan tray 1, fan 1 ok 2500 29000 2500 Wed Aug 26 16:14:41 2020
leaf01 fan6 fan tray 3, fan 2 ok 2500 29000 2500 Wed Aug 26 16:14:41 2020
leaf01 fan2 fan tray 1, fan 2 ok 2500 29000 2500 Wed Aug 26 16:14:41 2020
leaf01 psu1fan1 psu1 fan ok 2500 29000 2500 Wed Aug 26 16:14:41 2020
leaf01 fan4 fan tray 2, fan 2 ok 2500 29000 2500 Wed Aug 26 16:14:41 2020
This example shows the state of all fans with the name fan1 on the leaf02 switch.
cumulus@switch:~$ netq leaf02 show sensors fan fan1
Hostname Name Description State Speed Max Min Message Last Changed
----------------- --------------- ----------------------------------- ---------- ---------- -------- -------- ----------------------------------- -------------------------
leaf02 fan1 fan tray 1, fan 1 ok 2500 29000 2500 Fri Apr 19 16:01:41 2019
View Only Temperature Information
To view information from all temperature sensors or temperature sensors with a given name on a switch, run:
netq <hostname> show sensors temp [<temp-name>] [around <text-time>] [json]
Use the temp-name option to view all PSU sensors with a particular name. Use the around option to view sensor information for a time in the past.
Use tab completion to determine the names of the temperature sensors on your devices:
cumulus@switch:~$ netq show sensors temp <press tab>
around : Go back in time to around ...
json : Provide output in JSON
psu1temp1 : Temp Name
psu2temp1 : Temp Name
temp1 : Temp Name
temp2 : Temp Name
temp3 : Temp Name
temp4 : Temp Name
temp5 : Temp Name
<ENTER>
This example shows the state of all temperature sensors on the leaf01 switch.
cumulus@switch:~$ netq leaf01 show sensors temp
Matching sensors records:
Hostname Name Description State Temp Critical Max Min Message Last Changed
----------------- --------------- ----------------------------------- ---------- -------- -------- -------- -------- ----------------------------------- -------------------------
leaf01 psu1temp1 psu1 temp sensor ok 25 85 80 5 Wed Aug 26 16:14:41 2020
leaf01 temp5 board sensor near fan ok 25 85 80 5 Wed Aug 26 16:14:41 2020
leaf01 temp4 board sensor at front right corner ok 25 85 80 5 Wed Aug 26 16:14:41 2020
leaf01 temp1 board sensor near cpu ok 25 85 80 5 Wed Aug 26 16:14:41 2020
leaf01 temp2 board sensor near virtual switch ok 25 85 80 5 Wed Aug 26 16:14:41 2020
leaf01 temp3 board sensor at front left corner ok 25 85 80 5 Wed Aug 26 16:14:41 2020
leaf01 psu2temp1 psu2 temp sensor ok 25 85 80 5 Wed Aug 26 16:14:41 2020
This example shows the state of the psu1temp1 temperature sensor on the leaf01 switch.
the name .
cumulus@switch:~$ netq leaf01 show sensors temp psu2temp1
Matching sensors records:
Hostname Name Description State Temp Critical Max Min Message Last Changed
----------------- --------------- ----------------------------------- ---------- -------- -------- -------- -------- ----------------------------------- -------------------------
leaf01 psu2temp1 psu2 temp sensor ok 25 85 80 5 Wed Aug 26 16:14:41 2020
View Digital Optics Health
Digital optics module information is available regarding the performance degradation or complete outage of any digital optics modules on a switch using the NetQ UI and NetQ CLI.
Switch card:
Large: view trends of laser bias current, laser output power, received signal average optical power, and module temperature/voltage for given interface (graphics)
Full screen: view laser bias current, laser output power, received signal average optical power, and module temperature/voltage (table)
Digital Optics card: view laser bias current, laser output power, received signal average optical power, and module temperature/voltage (table)
netq show dom type command: view laser bias current, laser output power, received signal average optical power, and module temperature/voltage
Open a switch card by searching for a switch by hostname in Global Search.
Hover over the card and change to the large card using the card size picker.
Hover over card and click .
Select the interface of interest.
Click the interface name if visible in the list on the left, scroll down the list to find it, or search for interface.
Choose the digital optical monitoring (DOM) parameter of interest from the dropdown. The card updates according to your selections.
Choose alternate interfaces and DOM parameters to view other charts.
Hover over the card and change to the full-screen card using the card size picker.
Click Digital Optics.
Click the DOM parameter at the top.
Review the laser parameter values by interface and channel. Review the module parameters by interface.
Click (main menu), then click Digital Optics in the Network heading.
The Laser Rx Power tab is displayed by default.
Click to quickly locate a switch that does not appear on the first page of the switch list.
Enter the hostname of the switch you want to view, and optionally an interface, then click Apply.
Click another tab to view other optical parameters for a switch. Filter for the switch on each tab.
Laser Parameter
Description
Hostname
Name of the switch or host where the digital optics module resides
Timestamp
Date and time the data was captured
If Name
Name of interface where the digital optics module is installed
Units
Measurement unit for the power (mW) or current (mA)
Channel 1–8
Value of the power or current on each channel where the digital optics module is transmitting
Module Parameter
Description
Hostname
Name of the switch or host where the digital optics module resides
Timestamp
Date and time the data was captured
If Name
Name of interface where the digital optics module is installed
Degree C
Current module temperature, measured in degrees Celsius
Degree F
Current module temperature, measured in degrees Fahrenheit
Units
Measurement unit for module voltage; Volts
Value
Current module voltage
To return to your workbench, click in the top right corner of the card.
To view digital optics information for a switch, run one of the following:
netq <hostname> show dom type (laser_rx_power|laser_output_power|laser_bias_current) [interface <text-dom-port-anchor>] [channel_id <text-channel-id>] [around <text-time>] [json]
netq <hostname> show dom type (module_temperature|module_voltage) [interface <text-dom-port-anchor>] [around <text-time>] [json]
This example shows module temperature information for the spine01 switch.
Running NetQ on Linux hosts provides unprecedented network visibility, giving the network operator a complete view of the entire infrastructure’s network connectivity instead of just from the network devices.
The NetQ Agent is supported on the following Linux hosts:
Using NetQ on a Linux host is the same as using it on a Cumulus Linux switch. For example, if you want to check LLDP neighbor information about a given host, run:
With NetQ, a network administrator can monitor OSI Layer 1 physical components on network devices, including interfaces, ports, links, and peers. Keeping track of the various physical layer components in your switches and servers ensures you have a fully functioning network and provides inventory management and audit capabilities. You can monitor ports, transceivers, and cabling deployed on a per port (interface), per vendor, per part number and so forth. NetQ enables you to view the current status and the status an earlier point in time. From this information, you can, among other things:
Determine which ports are empty versus which ones have cables
plugged in and thereby validate expected connectivity
Audit transceiver and cable components used by vendor, giving you
insights for estimated replacement costs, repair costs, overall
costs, and so forth to improve your maintenance and purchasing
processes
Identify mismatched links
Identify changes in your physical layer, and when they occurred, indicating such items as bonds and links going down or flapping
NetQ uses
LLDP (Link Layer Discovery Protocol) to collect port information. NetQ can also identify peer ports connected to DACs (Direct Attached Cables) and AOCs (Active Optical Cables) without using LLDP, even if the link is not UP.
View Component Information
You can view performance and status information about cables, transceiver modules, and interfaces using the netq show interfaces physical command. Its syntax is:
When entering a time value, you must include a numeric value and the unit of measure:
d: days
w: weeks
h: hours
m: minutes
s: seconds
now
For the between option, you can enter the start (text-time) and end time (text-endtime) values as most recent first and least recent second, or vice versa. The values do not have to have the same unit of measure.
View Detailed Cable Information for All Devices
You can view which cables connect to each interface port for all devices, including the module type, vendor, part number and performance characteristics. You can also view the cable information for a given device by adding a hostname to the show command.
This example shows cable information and status for all interface ports on all devices.
cumulus@switch:~$ netq show interfaces physical
Matching cables records:
Hostname Interface State Speed AutoNeg Module Vendor Part No Last Changed
----------------- ------------------------- ---------- ---------- ------- --------- -------------------- ---------------- -------------------------
border01 vagrant down Unknown off RJ45 n/a n/a Fri Sep 18 20:08:05 2020
border01 swp54 up 1G off RJ45 n/a n/a Fri Sep 18 20:08:05 2020
border01 swp49 up 1G off RJ45 n/a n/a Fri Sep 18 20:08:05 2020
border01 swp2 down Unknown off RJ45 n/a n/a Fri Sep 18 20:08:05 2020
border01 swp3 up 1G off RJ45 n/a n/a Fri Sep 18 20:08:05 2020
border01 swp52 up 1G off RJ45 n/a n/a Fri Sep 18 20:08:05 2020
border01 swp1 down Unknown off RJ45 n/a n/a Fri Sep 18 20:08:05 2020
border01 swp53 up 1G off RJ45 n/a n/a Fri Sep 18 20:08:05 2020
border01 swp4 down Unknown off RJ45 n/a n/a Fri Sep 18 20:08:05 2020
border01 swp50 up 1G off RJ45 n/a n/a Fri Sep 18 20:08:05 2020
border01 eth0 up 1G off RJ45 n/a n/a Fri Sep 18 20:08:05 2020
border01 swp51 up 1G off RJ45 n/a n/a Fri Sep 18 20:08:05 2020
border02 swp49 up 1G off RJ45 n/a n/a Thu Sep 17 21:07:54 2020
border02 swp54 up 1G off RJ45 n/a n/a Thu Sep 17 21:07:54 2020
border02 swp52 up 1G off RJ45 n/a n/a Thu Sep 17 21:07:54 2020
border02 swp53 up 1G off RJ45 n/a n/a Thu Sep 17 21:07:54 2020
border02 swp4 down Unknown off RJ45 n/a n/a Thu Sep 17 21:07:54 2020
border02 swp3 up 1G off RJ45 n/a n/a Thu Sep 17 21:07:54 2020
border02 vagrant down Unknown off RJ45 n/a n/a Thu Sep 17 21:07:54 2020
border02 swp1 down Unknown off RJ45 n/a n/a Thu Sep 17 21:07:54 2020
border02 swp2 down Unknown off RJ45 n/a n/a Thu Sep 17 21:07:54 2020
border02 swp51 up 1G off RJ45 n/a n/a Thu Sep 17 21:07:54 2020
border02 swp50 up 1G off RJ45 n/a n/a Thu Sep 17 21:07:54 2020
border02 eth0 up 1G off RJ45 n/a n/a Thu Sep 17 21:07:54 2020
fw1 swp49 down Unknown off RJ45 n/a n/a Thu Sep 17 21:07:37 2020
fw1 eth0 up 1G off RJ45 n/a n/a Thu Sep 17 21:07:37 2020
fw1 swp1 up 1G off RJ45 n/a n/a Thu Sep 17 21:07:37 2020
fw1 swp2 up 1G off RJ45 n/a n/a Thu Sep 17 21:07:37 2020
fw1 vagrant down Unknown off RJ45 n/a n/a Thu Sep 17 21:07:37 2020
fw2 vagrant down Unknown off RJ45 n/a n/a Thu Sep 17 21:07:38 2020
fw2 eth0 up 1G off RJ45 n/a n/a Thu Sep 17 21:07:38 2020
fw2 swp49 down Unknown off RJ45 n/a n/a Thu Sep 17 21:07:38 2020
fw2 swp2 down Unknown off RJ45 n/a n/a Thu Sep 17 21:07:38 2020
fw2 swp1 down Unknown off RJ45 n/a n/a Thu Sep 17 21:07:38 2020
...
View Detailed Module Information for a Given Device
You can view detailed information about the transceiver modules on each interface port, including serial number, transceiver type, connector and attached cable length. You can also view the module information for a given device by adding a hostname to the show command.
This example shows the detailed module information for the interface ports on leaf02 switch.
cumulus@switch:~$ netq leaf02 show interfaces physical module
Matching cables records are:
Hostname Interface Module Vendor Part No Serial No Transceiver Connector Length Last Changed
----------------- ------------------------- --------- -------------------- ---------------- ------------------------- ---------------- ---------------- ------ -------------------------
leaf02 swp1 RJ45 n/a n/a n/a n/a n/a n/a Thu Feb 7 22:49:37 2019
leaf02 swp2 SFP Mellanox MC2609130-003 MT1507VS05177 1000Base-CX,Copp Copper pigtail 3m Thu Feb 7 22:49:37 2019
er Passive,Twin
Axial Pair (TW)
leaf02 swp47 QSFP+ CISCO AFBR-7IER05Z-CS1 AVE1823402U n/a n/a 5m Thu Feb 7 22:49:37 2019
leaf02 swp48 QSFP28 TE Connectivity 2231368-1 15250052 100G Base-CR4 or n/a 3m Thu Feb 7 22:49:37 2019
25G Base-CR CA-L
,40G Base-CR4
leaf02 swp49 SFP OEM SFP-10GB-LR ACSLR130408 10G Base-LR LC 10km, Thu Feb 7 22:49:37 2019
10000m
leaf02 swp50 SFP JDSU PLRXPLSCS4322N CG03UF45M 10G Base-SR,Mult LC 80m, Thu Feb 7 22:49:37 2019
imode, 30m,
50um (M5),Multim 300m
ode,
62.5um (M6),Shor
twave laser w/o
OFC (SN),interme
diate distance (
I)
leaf02 swp51 SFP Mellanox MC2609130-003 MT1507VS05177 1000Base-CX,Copp Copper pigtail 3m Thu Feb 7 22:49:37 2019
er Passive,Twin
Axial Pair (TW)
leaf02 swp52 SFP FINISAR CORP. FCLF8522P2BTL PTN1VH2 1000Base-T RJ45 100m Thu Feb 7 22:49:37 2019
View Ports without Cables Connected for a Given Device
Checking for empty ports enables you to compare expected versus actual deployment. This can be very helpful during deployment or during upgrades. You can also view the cable information for a given device by adding a hostname to the show command.
This example shows the ports that are empty on leaf01 switch:
cumulus@switch:~$ netq leaf01 show interfaces physical empty
Matching cables records are:
Hostname Interface State Speed AutoNeg Module Vendor Part No Last Changed
---------------- --------- ----- ---------- ------- --------- ---------------- ---------------- ------------------------
leaf01 swp49 down Unknown on empty n/a n/a Thu Feb 7 22:49:37 2019
leaf01 swp52 down Unknown on empty n/a n/a Thu Feb 7 22:49:37 2019
View Ports with Cables Connected for a Given Device
In a similar manner as checking for empty ports, you can check for ports that have cables connected, enabling you to compare expected versus actual deployment. You can also view the cable information for a given device by adding a hostname to the show command. If you add the around keyword, you can view which interface ports had cables connected at a previous time.
This example shows the ports of leaf01 switch that have attached cables.
cumulus@switch:~$ netq leaf01 show interfaces physical plugged
Matching cables records:
Hostname Interface State Speed AutoNeg Module Vendor Part No Last Changed
----------------- ------------------------- ---------- ---------- ------- --------- -------------------- ---------------- -------------------------
leaf01 eth0 up 1G on RJ45 n/a n/a Thu Feb 7 22:49:37 2019
leaf01 swp1 up 10G off SFP Amphenol 610640005 Thu Feb 7 22:49:37 2019
leaf01 swp2 up 10G off SFP Amphenol 610640005 Thu Feb 7 22:49:37 2019
leaf01 swp3 down 10G off SFP Mellanox MC3309130-001 Thu Feb 7 22:49:37 2019
leaf01 swp33 down 10G off SFP OEM SFP-H10GB-CU1M Thu Feb 7 22:49:37 2019
leaf01 swp34 down 10G off SFP Amphenol 571540007 Thu Feb 7 22:49:37 2019
leaf01 swp35 down 10G off SFP Amphenol 571540007 Thu Feb 7 22:49:37 2019
leaf01 swp36 down 10G off SFP OEM SFP-H10GB-CU1M Thu Feb 7 22:49:37 2019
leaf01 swp37 down 10G off SFP OEM SFP-H10GB-CU1M Thu Feb 7 22:49:37 2019
leaf01 swp38 down 10G off SFP OEM SFP-H10GB-CU1M Thu Feb 7 22:49:37 2019
leaf01 swp39 down 10G off SFP Amphenol 571540007 Thu Feb 7 22:49:37 2019
leaf01 swp40 down 10G off SFP Amphenol 571540007 Thu Feb 7 22:49:37 2019
leaf01 swp49 up 40G off QSFP+ Amphenol 624410001 Thu Feb 7 22:49:37 2019
leaf01 swp5 down 10G off SFP Amphenol 571540007 Thu Feb 7 22:49:37 2019
leaf01 swp50 down 40G off QSFP+ Amphenol 624410001 Thu Feb 7 22:49:37 2019
leaf01 swp51 down 40G off QSFP+ Amphenol 603020003 Thu Feb 7 22:49:37 2019
leaf01 swp52 up 40G off QSFP+ Amphenol 603020003 Thu Feb 7 22:49:37 2019
leaf01 swp54 down 40G off QSFP+ Amphenol 624410002 Thu Feb 7 22:49:37 2019
View Components from a Given Vendor
By filtering for a specific cable vendor, you can collect information such as how many ports use components from that vendor and when they were last updated. This information can be useful when you run a cost analysis of your network.
This example shows all the ports that are using components by an OEM vendor.
cumulus@switch:~$ netq leaf01 show interfaces physical vendor OEM
Matching cables records:
Hostname Interface State Speed AutoNeg Module Vendor Part No Last Changed
----------------- ------------------------- ---------- ---------- ------- --------- -------------------- ---------------- -------------------------
leaf01 swp33 down 10G off SFP OEM SFP-H10GB-CU1M Thu Feb 7 22:49:37 2019
leaf01 swp36 down 10G off SFP OEM SFP-H10GB-CU1M Thu Feb 7 22:49:37 2019
leaf01 swp37 down 10G off SFP OEM SFP-H10GB-CU1M Thu Feb 7 22:49:37 2019
leaf01 swp38 down 10G off SFP OEM SFP-H10GB-CU1M Thu Feb 7 22:49:37 2019
View All Devices Using a Given Component
You can view all devices with ports using a particular component. This could be helpful when you need to change out a particular component for possible failure issues, upgrades, or cost reasons.
This example first determines which models (part numbers) exist on all the devices and then those devices with a part number of QSFP-H40G-CU1M installed.
cumulus@switch:~$ netq show interfaces physical model
2231368-1 : 2231368-1
624400001 : 624400001
QSFP-H40G-CU1M : QSFP-H40G-CU1M
QSFP-H40G-CU1MUS : QSFP-H40G-CU1MUS
n/a : n/a
cumulus@switch:~$ netq show interfaces physical model QSFP-H40G-CU1M
Matching cables records:
Hostname Interface State Speed AutoNeg Module Vendor Part No Last Changed
----------------- ------------------------- ---------- ---------- ------- --------- -------------------- ---------------- -------------------------
leaf01 swp50 up 1G off QSFP+ OEM QSFP-H40G-CU1M Thu Feb 7 18:31:20 2019
leaf02 swp52 up 1G off QSFP+ OEM QSFP-H40G-CU1M Thu Feb 7 18:31:20 2019
View Changes to Physical Components
Because components are often changed, NetQ enables you to determine what, if any, changes you made to the physical components on your devices. This can be helpful during deployments or upgrades.
You can select how far back in time you want to go, or select a time range using the between keyword. Note that time values must include units to be valid. If there are no changes, a “No matching cable records found” message appears.
This example illustrates each of these scenarios for all devices in the network.
cumulus@switch:~$ netq show events type interfaces-physical between now and 30d
Matching cables records:
Hostname Interface State Speed AutoNeg Module Vendor Part No Last Changed
----------------- ------------------------- ---------- ---------- ------- --------- -------------------- ---------------- -------------------------
leaf01 swp1 up 1G off SFP AVAGO AFBR-5715PZ-JU1 Thu Feb 7 18:34:20 2019
leaf01 swp2 up 10G off SFP OEM SFP-10GB-LR Thu Feb 7 18:34:20 2019
leaf01 swp47 up 10G off SFP JDSU PLRXPLSCS4322N Thu Feb 7 18:34:20 2019
leaf01 swp48 up 40G off QSFP+ Mellanox MC2210130-002 Thu Feb 7 18:34:20 2019
leaf01 swp49 down 10G off empty n/a n/a Thu Feb 7 18:34:20 2019
leaf01 swp50 up 1G off SFP FINISAR CORP. FCLF8522P2BTL Thu Feb 7 18:34:20 2019
leaf01 swp51 up 1G off SFP FINISAR CORP. FTLF1318P3BTL Thu Feb 7 18:34:20 2019
leaf01 swp52 down 1G off SFP CISCO-AGILENT QFBR-5766LP Thu Feb 7 18:34:20 2019
leaf02 swp1 up 1G on RJ45 n/a n/a Thu Feb 7 18:34:20 2019
leaf02 swp2 up 10G off SFP Mellanox MC2609130-003 Thu Feb 7 18:34:20 2019
leaf02 swp47 up 10G off QSFP+ CISCO AFBR-7IER05Z-CS1 Thu Feb 7 18:34:20 2019
leaf02 swp48 up 10G off QSFP+ Mellanox MC2609130-003 Thu Feb 7 18:34:20 2019
leaf02 swp49 up 10G off SFP FIBERSTORE SFP-10GLR-31 Thu Feb 7 18:34:20 2019
leaf02 swp50 up 1G off SFP OEM SFP-GLC-T Thu Feb 7 18:34:20 2019
leaf02 swp51 up 10G off SFP Mellanox MC2609130-003 Thu Feb 7 18:34:20 2019
leaf02 swp52 up 1G off SFP FINISAR CORP. FCLF8522P2BTL Thu Feb 7 18:34:20 2019
leaf03 swp1 up 10G off SFP Mellanox MC2609130-003 Thu Feb 7 18:34:20 2019
leaf03 swp2 up 10G off SFP Mellanox MC3309130-001 Thu Feb 7 18:34:20 2019
leaf03 swp47 up 10G off SFP CISCO-AVAGO AFBR-7IER05Z-CS1 Thu Feb 7 18:34:20 2019
leaf03 swp48 up 10G off SFP Mellanox MC3309130-001 Thu Feb 7 18:34:20 2019
leaf03 swp49 down 1G off SFP FINISAR CORP. FCLF8520P2BTL Thu Feb 7 18:34:20 2019
leaf03 swp50 up 1G off SFP FINISAR CORP. FCLF8522P2BTL Thu Feb 7 18:34:20 2019
leaf03 swp51 up 10G off QSFP+ Mellanox MC2609130-003 Thu Feb 7 18:34:20 2019
...
oob-mgmt-server swp1 up 1G off RJ45 n/a n/a Thu Feb 7 18:34:20 2019
oob-mgmt-server swp2 up 1G off RJ45 n/a n/a Thu Feb 7 18:34:20 2019
cumulus@switch:~$ netq show events interfaces-physical between 6d and 16d
Matching cables records:
Hostname Interface State Speed AutoNeg Module Vendor Part No Last Changed
----------------- ------------------------- ---------- ---------- ------- --------- -------------------- ---------------- -------------------------
leaf01 swp1 up 1G off SFP AVAGO AFBR-5715PZ-JU1 Thu Feb 7 18:34:20 2019
leaf01 swp2 up 10G off SFP OEM SFP-10GB-LR Thu Feb 7 18:34:20 2019
leaf01 swp47 up 10G off SFP JDSU PLRXPLSCS4322N Thu Feb 7 18:34:20 2019
leaf01 swp48 up 40G off QSFP+ Mellanox MC2210130-002 Thu Feb 7 18:34:20 2019
leaf01 swp49 down 10G off empty n/a n/a Thu Feb 7 18:34:20 2019
leaf01 swp50 up 1G off SFP FINISAR CORP. FCLF8522P2BTL Thu Feb 7 18:34:20 2019
leaf01 swp51 up 1G off SFP FINISAR CORP. FTLF1318P3BTL Thu Feb 7 18:34:20 2019
leaf01 swp52 down 1G off SFP CISCO-AGILENT QFBR-5766LP Thu Feb 7 18:34:20 2019
...
cumulus@switch:~$ netq show events type interfaces-physical between 0s and 5h
No matching cables records found
View Utilization Statistics Networkwide
Utilization statistics provide a view into the operation of the devices in your network. They indicate whether resources are becoming dangerously close to their maximum capacity or a user-defined threshold. Depending on the function of the switch, the acceptable thresholds can vary.
View Compute Resources Utilization
You can quickly determine how many compute resources — CPU, disk and memory — the switches on your network consume.
To obtain this information, run the relevant command:
netq <hostname> show resource-util [cpu | memory] [around <text-time>] [json]
netq <hostname> show resource-util disk [<text-diskname>] [around <text-time>] [json]
When you specify no options, the output shows the percentage of CPU and memory the switch consumed as well as the amount and percentage of disk space it consumed. You can use the around option to view the information for a particular time.
This example shows the CPU, memory, and disk utilization for all devices.
cumulus@switch:~$ netq show resource-util
Matching resource_util records:
Hostname CPU Utilization Memory Utilization Disk Name Total Used Disk Utilization Last Updated
----------------- -------------------- -------------------- -------------------- -------------------- -------------------- -------------------- ------------------------
exit01 9.2 48 /dev/vda4 6170849280 1524920320 26.8 Wed Feb 12 03:54:10 2020
exit02 9.6 47.6 /dev/vda4 6170849280 1539346432 27.1 Wed Feb 12 03:54:22 2020
leaf01 9.8 50.5 /dev/vda4 6170849280 1523818496 26.8 Wed Feb 12 03:54:25 2020
leaf02 10.9 49.4 /dev/vda4 6170849280 1535246336 27 Wed Feb 12 03:54:11 2020
leaf03 11.4 49.4 /dev/vda4 6170849280 1536798720 27 Wed Feb 12 03:54:10 2020
leaf04 11.4 49.4 /dev/vda4 6170849280 1522495488 26.8 Wed Feb 12 03:54:03 2020
spine01 8.4 50.3 /dev/vda4 6170849280 1522249728 26.8 Wed Feb 12 03:54:19 2020
spine02 9.8 49 /dev/vda4 6170849280 1522003968 26.8 Wed Feb 12 03:54:25 2020
This example shows only the CPU utilization for all devices.
cumulus@switch:~$ netq show resource-util cpu
Matching resource_util records:
Hostname CPU Utilization Last Updated
----------------- -------------------- ------------------------
exit01 8.9 Wed Feb 12 04:29:29 2020
exit02 8.3 Wed Feb 12 04:29:22 2020
leaf01 10.9 Wed Feb 12 04:29:24 2020
leaf02 11.6 Wed Feb 12 04:29:10 2020
leaf03 9.8 Wed Feb 12 04:29:33 2020
leaf04 11.7 Wed Feb 12 04:29:29 2020
spine01 10.4 Wed Feb 12 04:29:38 2020
spine02 9.7 Wed Feb 12 04:29:15 2020
This example shows only the memory utilization for all devices.
cumulus@switch:~$ netq show resource-util memory
Matching resource_util records:
Hostname Memory Utilization Last Updated
----------------- -------------------- ------------------------
exit01 48.8 Wed Feb 12 04:29:29 2020
exit02 49.7 Wed Feb 12 04:29:22 2020
leaf01 49.8 Wed Feb 12 04:29:24 2020
leaf02 49.5 Wed Feb 12 04:29:10 2020
leaf03 50.7 Wed Feb 12 04:29:33 2020
leaf04 49.3 Wed Feb 12 04:29:29 2020
spine01 47.5 Wed Feb 12 04:29:07 2020
spine02 49.2 Wed Feb 12 04:29:15 2020
This example shows only the disk utilization for all devices.
cumulus@switch:~$ netq show resource-util disk
Matching resource_util records:
Hostname Disk Name Total Used Disk Utilization Last Updated
----------------- -------------------- -------------------- -------------------- -------------------- ------------------------
exit01 /dev/vda4 6170849280 1525309440 26.8 Wed Feb 12 04:29:29 2020
exit02 /dev/vda4 6170849280 1539776512 27.1 Wed Feb 12 04:29:22 2020
leaf01 /dev/vda4 6170849280 1524203520 26.8 Wed Feb 12 04:29:24 2020
leaf02 /dev/vda4 6170849280 1535631360 27 Wed Feb 12 04:29:41 2020
leaf03 /dev/vda4 6170849280 1537191936 27.1 Wed Feb 12 04:29:33 2020
leaf04 /dev/vda4 6170849280 1522864128 26.8 Wed Feb 12 04:29:29 2020
spine01 /dev/vda4 6170849280 1522688000 26.8 Wed Feb 12 04:29:38 2020
spine02 /dev/vda4 6170849280 1522409472 26.8 Wed Feb 12 04:29:46 2020
View Port Statistics
The ethtool command provides a wealth of statistics about network interfaces. It returns statistics about a given node and interface, including frame errors, ACL drops, buffer drops and more. The syntax is:
netq [<hostname>] show ethtool-stats port <physical-port> (rx | tx) [extended] [around <text-time>] [json]
You can use the around option to view the information for a particular time. If there are no changes, a “No matching ethtool_stats records found” message appears.
This example shows the transmit statistics for switch port swp50 on a the leaf01 switch in the network.
NetQ Agents collect performance statistics every 30 seconds for the physical interfaces on switches in your network. The NetQ Agent does not collect statistics for non-physical interfaces, such as bonds, bridges, and VXLANs. The NetQ Agent collects the following statistics:
For NetQ Appliances that have 3ME3 solid state drives (SSDs) installed (primarily in on-premises deployments), you can view the utilization of the drive on demand. An alarm gets generated when a drive drops below 10% health, or has more than a two percent loss of health in 24 hours, indicating the need to rebalance the drive. Tracking SSD utilization over time enables you to see any downward trend or instability of the drive before you receive an alarm.
To view SDD utilization, run:
netq show cl-ssd-util [around <text-time>] [json]
This example shows the utilization for all devices which have this type of SSD.
cumulus@switch:~$ netq show cl-ssd-util
Hostname Remaining PE Cycle (%) Current PE Cycles executed Total PE Cycles supported SSD Model Last Changed
spine02 80 576 2880 M.2 (S42) 3ME3 Thu Oct 31 00:15:06 2019
This output indicates that the one drive found of this type, on the spine02 switch, is in a good state overall with 80% of its PE cycles remaining. Use the around option to view this information around a particular time in the past.
View Disk Storage After BTRFS Allocation Networkwide
Customers running Cumulus Linux 3.x which uses the BTRFS (b-tree file system) might experience issues with disk space management. This is a known problem of BTRFS because it does not perform periodic garbage collection, or rebalancing. If left unattended, these errors can make it impossible to rebalance the partitions on the disk. To avoid this issue, NVIDIA recommends rebalancing the BTRFS partitions in a preemptive manner, but only when absolutely needed to avoid reduction in the lifetime of the disk. By tracking the state of the disk space usage, users can determine when to rebalance.
To view the disk utilization and whether you need to perform a rebalance, run:
netq show cl-btrfs-util [around <text-time>] [json]
This example shows the utilization on all devices:
cumulus@switch:~$ netq show cl-btrfs-info
Matching btrfs_info records:
Hostname Device Allocated Unallocated Space Largest Chunk Size Unused Data Chunks S Rebalance Recommende Last Changed
pace d
----------------- -------------------- -------------------- -------------------- -------------------- -------------------- -------------------------
leaf01 37.79 % 3.58 GB 588.5 MB 771.91 MB yes Wed Sep 16 21:25:17 2020
Look for the Rebalance Recommended column. If the value in that column says Yes, then you are strongly encouraged to rebalance the BTRFS partitions. If it says No, then you can review the other values in the output to determine if you are getting close to needing a rebalance, and come back to view this data at a later time.
Optionally, use the around option to view the information for a particular time in the past.
Monitor Data Link Layer Protocols and Services
With NetQ, a user can monitor OSI Layer 2 devices and protocols, including switches, bridges, link control, and physical media access. Keeping track of the various data link layer devices in your network ensures consistent and error-free communications between devices.
It helps answer questions such as:
Is a VLAN misconfigured?
Is MLAG configured correctly?
Is LLDP running on all of my devices?
Is there an STP loop?
What is the status of interfaces on a device?
Where has a given MAC address lived in my network?
Monitor Interfaces
You can monitor interface (link) health using the netq show interfaces command. You can view status of the links, whether they are operating over a VRF interface, the MTU of the link, and so forth. Using the hostname option enables you to view only the interfaces for a given device. View changes to interfaces using the netq show events command.
The syntax for these commands is:
netq show interfaces type (bond|bridge|eth|loopback|macvlan|swp|vlan|vrf|vxlan) [state <remote-interface-state>] [around <text-time>] [json]
netq <hostname> show interfaces type (bond|bridge|eth|loopback|macvlan|swp|vlan|vrf|vxlan) [state <remote-interface-state>] [around <text-time>] [count] [json]
netq [<hostname>] show events [level info | level error | level warning | level critical | level debug] type interfaces [between <text-time> and <text-endtime>] [json]
View Status for All Interfaces
Viewing the status of all interfaces at one time can be helpful when you are trying to compare the configuration or status of a set of links, or generally when changes occurred.
This example shows all interfaces networkwide.
cumulus@switch:~$ netq show interfaces
Matching link records:
Hostname Interface Type State VRF Details Last Changed
----------------- ------------------------- ---------------- ---------- --------------- ----------------------------------- -------------------------
exit01 bridge bridge up default , Root bridge: exit01, Mon Apr 29 20:57:59 2019
Root port: , Members: vxlan4001,
bridge,
exit01 eth0 eth up mgmt MTU: 1500 Mon Apr 29 20:57:59 2019
exit01 lo loopback up default MTU: 65536 Mon Apr 29 20:57:58 2019
exit01 mgmt vrf up table: 1001, MTU: 65536, Mon Apr 29 20:57:58 2019
Members: mgmt, eth0,
exit01 swp1 swp down default VLANs: , PVID: 0 MTU: 1500 Mon Apr 29 20:57:59 2019
exit01 swp44 swp up vrf1 VLANs: , Mon Apr 29 20:57:58 2019
PVID: 0 MTU: 1500 LLDP: internet:sw
p1
exit01 swp45 swp down default VLANs: , PVID: 0 MTU: 1500 Mon Apr 29 20:57:59 2019
exit01 swp46 swp down default VLANs: , PVID: 0 MTU: 1500 Mon Apr 29 20:57:59 2019
exit01 swp47 swp down default VLANs: , PVID: 0 MTU: 1500 Mon Apr 29 20:57:59 2019
...
leaf01 bond01 bond up default Slave:swp1 LLDP: server01:eth1 Mon Apr 29 20:57:59 2019
leaf01 bond02 bond up default Slave:swp2 LLDP: server02:eth1 Mon Apr 29 20:57:59 2019
leaf01 bridge bridge up default , Root bridge: leaf01, Mon Apr 29 20:57:59 2019
Root port: , Members: vxlan4001,
bond02, vni24, vni13, bond01,
bridge, peerlink,
leaf01 eth0 eth up mgmt MTU: 1500 Mon Apr 29 20:58:00 2019
leaf01 lo loopback up default MTU: 65536 Mon Apr 29 20:57:59 2019
leaf01 mgmt vrf up table: 1001, MTU: 65536, Mon Apr 29 20:57:59 2019
Members: mgmt, eth0,
leaf01 peerlink bond up default Slave:swp50 LLDP: leaf02:swp49 LLDP Mon Apr 29 20:58:00 2019
: leaf02:swp50
...
View Interface Status for a Given Device
You can choose to view the status of interfaces only on a specific device.
This example shows all interfaces on the spine01 device.
cumulus@switch:~$ netq spine01 show interfaces
Matching link records:
Hostname Interface Type State VRF Details Last Changed
----------------- ------------------------- ---------------- ---------- --------------- ----------------------------------- -------------------------
spine01 swp5 swp up default VLANs: , Mon Jan 11 05:56:54 2021
PVID: 0 MTU: 9216 LLDP: border01:sw
p51
spine01 swp6 swp up default VLANs: , Mon Jan 11 05:56:54 2021
PVID: 0 MTU: 9216 LLDP: border02:sw
p51
spine01 lo loopback up default MTU: 65536 Mon Jan 11 05:56:54 2021
spine01 eth0 eth up mgmt MTU: 1500 Mon Jan 11 05:56:54 2021
spine01 vagrant swp down default VLANs: , PVID: 0 MTU: 1500 Mon Jan 11 05:56:54 2021
spine01 mgmt vrf up mgmt table: 1001, MTU: 65536, Mon Jan 11 05:56:54 2021
Members: eth0, mgmt,
spine01 swp1 swp up default VLANs: , Mon Jan 11 05:56:54 2021
PVID: 0 MTU: 9216 LLDP: leaf01:swp5
1
spine01 swp2 swp up default VLANs: , Mon Jan 11 05:56:54 2021
PVID: 0 MTU: 9216 LLDP: leaf02:swp5
1
spine01 swp3 swp up default VLANs: , Mon Jan 11 05:56:54 2021
PVID: 0 MTU: 9216 LLDP: leaf03:swp5
1
spine01 swp4 swp up default VLANs: , Mon Jan 11 05:56:54 2021
PVID: 0 MTU: 9216 LLDP: leaf04:swp5
1
cumulus@switch:~$
View All Interfaces of a Given Type
It can be can be useful to see the status of a particular type of interface.
This example shows all bond interfaces that are down, and then those that are up.
cumulus@switch:~$ netq show interfaces type bond state down
No matching link records found
cumulus@switch:~$ netq show interfaces type bond state up
Matching link records:
Hostname Interface Type State VRF Details Last Changed
----------------- ------------------------- ---------------- ---------- --------------- ----------------------------------- -------------------------
border01 peerlink bond up default Slave: swp49 (LLDP: border02:swp49) Mon Jan 11 05:56:35 2021
,
Slave: swp50 (LLDP: border02:swp50)
border01 bond1 bond up default Slave: swp3 (LLDP: fw1:swp1) Mon Jan 11 05:56:36 2021
border02 peerlink bond up default Slave: swp49 (LLDP: border01:swp49) Mon Jan 11 05:56:38 2021
,
Slave: swp50 (LLDP: border01:swp50)
border02 bond1 bond up default Slave: swp3 (LLDP: fw1:swp2) Mon Jan 11 05:56:38 2021
fw1 borderBond bond up default Slave: swp1 (LLDP: border01:swp3), Mon Jan 11 05:56:36 2021
Slave: swp2 (LLDP: border02:swp3)
leaf01 bond2 bond up default Slave: swp2 (LLDP: server02:mac:44: Mon Jan 11 05:56:39 2021
38:39:00:00:34)
leaf01 peerlink bond up default Slave: swp49 (LLDP: leaf02:swp49), Mon Jan 11 05:56:39 2021
Slave: swp50 (LLDP: leaf02:swp50)
leaf01 bond3 bond up default Slave: swp3 (LLDP: server03:mac:44: Mon Jan 11 05:56:39 2021
38:39:00:00:36)
leaf01 bond1 bond up default Slave: swp1 (LLDP: server01:mac:44: Mon Jan 11 05:56:39 2021
38:39:00:00:32)
leaf02 bond2 bond up default Slave: swp2 (LLDP: server02:mac:44: Mon Jan 11 05:56:31 2021
38:39:00:00:3a)
leaf02 peerlink bond up default Slave: swp49 (LLDP: leaf01:swp49), Mon Jan 11 05:56:31 2021
Slave: swp50 (LLDP: leaf01:swp50)
leaf02 bond3 bond up default Slave: swp3 (LLDP: server03:mac:44: Mon Jan 11 05:56:31 2021
38:39:00:00:3c)
leaf02 bond1 bond up default Slave: swp1 (LLDP: server01:mac:44: Mon Jan 11 05:56:31 2021
38:39:00:00:38)
leaf03 bond2 bond up default Slave: swp2 (LLDP: server05:mac:44: Mon Jan 11 05:56:37 2021
38:39:00:00:40)
leaf03 peerlink bond up default Slave: swp49 (LLDP: leaf04:swp49), Mon Jan 11 05:56:37 2021
Slave: swp50 (LLDP: leaf04:swp50)
leaf03 bond3 bond up default Slave: swp3 (LLDP: server06:mac:44: Mon Jan 11 05:56:37 2021
38:39:00:00:42)
leaf03 bond1 bond up default Slave: swp1 (LLDP: server04:mac:44: Mon Jan 11 05:56:37 2021
38:39:00:00:3e)
leaf04 bond2 bond up default Slave: swp2 (LLDP: server05:mac:44: Mon Jan 11 05:56:43 2021
38:39:00:00:46)
leaf04 peerlink bond up default Slave: swp49 (LLDP: leaf03:swp49), Mon Jan 11 05:56:43 2021
Slave: swp50 (LLDP: leaf03:swp50)
leaf04 bond3 bond up default Slave: swp3 (LLDP: server06:mac:44: Mon Jan 11 05:56:43 2021
38:39:00:00:48)
leaf04 bond1 bond up default Slave: swp1 (LLDP: server04:mac:44: Mon Jan 11 05:56:43 2021
38:39:00:00:44)
server01 uplink bond up default Slave: eth2 (LLDP: leaf02:swp1), Mon Jan 11 05:35:22 2021
Slave: eth1 (LLDP: leaf01:swp1)
server02 uplink bond up default Slave: eth2 (LLDP: leaf02:swp2), Mon Jan 11 05:34:52 2021
Slave: eth1 (LLDP: leaf01:swp2)
server03 uplink bond up default Slave: eth2 (LLDP: leaf02:swp3), Mon Jan 11 05:34:47 2021
Slave: eth1 (LLDP: leaf01:swp3)
server04 uplink bond up default Slave: eth2 (LLDP: leaf04:swp1), Mon Jan 11 05:34:52 2021
Slave: eth1 (LLDP: leaf03:swp1)
server05 uplink bond up default Slave: eth2 (LLDP: leaf04:swp2), Mon Jan 11 05:34:41 2021
Slave: eth1 (LLDP: leaf03:swp2)
server06 uplink bond up default Slave: eth2 (LLDP: leaf04:swp3), Mon Jan 11 05:35:03 2021
Slave: eth1 (LLDP: leaf03:swp3)
View the Total Number of Interfaces
For a quick view of the amount of interfaces currently operating on a device, use the hostname and count options together.
This example shows the count of interfaces on the leaf03 switch.
cumulus@switch:~$ netq leaf03 show interfaces count
Count of matching link records: 28
View the Total Number of a Given Interface Type
It can be useful to see how many interfaces of a particular type you have on a device.
This example shows the count of swp interfaces are on the leaf03 switch.
cumulus@switch:~$ netq leaf03 show interfaces type swp count
Count of matching link records: 11
View Changes to Interfaces
If you suspect that an interface is not working as expected, seeing a drop in performance or a large number of dropped messages for example, you can view any changes made to interfaces networkwide.
This example shows info level events for all interfaces in your network.
cumulus@switch:~$ netq show events level info type interfaces between now and 30d
Matching events records:
Hostname Message Type Severity Message Timestamp
----------------- ------------------------ ---------------- ----------------------------------- -------------------------
server03 link info HostName server03 changed state fro 3d:12h:8m:28s
m down to up Interface:eth2
server03 link info HostName server03 changed state fro 3d:12h:8m:28s
m down to up Interface:eth1
server01 link info HostName server01 changed state fro 3d:12h:8m:30s
m down to up Interface:eth2
server01 link info HostName server01 changed state fro 3d:12h:8m:30s
m down to up Interface:eth1
server02 link info HostName server02 changed state fro 3d:12h:8m:34s
m down to up Interface:eth2
...
View Aliases for Interfaces
You can see which interfaces have aliases.
cumulus@switch:~$ netq show interfaces alias swp2
Matching link records:
Hostname Interface Alias State Last Changed
----------------- ------------------------- ------------------------------ ------- -------------------------
border01 swp2 down Mon Jan 11 05:56:35 2021
border02 swp2 down Mon Jan 11 05:56:38 2021
fw1 swp2 up Mon Jan 11 05:56:36 2021
fw2 swp2 rocket down Mon Jan 11 05:56:34 2021
leaf01 swp2 up Mon Jan 11 23:16:42 2021
leaf02 swp2 turtle up Mon Jan 11 05:56:30 2021
leaf03 swp2 up Mon Jan 11 05:56:37 2021
leaf04 swp2 up Mon Jan 11 05:56:43 2021
spine01 swp2 up Mon Jan 11 05:56:54 2021
spine02 swp2 up Mon Jan 11 05:56:35 2021
spine03 swp2 up Mon Jan 11 05:56:35 2021
spine04 swp2 up Mon Jan 11 05:56:35 2021
If you do not specify a switch port or host, the command returns all configured aliases.
Check for MTU Inconsistencies
The maximum transmission unit (MTU) determines the largest size packet or frame that can be transmitted across a given communication link. When the MTU is not configured to the same value on both ends of the link, communication problems can occur. With NetQ, you can verify that the MTU is correctly specified for each link using the netq check mtu command.
This example shows that four switches have inconsistently specified link MTUs. Now the network administrator or operator can reconfigure the switches and eliminate the communication issues associated with this misconfiguration.
cumulus@switch:~$ netq check mtu
Checked Nodes: 15, Checked Links: 215, Failed Nodes: 4, Failed Links: 7
MTU mismatch found on following links
Hostname Interface MTU Peer Peer Interface Peer MTU Error
----------------- ------------------------- ------ ----------------- ------------------------- -------- ---------------
spine01 swp30 9216 exit01 swp51 1500 MTU Mismatch
exit01 swp51 1500 spine01 swp30 9216 MTU Mismatch
spine01 swp29 9216 exit02 swp51 1500 MTU Mismatch
exit02 - - - - - Rotten Agent
exit01 swp52 1500 spine02 swp30 9216 MTU Mismatch
spine02 swp30 9216 exit01 swp52 1500 MTU Mismatch
spine02 swp29 9216 exit02 swp52 1500 MTU Mismatch
Monitor the LLDP Service
Network devices use LLDP to advertise their identity, capabilities, and neighbors on a LAN. You can view this information for one or more devices. You can also view the information at an earlier point in time or view changes that have occurred to the information during a specified time period. For an overview and how to configure LLDP in your network, refer to
Link Layer Discovery Protocol.
NetQ enables operators to view the overall health of the LLDP service on a networkwide and a per session basis, giving greater insight into all aspects of the service. You accomplish this in the NetQ UI through two card workflows, one for the service and one for the session and in the NetQ CLI with the netq show lldp command.
Monitor the LLDP Service Networkwide
With NetQ, you can monitor LLDP performance across the network:
Network Services|All LLDP Sessions
Small: view number of nodes running LLDP service and number of alarms
Medium: view number of nodes running LLDP service, number of sessions, and number of alarms
Large: view number of nodes running LLDP service, number of sessions and alarms, number of sessions without neighbors, switches with the most established/unestablished sessions
Full-screen: view all switches, all sessions, and all alarms
netq show lldp command: view associated host interface, peer hostname and interface, and last time a change occurred for each session running LLDP
When entering a time value in the netq show lldp command, you must include a numeric value and the unit of measure:
w: weeks
d: days
h: hours
m: minutes
s: seconds
now
When using the between option, you can enter the start time (text-time) and end time (text-endtime) values as most recent first and least recent second, or vice versa. The values do not have to have the same unit of measure.
View Service Status Summary
You can view a summary of the LLDP service from the NetQ UI or the NetQ CLI.
Open the small Network Services|All LLDP Sessions card. In this example, the number of devices running the LLDP service is 14 and no alarms are present.
To view LLDP service status, run netq show lldp.
This example shows the Cumulus reference topology, where LLDP runs on all border, firewall, leaf, and spine switches, all servers, and the out-of-band management server. You can view the host interface, peer hostname and interface, and last time a change was made for each session.
cumulus@switch:~$ netq show lldp
Matching lldp records:
Hostname Interface Peer Hostname Peer Interface Last Changed
----------------- ------------------------- ----------------- ------------------------- -------------------------
border01 swp3 fw1 swp1 Mon Oct 26 04:13:29 2020
border01 swp49 border02 swp49 Mon Oct 26 04:13:29 2020
border01 swp51 spine01 swp5 Mon Oct 26 04:13:29 2020
border01 swp52 spine02 swp5 Mon Oct 26 04:13:29 2020
border01 eth0 oob-mgmt-switch swp20 Mon Oct 26 04:13:29 2020
border01 swp53 spine03 swp5 Mon Oct 26 04:13:29 2020
border01 swp50 border02 swp50 Mon Oct 26 04:13:29 2020
border01 swp54 spine04 swp5 Mon Oct 26 04:13:29 2020
border02 swp49 border01 swp49 Mon Oct 26 04:13:11 2020
border02 swp3 fw1 swp2 Mon Oct 26 04:13:11 2020
border02 swp51 spine01 swp6 Mon Oct 26 04:13:11 2020
border02 swp54 spine04 swp6 Mon Oct 26 04:13:11 2020
border02 swp52 spine02 swp6 Mon Oct 26 04:13:11 2020
border02 eth0 oob-mgmt-switch swp21 Mon Oct 26 04:13:11 2020
border02 swp53 spine03 swp6 Mon Oct 26 04:13:11 2020
border02 swp50 border01 swp50 Mon Oct 26 04:13:11 2020
fw1 eth0 oob-mgmt-switch swp18 Mon Oct 26 04:38:03 2020
fw1 swp1 border01 swp3 Mon Oct 26 04:38:03 2020
fw1 swp2 border02 swp3 Mon Oct 26 04:38:03 2020
fw2 eth0 oob-mgmt-switch swp19 Mon Oct 26 04:46:54 2020
leaf01 swp1 server01 mac:44:38:39:00:00:32 Mon Oct 26 04:13:57 2020
leaf01 swp2 server02 mac:44:38:39:00:00:34 Mon Oct 26 04:13:57 2020
leaf01 swp52 spine02 swp1 Mon Oct 26 04:13:57 2020
leaf01 swp49 leaf02 swp49 Mon Oct 26 04:13:57 2020
leaf01 eth0 oob-mgmt-switch swp10 Mon Oct 26 04:13:57 2020
leaf01 swp3 server03 mac:44:38:39:00:00:36 Mon Oct 26 04:13:57 2020
leaf01 swp53 spine03 swp1 Mon Oct 26 04:13:57 2020
leaf01 swp50 leaf02 swp50 Mon Oct 26 04:13:57 2020
leaf01 swp54 spine04 swp1 Mon Oct 26 04:13:57 2020
leaf01 swp51 spine01 swp1 Mon Oct 26 04:13:57 2020
...
View the Distribution of Nodes, Alarms, and Sessions
It is useful to know the number of network nodes running the LLDP protocol over a period of time and the number of established sessions on a given node, as it gives you insight into the amount of traffic associated with and breadth of use of the protocol. Additionally, if there are a large number of alarms, it is worth investigating either the service or particular devices.
Nodes which have a large number of unestablished sessions might have a misconfiguration or is experiencing communication issues. This is visible with the NetQ UI.
To view the distribution, open the medium Network Services|All LLDP Sessions card.
In this example, we see that 13 nodes are running the LLDP protocol, that there are 52 sessions established, and that no LLDP-related alarms have occurred in the last 24 hours. If there was a visual correlation between the alarms and sessions, you could dig a little deeper with the large Network Services|All LLDP Sessions card.
To view the number of switches running the LLDP service, run:
netq show lldp
Count the switches in the output.
This example shows two border, two firewall, four leaf switches, four spine, and one out-of-band management switches, plus eight host servers are all running the LLDP service, for a total of 23 devices.
cumulus@switch:~$ netq show lldp
Matching lldp records:
Hostname Interface Peer Hostname Peer Interface Last Changed
----------------- ------------------------- ----------------- ------------------------- -------------------------
border01 swp3 fw1 swp1 Mon Oct 26 04:13:29 2020
border01 swp49 border02 swp49 Mon Oct 26 04:13:29 2020
border01 swp51 spine01 swp5 Mon Oct 26 04:13:29 2020
border01 swp52 spine02 swp5 Mon Oct 26 04:13:29 2020
border01 eth0 oob-mgmt-switch swp20 Mon Oct 26 04:13:29 2020
border01 swp53 spine03 swp5 Mon Oct 26 04:13:29 2020
border01 swp50 border02 swp50 Mon Oct 26 04:13:29 2020
border01 swp54 spine04 swp5 Mon Oct 26 04:13:29 2020
border02 swp49 border01 swp49 Mon Oct 26 04:13:11 2020
border02 swp3 fw1 swp2 Mon Oct 26 04:13:11 2020
border02 swp51 spine01 swp6 Mon Oct 26 04:13:11 2020
border02 swp54 spine04 swp6 Mon Oct 26 04:13:11 2020
border02 swp52 spine02 swp6 Mon Oct 26 04:13:11 2020
border02 eth0 oob-mgmt-switch swp21 Mon Oct 26 04:13:11 2020
border02 swp53 spine03 swp6 Mon Oct 26 04:13:11 2020
border02 swp50 border01 swp50 Mon Oct 26 04:13:11 2020
fw1 eth0 oob-mgmt-switch swp18 Mon Oct 26 04:38:03 2020
fw1 swp1 border01 swp3 Mon Oct 26 04:38:03 2020
fw1 swp2 border02 swp3 Mon Oct 26 04:38:03 2020
fw2 eth0 oob-mgmt-switch swp19 Mon Oct 26 04:46:54 2020
leaf01 swp1 server01 mac:44:38:39:00:00:32 Mon Oct 26 04:13:57 2020
leaf01 swp2 server02 mac:44:38:39:00:00:34 Mon Oct 26 04:13:57 2020
leaf01 swp52 spine02 swp1 Mon Oct 26 04:13:57 2020
leaf01 swp49 leaf02 swp49 Mon Oct 26 04:13:57 2020
leaf01 eth0 oob-mgmt-switch swp10 Mon Oct 26 04:13:57 2020
leaf01 swp3 server03 mac:44:38:39:00:00:36 Mon Oct 26 04:13:57 2020
leaf01 swp53 spine03 swp1 Mon Oct 26 04:13:57 2020
leaf01 swp50 leaf02 swp50 Mon Oct 26 04:13:57 2020
leaf01 swp54 spine04 swp1 Mon Oct 26 04:13:57 2020
leaf01 swp51 spine01 swp1 Mon Oct 26 04:13:57 2020
leaf02 swp52 spine02 swp2 Mon Oct 26 04:14:57 2020
leaf02 swp54 spine04 swp2 Mon Oct 26 04:14:57 2020
leaf02 swp2 server02 mac:44:38:39:00:00:3a Mon Oct 26 04:14:57 2020
leaf02 swp3 server03 mac:44:38:39:00:00:3c Mon Oct 26 04:14:57 2020
leaf02 swp53 spine03 swp2 Mon Oct 26 04:14:57 2020
leaf02 swp50 leaf01 swp50 Mon Oct 26 04:14:57 2020
leaf02 swp51 spine01 swp2 Mon Oct 26 04:14:57 2020
leaf02 eth0 oob-mgmt-switch swp11 Mon Oct 26 04:14:57 2020
leaf02 swp49 leaf01 swp49 Mon Oct 26 04:14:57 2020
leaf02 swp1 server01 mac:44:38:39:00:00:38 Mon Oct 26 04:14:57 2020
leaf03 swp2 server05 mac:44:38:39:00:00:40 Mon Oct 26 04:16:09 2020
leaf03 swp49 leaf04 swp49 Mon Oct 26 04:16:09 2020
leaf03 swp51 spine01 swp3 Mon Oct 26 04:16:09 2020
leaf03 swp50 leaf04 swp50 Mon Oct 26 04:16:09 2020
leaf03 swp54 spine04 swp3 Mon Oct 26 04:16:09 2020
leaf03 swp1 server04 mac:44:38:39:00:00:3e Mon Oct 26 04:16:09 2020
leaf03 swp52 spine02 swp3 Mon Oct 26 04:16:09 2020
leaf03 eth0 oob-mgmt-switch swp12 Mon Oct 26 04:16:09 2020
leaf03 swp53 spine03 swp3 Mon Oct 26 04:16:09 2020
leaf03 swp3 server06 mac:44:38:39:00:00:42 Mon Oct 26 04:16:09 2020
leaf04 swp1 server04 mac:44:38:39:00:00:44 Mon Oct 26 04:15:57 2020
leaf04 swp49 leaf03 swp49 Mon Oct 26 04:15:57 2020
leaf04 swp54 spine04 swp4 Mon Oct 26 04:15:57 2020
leaf04 swp52 spine02 swp4 Mon Oct 26 04:15:57 2020
leaf04 swp2 server05 mac:44:38:39:00:00:46 Mon Oct 26 04:15:57 2020
leaf04 swp50 leaf03 swp50 Mon Oct 26 04:15:57 2020
leaf04 swp51 spine01 swp4 Mon Oct 26 04:15:57 2020
leaf04 eth0 oob-mgmt-switch swp13 Mon Oct 26 04:15:57 2020
leaf04 swp3 server06 mac:44:38:39:00:00:48 Mon Oct 26 04:15:57 2020
leaf04 swp53 spine03 swp4 Mon Oct 26 04:15:57 2020
oob-mgmt-server eth1 oob-mgmt-switch swp1 Sun Oct 25 22:46:24 2020
server01 eth0 oob-mgmt-switch swp2 Sun Oct 25 22:51:17 2020
server01 eth1 leaf01 swp1 Sun Oct 25 22:51:17 2020
server01 eth2 leaf02 swp1 Sun Oct 25 22:51:17 2020
server02 eth0 oob-mgmt-switch swp3 Sun Oct 25 22:49:41 2020
server02 eth1 leaf01 swp2 Sun Oct 25 22:49:41 2020
server02 eth2 leaf02 swp2 Sun Oct 25 22:49:41 2020
server03 eth2 leaf02 swp3 Sun Oct 25 22:50:08 2020
server03 eth1 leaf01 swp3 Sun Oct 25 22:50:08 2020
server03 eth0 oob-mgmt-switch swp4 Sun Oct 25 22:50:08 2020
server04 eth0 oob-mgmt-switch swp5 Sun Oct 25 22:50:27 2020
server04 eth1 leaf03 swp1 Sun Oct 25 22:50:27 2020
server04 eth2 leaf04 swp1 Sun Oct 25 22:50:27 2020
server05 eth0 oob-mgmt-switch swp6 Sun Oct 25 22:49:12 2020
server05 eth1 leaf03 swp2 Sun Oct 25 22:49:12 2020
server05 eth2 leaf04 swp2 Sun Oct 25 22:49:12 2020
server06 eth0 oob-mgmt-switch swp7 Sun Oct 25 22:49:22 2020
server06 eth1 leaf03 swp3 Sun Oct 25 22:49:22 2020
server06 eth2 leaf04 swp3 Sun Oct 25 22:49:22 2020
server07 eth0 oob-mgmt-switch swp8 Sun Oct 25 22:29:58 2020
server08 eth0 oob-mgmt-switch swp9 Sun Oct 25 22:34:12 2020
spine01 swp1 leaf01 swp51 Mon Oct 26 04:13:20 2020
spine01 swp3 leaf03 swp51 Mon Oct 26 04:13:20 2020
spine01 swp2 leaf02 swp51 Mon Oct 26 04:13:20 2020
spine01 swp5 border01 swp51 Mon Oct 26 04:13:20 2020
spine01 eth0 oob-mgmt-switch swp14 Mon Oct 26 04:13:20 2020
spine01 swp4 leaf04 swp51 Mon Oct 26 04:13:20 2020
spine01 swp6 border02 swp51 Mon Oct 26 04:13:20 2020
spine02 swp4 leaf04 swp52 Mon Oct 26 04:16:26 2020
spine02 swp3 leaf03 swp52 Mon Oct 26 04:16:26 2020
spine02 swp6 border02 swp52 Mon Oct 26 04:16:26 2020
spine02 eth0 oob-mgmt-switch swp15 Mon Oct 26 04:16:26 2020
spine02 swp5 border01 swp52 Mon Oct 26 04:16:26 2020
spine02 swp2 leaf02 swp52 Mon Oct 26 04:16:26 2020
spine02 swp1 leaf01 swp52 Mon Oct 26 04:16:26 2020
spine03 swp2 leaf02 swp53 Mon Oct 26 04:13:48 2020
spine03 swp6 border02 swp53 Mon Oct 26 04:13:48 2020
spine03 swp1 leaf01 swp53 Mon Oct 26 04:13:48 2020
spine03 swp3 leaf03 swp53 Mon Oct 26 04:13:48 2020
spine03 swp4 leaf04 swp53 Mon Oct 26 04:13:48 2020
spine03 eth0 oob-mgmt-switch swp16 Mon Oct 26 04:13:48 2020
spine03 swp5 border01 swp53 Mon Oct 26 04:13:48 2020
spine04 eth0 oob-mgmt-switch swp17 Mon Oct 26 04:11:23 2020
spine04 swp3 leaf03 swp54 Mon Oct 26 04:11:23 2020
spine04 swp2 leaf02 swp54 Mon Oct 26 04:11:23 2020
spine04 swp4 leaf04 swp54 Mon Oct 26 04:11:23 2020
spine04 swp1 leaf01 swp54 Mon Oct 26 04:11:23 2020
spine04 swp5 border01 swp54 Mon Oct 26 04:11:23 2020
spine04 swp6 border02 swp54 Mon Oct 26 04:11:23 2020
View the Distribution of Missing Neighbors
You can view the number of missing neighbors in any given time period and how that number has changed over time. This is a good indicator of link communication issues.
To view the distribution, open the large Network Services|ALL LLDP Sessions card and view the bottom chart on the left, Total Sessions with No Nbr.
In this example, we see that 16 of the 52 sessions are consistently missing the neighbor (peer) device over the last 24 hours.
View Devices with the Most LLDP Sessions
You can view the load from LLDP on your switches using the large Network Services|All LLDP Sessions card or the NetQ CLI. This data enables you to see which switches are handling the most LLDP traffic currently, validate that is what is expected based on your network design, and compare that with data from an earlier time to look for any differences.
To view switches and hosts with the most LLDP sessions:
Open the large Network Services|All LLDP Sessions card.
Select Switches with Most Sessions from the filter above the table.
The table content is sorted by this characteristic, listing nodes running the most LLDP sessions at the top. Scroll down to view those with the fewest sessions.
To compare this data with the same data at a previous time:
Open another large LLDP Service card.
Move the new card next to the original card if needed.
Change the time period for the data on the new card by hovering over the card and clicking .
Select the time period that you want to compare with the current time. You can now see whether there are significant differences between this time period and the previous time period.
In this case, notice that their are fewer nodes running the protocol, but the total number of sessions running has nearly doubled. If the changes are unexpected, you can investigate further by looking at another timeframe, determining if more nodes are now running LLDP than previously, looking for changes in the topology, and so forth.
To determine the devices with the most sessions, run netq show lldp. Then count the sessions on each device.
In this example, border01-02 each have eight sessions, fw1-2 each have two sessions, leaf01-04 each have 10 sessions, spine01-04 switches each have four sessions, server01-06 each have three sessions, and server07-08 and oob-mgmt-server each have one session. Therefore the leaf switches have the most sessions.
cumulus@switch:~$ netq show lldp
Matching lldp records:
Hostname Interface Peer Hostname Peer Interface Last Changed
----------------- ------------------------- ----------------- ------------------------- -------------------------
border01 swp3 fw1 swp1 Mon Oct 26 04:13:29 2020
border01 swp49 border02 swp49 Mon Oct 26 04:13:29 2020
border01 swp51 spine01 swp5 Mon Oct 26 04:13:29 2020
border01 swp52 spine02 swp5 Mon Oct 26 04:13:29 2020
border01 eth0 oob-mgmt-switch swp20 Mon Oct 26 04:13:29 2020
border01 swp53 spine03 swp5 Mon Oct 26 04:13:29 2020
border01 swp50 border02 swp50 Mon Oct 26 04:13:29 2020
border01 swp54 spine04 swp5 Mon Oct 26 04:13:29 2020
border02 swp49 border01 swp49 Mon Oct 26 04:13:11 2020
border02 swp3 fw1 swp2 Mon Oct 26 04:13:11 2020
border02 swp51 spine01 swp6 Mon Oct 26 04:13:11 2020
border02 swp54 spine04 swp6 Mon Oct 26 04:13:11 2020
border02 swp52 spine02 swp6 Mon Oct 26 04:13:11 2020
border02 eth0 oob-mgmt-switch swp21 Mon Oct 26 04:13:11 2020
border02 swp53 spine03 swp6 Mon Oct 26 04:13:11 2020
border02 swp50 border01 swp50 Mon Oct 26 04:13:11 2020
fw1 eth0 oob-mgmt-switch swp18 Mon Oct 26 04:38:03 2020
fw1 swp1 border01 swp3 Mon Oct 26 04:38:03 2020
fw1 swp2 border02 swp3 Mon Oct 26 04:38:03 2020
fw2 eth0 oob-mgmt-switch swp19 Mon Oct 26 04:46:54 2020
leaf01 swp1 server01 mac:44:38:39:00:00:32 Mon Oct 26 04:13:57 2020
leaf01 swp2 server02 mac:44:38:39:00:00:34 Mon Oct 26 04:13:57 2020
leaf01 swp52 spine02 swp1 Mon Oct 26 04:13:57 2020
leaf01 swp49 leaf02 swp49 Mon Oct 26 04:13:57 2020
leaf01 eth0 oob-mgmt-switch swp10 Mon Oct 26 04:13:57 2020
leaf01 swp3 server03 mac:44:38:39:00:00:36 Mon Oct 26 04:13:57 2020
leaf01 swp53 spine03 swp1 Mon Oct 26 04:13:57 2020
leaf01 swp50 leaf02 swp50 Mon Oct 26 04:13:57 2020
leaf01 swp54 spine04 swp1 Mon Oct 26 04:13:57 2020
leaf01 swp51 spine01 swp1 Mon Oct 26 04:13:57 2020
leaf02 swp52 spine02 swp2 Mon Oct 26 04:14:57 2020
leaf02 swp54 spine04 swp2 Mon Oct 26 04:14:57 2020
leaf02 swp2 server02 mac:44:38:39:00:00:3a Mon Oct 26 04:14:57 2020
leaf02 swp3 server03 mac:44:38:39:00:00:3c Mon Oct 26 04:14:57 2020
leaf02 swp53 spine03 swp2 Mon Oct 26 04:14:57 2020
leaf02 swp50 leaf01 swp50 Mon Oct 26 04:14:57 2020
leaf02 swp51 spine01 swp2 Mon Oct 26 04:14:57 2020
leaf02 eth0 oob-mgmt-switch swp11 Mon Oct 26 04:14:57 2020
leaf02 swp49 leaf01 swp49 Mon Oct 26 04:14:57 2020
leaf02 swp1 server01 mac:44:38:39:00:00:38 Mon Oct 26 04:14:57 2020
leaf03 swp2 server05 mac:44:38:39:00:00:40 Mon Oct 26 04:16:09 2020
leaf03 swp49 leaf04 swp49 Mon Oct 26 04:16:09 2020
leaf03 swp51 spine01 swp3 Mon Oct 26 04:16:09 2020
leaf03 swp50 leaf04 swp50 Mon Oct 26 04:16:09 2020
leaf03 swp54 spine04 swp3 Mon Oct 26 04:16:09 2020
leaf03 swp1 server04 mac:44:38:39:00:00:3e Mon Oct 26 04:16:09 2020
leaf03 swp52 spine02 swp3 Mon Oct 26 04:16:09 2020
leaf03 eth0 oob-mgmt-switch swp12 Mon Oct 26 04:16:09 2020
leaf03 swp53 spine03 swp3 Mon Oct 26 04:16:09 2020
leaf03 swp3 server06 mac:44:38:39:00:00:42 Mon Oct 26 04:16:09 2020
leaf04 swp1 server04 mac:44:38:39:00:00:44 Mon Oct 26 04:15:57 2020
leaf04 swp49 leaf03 swp49 Mon Oct 26 04:15:57 2020
leaf04 swp54 spine04 swp4 Mon Oct 26 04:15:57 2020
leaf04 swp52 spine02 swp4 Mon Oct 26 04:15:57 2020
leaf04 swp2 server05 mac:44:38:39:00:00:46 Mon Oct 26 04:15:57 2020
leaf04 swp50 leaf03 swp50 Mon Oct 26 04:15:57 2020
leaf04 swp51 spine01 swp4 Mon Oct 26 04:15:57 2020
leaf04 eth0 oob-mgmt-switch swp13 Mon Oct 26 04:15:57 2020
leaf04 swp3 server06 mac:44:38:39:00:00:48 Mon Oct 26 04:15:57 2020
leaf04 swp53 spine03 swp4 Mon Oct 26 04:15:57 2020
oob-mgmt-server eth1 oob-mgmt-switch swp1 Sun Oct 25 22:46:24 2020
server01 eth0 oob-mgmt-switch swp2 Sun Oct 25 22:51:17 2020
server01 eth1 leaf01 swp1 Sun Oct 25 22:51:17 2020
server01 eth2 leaf02 swp1 Sun Oct 25 22:51:17 2020
server02 eth0 oob-mgmt-switch swp3 Sun Oct 25 22:49:41 2020
server02 eth1 leaf01 swp2 Sun Oct 25 22:49:41 2020
server02 eth2 leaf02 swp2 Sun Oct 25 22:49:41 2020
server03 eth2 leaf02 swp3 Sun Oct 25 22:50:08 2020
server03 eth1 leaf01 swp3 Sun Oct 25 22:50:08 2020
server03 eth0 oob-mgmt-switch swp4 Sun Oct 25 22:50:08 2020
server04 eth0 oob-mgmt-switch swp5 Sun Oct 25 22:50:27 2020
server04 eth1 leaf03 swp1 Sun Oct 25 22:50:27 2020
server04 eth2 leaf04 swp1 Sun Oct 25 22:50:27 2020
server05 eth0 oob-mgmt-switch swp6 Sun Oct 25 22:49:12 2020
server05 eth1 leaf03 swp2 Sun Oct 25 22:49:12 2020
server05 eth2 leaf04 swp2 Sun Oct 25 22:49:12 2020
server06 eth0 oob-mgmt-switch swp7 Sun Oct 25 22:49:22 2020
server06 eth1 leaf03 swp3 Sun Oct 25 22:49:22 2020
server06 eth2 leaf04 swp3 Sun Oct 25 22:49:22 2020
server07 eth0 oob-mgmt-switch swp8 Sun Oct 25 22:29:58 2020
server08 eth0 oob-mgmt-switch swp9 Sun Oct 25 22:34:12 2020
spine01 swp1 leaf01 swp51 Mon Oct 26 04:13:20 2020
spine01 swp3 leaf03 swp51 Mon Oct 26 04:13:20 2020
spine01 swp2 leaf02 swp51 Mon Oct 26 04:13:20 2020
spine01 swp5 border01 swp51 Mon Oct 26 04:13:20 2020
spine01 eth0 oob-mgmt-switch swp14 Mon Oct 26 04:13:20 2020
spine01 swp4 leaf04 swp51 Mon Oct 26 04:13:20 2020
spine01 swp6 border02 swp51 Mon Oct 26 04:13:20 2020
spine02 swp4 leaf04 swp52 Mon Oct 26 04:16:26 2020
spine02 swp3 leaf03 swp52 Mon Oct 26 04:16:26 2020
spine02 swp6 border02 swp52 Mon Oct 26 04:16:26 2020
spine02 eth0 oob-mgmt-switch swp15 Mon Oct 26 04:16:26 2020
spine02 swp5 border01 swp52 Mon Oct 26 04:16:26 2020
spine02 swp2 leaf02 swp52 Mon Oct 26 04:16:26 2020
spine02 swp1 leaf01 swp52 Mon Oct 26 04:16:26 2020
spine03 swp2 leaf02 swp53 Mon Oct 26 04:13:48 2020
spine03 swp6 border02 swp53 Mon Oct 26 04:13:48 2020
spine03 swp1 leaf01 swp53 Mon Oct 26 04:13:48 2020
spine03 swp3 leaf03 swp53 Mon Oct 26 04:13:48 2020
spine03 swp4 leaf04 swp53 Mon Oct 26 04:13:48 2020
spine03 eth0 oob-mgmt-switch swp16 Mon Oct 26 04:13:48 2020
spine03 swp5 border01 swp53 Mon Oct 26 04:13:48 2020
spine04 eth0 oob-mgmt-switch swp17 Mon Oct 26 04:11:23 2020
spine04 swp3 leaf03 swp54 Mon Oct 26 04:11:23 2020
spine04 swp2 leaf02 swp54 Mon Oct 26 04:11:23 2020
spine04 swp4 leaf04 swp54 Mon Oct 26 04:11:23 2020
spine04 swp1 leaf01 swp54 Mon Oct 26 04:11:23 2020
spine04 swp5 border01 swp54 Mon Oct 26 04:11:23 2020
spine04 swp6 border02 swp54 Mon Oct 26 04:11:23 2020
View Devices with the Most Unestablished LLDP Sessions
You can identify switches and hosts that are experiencing difficulties establishing LLDP sessions; both currently and in the past, using the NetQ UI.
To view switches with the most unestablished LLDP sessions:
Open the large Network Services|All LLDP Sessions card.
Select Switches with Most Unestablished Sessions from the filter above the table.
The table content sorts by this characteristic, listing nodes with the most unestablished LLDP sessions at the top. Scroll down to view those with the fewest unestablished sessions.
Where to go next depends on what data you see, but a few options include:
Change the time period for the data to compare with a prior time. If the same switches are consistently indicating the most unestablished sessions, you might want to look more carefully at those switches using the Switches card workflow to determine probable causes. Refer to Monitor Switch Performance.
Click Show All Sessions to investigate all LLDP sessions with events in the full screen card.
View LLDP Configuration Information for a Given Device
You can view the LLDP configuration information for a given device from the NetQ UI or the NetQ CLI.
Open the full-screen Network Services|All LLDP Sessions card.
Click to filter by hostname.
Click Apply.
Run the netq show lldp command with the hostname option.
This example shows the LLDP configuration information for the leaf01 switch. The switch has a session between its swp1 interface and host server01 in the mac:44:38:39:00:00:32 interface. It also has a session between its swp2 interface and host server02 on mac:44:38:39:00:00:34 interface. And so on.
cumulus@netq-ts:~$ netq leaf01 show lldp
Matching lldp records:
Hostname Interface Peer Hostname Peer Interface Last Changed
----------------- ------------------------- ----------------- ------------------------- -------------------------
leaf01 swp1 server01 mac:44:38:39:00:00:32 Mon Oct 26 04:13:57 2020
leaf01 swp2 server02 mac:44:38:39:00:00:34 Mon Oct 26 04:13:57 2020
leaf01 swp52 spine02 swp1 Mon Oct 26 04:13:57 2020
leaf01 swp49 leaf02 swp49 Mon Oct 26 04:13:57 2020
leaf01 eth0 oob-mgmt-switch swp10 Mon Oct 26 04:13:57 2020
leaf01 swp3 server03 mac:44:38:39:00:00:36 Mon Oct 26 04:13:57 2020
leaf01 swp53 spine03 swp1 Mon Oct 26 04:13:57 2020
leaf01 swp50 leaf02 swp50 Mon Oct 26 04:13:57 2020
leaf01 swp54 spine04 swp1 Mon Oct 26 04:13:57 2020
leaf01 swp51 spine01 swp1 Mon Oct 26 04:13:57 2020
View Switches with the Most LLDP-related Alarms
Switches or hosts experiencing a large number of LLDP alarms might indicate a configuration or performance issue that needs further investigation. You can view this information using the NetQ UI or NetQ CLI.
With the NetQ UI, you can view the switches sorted by the number of LLDP alarms and then use the Switches card workflow or the Events|Alarms card workflow to gather more information about possible causes for the alarms.
To view switches with most LLDP alarms:
Open the large Network Services|All LLDP Sessions card.
Hover over the header and click .
Select Events by Most Active Device from the filter above the table.
The table content sorts by this characteristic, listing nodes with the most LLDP alarms at the top. Scroll down to view those with the fewest alarms.
Where to go next depends on what data you see, but a few options include:
Change the time period for the data to compare with a prior time. If the same switches are consistently indicating the most alarms, you might want to look more carefully at those switches using the Switches card workflow.
Click Show All Sessions to investigate all switches running LLDP sessions in the full-screen card.
To view the switches and hosts with the most LLDP alarms and informational events, run the netq show events command with the type option set to lldp, and optionally the between option set to display the events within a given time range. Count the events associated with each switch.
This example shows that no LLDP events have occurred in the last 24 hours.
cumulus@switch:~$ netq show events type lldp
No matching event records found
This example shows all LLDP events between now and 30 days ago, a total of 21 info events.
cumulus@switch:~$ netq show events type lldp between now and 30d
Matching events records:
Hostname Message Type Severity Message Timestamp
----------------- ------------------------ ---------------- ----------------------------------- -------------------------
spine02 lldp info LLDP Session with hostname spine02 Fri Oct 2 22:28:57 2020
and eth0 modified fields {"new lldp
peer osv":"4.2.1","old lldp peer os
v":"3.7.12"}
leaf04 lldp info LLDP Session with hostname leaf04 a Fri Oct 2 22:28:39 2020
nd eth0 modified fields {"new lldp
peer osv":"4.2.1","old lldp peer os
v":"3.7.12"}
border02 lldp info LLDP Session with hostname border02 Fri Oct 2 22:28:35 2020
and eth0 modified fields {"new lldp
peer osv":"4.2.1","old lldp peer os
v":"3.7.12"}
spine04 lldp info LLDP Session with hostname spine04 Fri Oct 2 22:28:35 2020
and eth0 modified fields {"new lldp
peer osv":"4.2.1","old lldp peer os
v":"3.7.12"}
server07 lldp info LLDP Session with hostname server07 Fri Oct 2 22:28:34 2020
and eth0 modified fields {"new lldp
peer osv":"4.2.1","old lldp peer os
v":"3.7.12"}
server08 lldp info LLDP Session with hostname server08 Fri Oct 2 22:28:33 2020
and eth0 modified fields {"new lldp
peer osv":"4.2.1","old lldp peer os
v":"3.7.12"}
fw2 lldp info LLDP Session with hostname fw2 and Fri Oct 2 22:28:32 2020
eth0 modified fields {"new lldp pee
r osv":"4.2.1","old lldp peer osv":
"3.7.12"}
server02 lldp info LLDP Session with hostname server02 Fri Oct 2 22:28:31 2020
and eth0 modified fields {"new lldp
peer osv":"4.2.1","old lldp peer os
v":"3.7.12"}
server03 lldp info LLDP Session with hostname server03 Fri Oct 2 22:28:28 2020
and eth0 modified fields {"new lldp
peer osv":"4.2.1","old lldp peer os
v":"3.7.12"}
border01 lldp info LLDP Session with hostname border01 Fri Oct 2 22:28:28 2020
and eth0 modified fields {"new lldp
peer osv":"4.2.1","old lldp peer os
v":"3.7.12"}
leaf03 lldp info LLDP Session with hostname leaf03 a Fri Oct 2 22:28:27 2020
nd eth0 modified fields {"new lldp
peer osv":"4.2.1","old lldp peer os
v":"3.7.12"}
fw1 lldp info LLDP Session with hostname fw1 and Fri Oct 2 22:28:23 2020
eth0 modified fields {"new lldp pee
r osv":"4.2.1","old lldp peer osv":
"3.7.12"}
server05 lldp info LLDP Session with hostname server05 Fri Oct 2 22:28:22 2020
and eth0 modified fields {"new lldp
peer osv":"4.2.1","old lldp peer os
v":"3.7.12"}
server06 lldp info LLDP Session with hostname server06 Fri Oct 2 22:28:21 2020
and eth0 modified fields {"new lldp
peer osv":"4.2.1","old lldp peer os
v":"3.7.12"}
spine03 lldp info LLDP Session with hostname spine03 Fri Oct 2 22:28:20 2020
and eth0 modified fields {"new lldp
peer osv":"4.2.1","old lldp peer os
v":"3.7.12"}
server01 lldp info LLDP Session with hostname server01 Fri Oct 2 22:28:15 2020
and eth0 modified fields {"new lldp
peer osv":"4.2.1","old lldp peer os
v":"3.7.12"}
server04 lldp info LLDP Session with hostname server04 Fri Oct 2 22:28:13 2020
and eth0 modified fields {"new lldp
peer osv":"4.2.1","old lldp peer os
v":"3.7.12"}
leaf01 lldp info LLDP Session with hostname leaf01 a Fri Oct 2 22:28:05 2020
nd eth0 modified fields {"new lldp
peer osv":"4.2.1","old lldp peer os
v":"3.7.12"}
spine01 lldp info LLDP Session with hostname spine01 Fri Oct 2 22:28:05 2020
and eth0 modified fields {"new lldp
peer osv":"4.2.1","old lldp peer os
v":"3.7.12"}
oob-mgmt-server lldp info LLDP Session with hostname oob-mgmt Fri Oct 2 22:27:54 2020
-server and eth1 modified fields {"
new lldp peer osv":"4.2.1","old lld
p peer osv":"3.7.12"}
leaf02 lldp info LLDP Session with hostname leaf02 a Fri Oct 2 22:27:39 2020
nd eth0 modified fields {"new lldp
peer osv":"4.2.1","old lldp peer os
v":"3.7.12"}
View All LLDP Events
The Network Services|All LLDP Sessions card workflow and the netq show events type lldp command enable you to view all LLDP events in a designated time period.
To view all LLDP events:
Open the Network Services|All LLDP Sessions card.
Change to the full-screen card using the card size picker.
Click the All Alarms tab.
By default, events sort by most recent to least recent.
Where to go next depends on what data you see, but a few options include:
Sort on various parameters:
by Message to determine the frequency of particular events
by Severity to determine the most critical events
by Time to find events that might have occurred at a particular time to try to correlate them with other system events
Open one of the other full-screen tabs in this flow to focus on devices or sessions
Export data to a file for use in another analytics tool by clicking and providing a name for the data file.
Return to your workbench by clicking in the top right corner.
To view all LLDP alarms, run:
netq show events [level info | level error | level warning | level critical | level debug] type lldp [between <text-time> and <text-endtime>] [json]
Use the level option to set the severity of the events to show. Use the between option to show events within a given time range.
This example shows that no LLDP events have occurred in the last three days.
cumulus@switch:~$ netq show events type lldp between now and 3d
No matching event records found
View Details About All Switches Running LLDP
You can view attributes of all switches running LLDP in your network in the full-screen card.
To view all switch details, open the Network Services|All LLDP Sessions card, and click the All Switches tab.
Use the icons above the table to select/deselect, filter, and export items in the list. Refer to Table Settings for more detail.
Return to your workbench by clicking in the top right corner.
View Details for All LLDP Sessions
You can view attributes of all LLDP sessions in your network with the NetQ UI or NetQ CLI.
To view all session details:
Open the Network Services|All LLDP Sessions card.
Change to the full-screen card using the card size picker.
Click the All Sessions tab.
Use the icons above the table to select/deselect, filter, and export items in the list. Refer to Table Settings for more detail.
Return to your workbench by clicking in the top right corner.
To view session details, run netq show lldp.
This example shows all current sessions (one per row) and the attributes associated with them.
cumulus@netq-ts:~$ netq show lldp
Matching lldp records:
Hostname Interface Peer Hostname Peer Interface Last Changed
----------------- ------------------------- ----------------- ------------------------- -------------------------
border01 swp3 fw1 swp1 Mon Oct 26 04:13:29 2020
border01 swp49 border02 swp49 Mon Oct 26 04:13:29 2020
border01 swp51 spine01 swp5 Mon Oct 26 04:13:29 2020
border01 swp52 spine02 swp5 Mon Oct 26 04:13:29 2020
border01 eth0 oob-mgmt-switch swp20 Mon Oct 26 04:13:29 2020
border01 swp53 spine03 swp5 Mon Oct 26 04:13:29 2020
border01 swp50 border02 swp50 Mon Oct 26 04:13:29 2020
border01 swp54 spine04 swp5 Mon Oct 26 04:13:29 2020
border02 swp49 border01 swp49 Mon Oct 26 04:13:11 2020
border02 swp3 fw1 swp2 Mon Oct 26 04:13:11 2020
border02 swp51 spine01 swp6 Mon Oct 26 04:13:11 2020
border02 swp54 spine04 swp6 Mon Oct 26 04:13:11 2020
border02 swp52 spine02 swp6 Mon Oct 26 04:13:11 2020
border02 eth0 oob-mgmt-switch swp21 Mon Oct 26 04:13:11 2020
border02 swp53 spine03 swp6 Mon Oct 26 04:13:11 2020
border02 swp50 border01 swp50 Mon Oct 26 04:13:11 2020
fw1 eth0 oob-mgmt-switch swp18 Mon Oct 26 04:38:03 2020
fw1 swp1 border01 swp3 Mon Oct 26 04:38:03 2020
fw1 swp2 border02 swp3 Mon Oct 26 04:38:03 2020
fw2 eth0 oob-mgmt-switch swp19 Mon Oct 26 04:46:54 2020
leaf01 swp1 server01 mac:44:38:39:00:00:32 Mon Oct 26 04:13:57 2020
leaf01 swp2 server02 mac:44:38:39:00:00:34 Mon Oct 26 04:13:57 2020
leaf01 swp52 spine02 swp1 Mon Oct 26 04:13:57 2020
leaf01 swp49 leaf02 swp49 Mon Oct 26 04:13:57 2020
leaf01 eth0 oob-mgmt-switch swp10 Mon Oct 26 04:13:57 2020
leaf01 swp3 server03 mac:44:38:39:00:00:36 Mon Oct 26 04:13:57 2020
leaf01 swp53 spine03 swp1 Mon Oct 26 04:13:57 2020
leaf01 swp50 leaf02 swp50 Mon Oct 26 04:13:57 2020
leaf01 swp54 spine04 swp1 Mon Oct 26 04:13:57 2020
leaf01 swp51 spine01 swp1 Mon Oct 26 04:13:57 2020
leaf02 swp52 spine02 swp2 Mon Oct 26 04:14:57 2020
leaf02 swp54 spine04 swp2 Mon Oct 26 04:14:57 2020
leaf02 swp2 server02 mac:44:38:39:00:00:3a Mon Oct 26 04:14:57 2020
leaf02 swp3 server03 mac:44:38:39:00:00:3c Mon Oct 26 04:14:57 2020
...
Monitor a Single LLDP Session
With NetQ, you can monitor the number of nodes running the LLDP service, view neighbor state changes, and compare with events occurring at the same time, as well as monitor the running LLDP configuration and changes to the configuration file. For an overview and how to configure LLDP in your data center network, refer to
Link Layer Discovery Protocol.
To access the single session cards, you must open the full-screen Network Services|All LLDP Sessions card, click the All Sessions tab, select the desired session, then click (Open Card).
Granularity of Data Shown Based on Time Period
On the medium and large single LLDP session cards, vertically stacked heat maps represent the status of the neighboring peers; one for peers that are reachable (neighbor detected), and one for peers that are unreachable (neighbor not detected). Depending on the time period of data on the card, the number of smaller time blocks used to indicate the status varies. A vertical stack of time blocks, one from each map, includes the results from all checks during that time. The results appear by how saturated the color is for each block. If LLDP detected all peers during that time period for the entire time block, then the top block is 100% saturated (white) and the neighbor not detected block is zero percent saturated (gray). As peers become reachable, the neighbor detected block increases in saturation, the peers that are unreachable (neighbor not detected) block is proportionally reduced in saturation. This example shows a heat map for a time period of 24 hours with the most common time periods in the table showing the resulting time blocks.
Time Period
Number of Runs
Number Time Blocks
Amount of Time in Each Block
6 hours
18
6
1 hour
12 hours
36
12
1 hour
24 hours
72
24
1 hour
1 week
504
7
1 day
1 month
2,086
30
1 day
1 quarter
7,000
13
1 week
View Session Status Summary
You can view information about a given LLDP session using the NetQ UI or NetQ CLI.
A summary of the LLDP session is available from the Network Services|LLDP Session card workflow, showing the node and its peer and current status.
To view the summary:
Open the or add the Network Services|All LLDP Sessions card.
Change to the full-screen card using the card size picker.
Click the All Sessions tab.
Select the session of interest, then click (Open Card).
Locate the medium Network Services|LLDP Session card.
Optionally, open the small Network Services|LLDP Session card to keep track of the session health.
Run the netq show lldp command with the hostname and remote-physical-interface options.
This example show the session information for the leaf02 switch on swp49 interface of the leaf01 peer.
You can view the neighbor state for a given LLDP session from the medium and large LLDP Session cards. For a given time period, you can determine the stability of the LLDP session between two devices. If you experienced connectivity issues at a particular time, you can use these cards to help verify the state of the neighbor. If the neighbor was not alive more than it was alive, you can then investigate further into possible causes.
To view the neighbor availability for a given LLDP session on the medium card:
Open the or add the Network Services|All LLDP Sessions card.
Change to the full-screen card using the card size picker.
Click the All Sessions tab.
Select the session of interest, then click (Open Card).
Locate the medium Network Services|LLDP Session card.
In this example, the heat map tells us that this LLDP session has been able to detect a neighbor for the entire time period.
From this card, you can also view the host name and interface, and the peer name and interface.
To view the neighbor availability for a given LLDP session on the large LLDP Session card:
Open a Network Services|LLDP Session card.
Hover over the card, and change to the large card using the card size picker.
From this card, you can also view the alarm and info event counts, host interface name, peer hostname, and peer interface identifying the session in more detail.
View Changes to the LLDP Service Configuration File
Each time a change is made to the configuration file for the LLDP service, NetQ logs the change and enables you to compare it with the last version using the NetQ UI. This can be useful when you are troubleshooting potential causes for alarms or sessions losing their connections.
To view the configuration file changes:
Open or add the Network Services|All LLDP Sessions card.
Switch to the full-screen card using the card size picker.
Click the All Sessions tab.
Select the session of interest, then click (Open Card).
Locate the medium Network Services|LLDP Session card.
Hover over the card, and change to the large card using the card size picker.
Hover over the card and click to open the LLDP Configuration File Evolution tab.
Select the time of interest on the left; when a change might have impacted the performance. Scroll down if needed.
Choose between the File view and the Diff view (selected option is dark; File by default).
The File view displays the content of the file for you to review.
The Diff view displays the changes between this version (on left) and the most recent version (on right) side by side. The changes are highlighted in red and green. In this example, we don’t have any changes to the file, so the same file is shown on both sides, and thus no highlighted lines.
View All LLDP Session Details
You can view attributes of all of the LLDP sessions for the devices participating in a given session with the NetQ UI and the NetQ CLI.
To view all session details:
Open or add the Network Services|All LLDP Sessions card.
Switch to the full-screen card using the card size picker.
Click the All Sessions tab.
Select the session of interest, then click (Open Card).
Locate the medium Network Services|LLDP Session card.
Hover over the card, and change to the full-screen card using the card size picker. The All LLDP Sessions tab is displayed by default.
To return to your workbench, click in the top right of the card.
Run the netq show lldp command.
This example shows all LLDP sessions in the last 24 hours.
cumulus@netq-ts:~$ netq show lldp
Matching lldp records:
Hostname Interface Peer Hostname Peer Interface Last Changed
----------------- ------------------------- ----------------- ------------------------- -------------------------
border01 swp3 fw1 swp1 Mon Oct 26 04:13:29 2020
border01 swp49 border02 swp49 Mon Oct 26 04:13:29 2020
border01 swp51 spine01 swp5 Mon Oct 26 04:13:29 2020
border01 swp52 spine02 swp5 Mon Oct 26 04:13:29 2020
border01 eth0 oob-mgmt-switch swp20 Mon Oct 26 04:13:29 2020
border01 swp53 spine03 swp5 Mon Oct 26 04:13:29 2020
border01 swp50 border02 swp50 Mon Oct 26 04:13:29 2020
border01 swp54 spine04 swp5 Mon Oct 26 04:13:29 2020
border02 swp49 border01 swp49 Mon Oct 26 04:13:11 2020
border02 swp3 fw1 swp2 Mon Oct 26 04:13:11 2020
border02 swp51 spine01 swp6 Mon Oct 26 04:13:11 2020
border02 swp54 spine04 swp6 Mon Oct 26 04:13:11 2020
border02 swp52 spine02 swp6 Mon Oct 26 04:13:11 2020
border02 eth0 oob-mgmt-switch swp21 Mon Oct 26 04:13:11 2020
border02 swp53 spine03 swp6 Mon Oct 26 04:13:11 2020
border02 swp50 border01 swp50 Mon Oct 26 04:13:11 2020
fw1 eth0 oob-mgmt-switch swp18 Mon Oct 26 04:38:03 2020
fw1 swp1 border01 swp3 Mon Oct 26 04:38:03 2020
fw1 swp2 border02 swp3 Mon Oct 26 04:38:03 2020
fw2 eth0 oob-mgmt-switch swp19 Mon Oct 26 04:46:54 2020
leaf01 swp1 server01 mac:44:38:39:00:00:32 Mon Oct 26 04:13:57 2020
leaf01 swp2 server02 mac:44:38:39:00:00:34 Mon Oct 26 04:13:57 2020
leaf01 swp52 spine02 swp1 Mon Oct 26 04:13:57 2020
leaf01 swp49 leaf02 swp49 Mon Oct 26 04:13:57 2020
leaf01 eth0 oob-mgmt-switch swp10 Mon Oct 26 04:13:57 2020
leaf01 swp3 server03 mac:44:38:39:00:00:36 Mon Oct 26 04:13:57 2020
leaf01 swp53 spine03 swp1 Mon Oct 26 04:13:57 2020
leaf01 swp50 leaf02 swp50 Mon Oct 26 04:13:57 2020
leaf01 swp54 spine04 swp1 Mon Oct 26 04:13:57 2020
leaf01 swp51 spine01 swp1 Mon Oct 26 04:13:57 2020
leaf02 swp52 spine02 swp2 Mon Oct 26 04:14:57 2020
leaf02 swp54 spine04 swp2 Mon Oct 26 04:14:57 2020
leaf02 swp2 server02 mac:44:38:39:00:00:3a Mon Oct 26 04:14:57 2020
leaf02 swp3 server03 mac:44:38:39:00:00:3c Mon Oct 26 04:14:57 2020
leaf02 swp53 spine03 swp2 Mon Oct 26 04:14:57 2020
leaf02 swp50 leaf01 swp50 Mon Oct 26 04:14:57 2020
leaf02 swp51 spine01 swp2 Mon Oct 26 04:14:57 2020
leaf02 eth0 oob-mgmt-switch swp11 Mon Oct 26 04:14:57 2020
leaf02 swp49 leaf01 swp49 Mon Oct 26 04:14:57 2020
leaf02 swp1 server01 mac:44:38:39:00:00:38 Mon Oct 26 04:14:57 2020
leaf03 swp2 server05 mac:44:38:39:00:00:40 Mon Oct 26 04:16:09 2020
leaf03 swp49 leaf04 swp49 Mon Oct 26 04:16:09 2020
leaf03 swp51 spine01 swp3 Mon Oct 26 04:16:09 2020
leaf03 swp50 leaf04 swp50 Mon Oct 26 04:16:09 2020
leaf03 swp54 spine04 swp3 Mon Oct 26 04:16:09 2020
...
spine04 swp3 leaf03 swp54 Mon Oct 26 04:11:23 2020
spine04 swp2 leaf02 swp54 Mon Oct 26 04:11:23 2020
spine04 swp4 leaf04 swp54 Mon Oct 26 04:11:23 2020
spine04 swp1 leaf01 swp54 Mon Oct 26 04:11:23 2020
spine04 swp5 border01 swp54 Mon Oct 26 04:11:23 2020
spine04 swp6 border02 swp54 Mon Oct 26 04:11:23 2020
View All Events for a Given LLDP Session
You can view all alarm and info events for the devices participating in a given session with the NetQ UI.
To view all events:
Open or add the Network Services|All LLDP Sessions card.
Switch to the full-screen card using the card size picker.
Click the All Sessions tab.
Select the session of interest, then click (Open Card).
Locate the medium Network Services|LLDP Session card.
Hover over the card, and change to the full-screen card using the card size picker.
Click the All Events tab.
Where to go next depends on what data you see, but a few options include:
Sort on other parameters:
By Message to determine the frequency of particular events.
By Severity to determine the most critical events.
By Time to find events that might have occurred at a particular time to try to correlate them with other system events.
Export data to a file by clicking .
Return to your workbench by clicking in the top right corner.
Monitor Spanning Tree Protocol
You use the Spanning Tree Protocol (STP) in Ethernet-based networks to prevent communication loops when you have redundant paths on a bridge or switch. Loops cause excessive broadcast messages greatly impacting the network performance.
With NetQ, you can view the STP topology on a bridge or switch to ensure no loops have been created using the netq show stp topology command. You can also view the topology information for a prior point in time to see if any changes occurred around then.
The syntax for the show command is:
netq <hostname> show stp topology [around <text-time>] [json]
This example shows the STP topology as viewed from the spine1 switch.
If you do not have a bridge in your configuration, the output indicates such.
Monitor VLANs
A VLAN (Virtual Local Area Network) enables devices on one or more LANs to communicate as if they were on the same network, without being physically connected. The VLAN enables network administrators to partition a network for functional or security requirements without changing physical infrastructure. For an overview and how to configure VLANs in your network, refer to Ethernet Bridging - VLANs.
With the NetQ CLI, you can view the operation of VLANs for one or all devices. You can also view the information at an earlier point in time or view changes that have occurred to the information during a specified timeframe. NetQ enables you to view basic VLAN information for your devices using the netq show vlan command. Additional show commands provide information about VLAN interfaces, MAC addresses associated with VLANs, and events.
The syntax for these commands is:
netq [<hostname>] show vlan [<1-4096>] [around <text-time>] [json]
netq show interfaces type vlan [state <remote-interface-state>] [around <text-time>] [json]
netq <hostname> show interfaces type vlan [state <remote-interface-state>] [around <text-time>] [count] [json]
netq show macs [<mac>] [vlan <1-4096>] [origin] [around <text-time>] [json]
netq <hostname> show macs [<mac>] [vlan <1-4096>] [origin | count] [around <text-time>] [json]
netq <hostname> show macs egress-port <egress-port> [<mac>] [vlan <1-4096>] [origin] [around <text-time>] [json]
netq [<hostname>] show events [level info | level error | level warning | level critical | level debug] type vlan [between <text-time> and <text-endtime>] [json]
When entering a time value, you must include a numeric value and the unit of measure:
w: weeks
d: days
h: hours
m: minutes
s: seconds
now
When using the between option, you can enter the start time (text-time) and end time (text-endtime) values as most recent first and least recent second, or vice versa. The values do not have to have the same unit of measure.
View VLAN Information for All Devices
You can view the configuration information for all VLANs in your network by running the netq show vlan command. It lists VLANs by device, and indicates any switch virtual interfaces (SVIs) configured and the last time this configuration changed.
This example shows the VLANs configured across a network based on the NVIDIA reference architecture.
cumulus@switch:~$ netq show vlan
Matching vlan records:
Hostname VLANs SVIs Last Changed
----------------- ------------------------- ------------------------- -------------------------
border01 1,10,20,30,4001-4002 Wed Oct 28 14:46:33 2020
border02 1,10,20,30,4001-4002 Wed Oct 28 14:46:33 2020
leaf01 1,10,20,30,4001-4002 10 20 30 Wed Oct 28 14:46:34 2020
leaf02 1,10,20,30,4001-4002 10 20 30 Wed Oct 28 14:46:34 2020
leaf03 1,10,20,30,4001-4002 10 20 30 Wed Oct 28 14:46:34 2020
leaf04 1,10,20,30,4001-4002 10 20 30 Wed Oct 28 14:46:34 2020
View All VLAN Information for a Given Device
You can view the configuration information for all VLANs running on a specific device using the netq <hostname> show vlan command. It lists VLANs running on the device, the ports used, whether an SVI is present, and the last time this configuration changed.
This example shows the VLANs configured on the leaf02 switch.
cumulus@switch:~$ netq leaf02 show vlan
Matching vlan records:
Hostname VLAN Ports SVI Last Changed
----------------- ------ ----------------------------------- ---- -------------------------
leaf02 20 bond2,vni20 yes Wed Oct 28 15:14:11 2020
leaf02 30 vni30,bond3 yes Wed Oct 28 15:14:11 2020
leaf02 1 peerlink no Wed Oct 28 15:14:11 2020
leaf02 10 bond1,vni10 yes Wed Oct 28 15:14:11 2020
leaf02 4001 vniRED yes Wed Oct 28 15:14:11 2020
leaf02 4002 vniBLUE yes Wed Oct 28 15:14:11 2020
View Information for a Given VLAN
You can view the configuration information for a particular VLAN using the netq show vlan <vlan-id> command. The ID must be a number between 1 and 4096.
This example shows that vlan 10 is running on the two border and four leaf switches.
cumulus@switch~$ netq show vlan 10
Matching vlan records:
Hostname VLAN Ports SVI Last Changed
----------------- ------ ----------------------------------- ---- -------------------------
border01 10 no Wed Oct 28 15:20:27 2020
border02 10 no Wed Oct 28 15:20:28 2020
leaf01 10 bond1,vni10 yes Wed Oct 28 15:20:28 2020
leaf02 10 bond1,vni10 yes Wed Oct 28 15:20:28 2020
leaf03 10 bond1,vni10 yes Wed Oct 28 15:20:29 2020
leaf04 10 bond1,vni10 yes Wed Oct 28 15:20:29 2020
View VLAN Information for a Time in the Past
You can view the VLAN configuration information across the network or for a given device at a time in the past using the around option of the netq show vlan command. This can be helpful when you think changes might have occurred.
This example shows the VLAN configuration in the last 24 hours and 30 days ago. Note that some SVIs have been removed.
cumulus@switch:~$ netq show vlan
Matching vlan records:
Hostname VLANs SVIs Last Changed
----------------- ------------------------- ------------------------- -------------------------
border01 1,10,20,30,4001-4002 Wed Oct 28 14:46:33 2020
border02 1,10,20,30,4001-4002 Wed Oct 28 14:46:33 2020
leaf01 1,10,20,30,4001-4002 10 20 30 Wed Oct 28 14:46:34 2020
leaf02 1,10,20,30,4001-4002 10 20 30 Wed Oct 28 14:46:34 2020
leaf03 1,10,20,30,4001-4002 10 20 30 Wed Oct 28 14:46:34 2020
leaf04 1,10,20,30,4001-4002 10 20 30 Wed Oct 28 14:46:34 2020
cumulus@switch:~$ netq show vlan around 30d
Matching vlan records:
Hostname VLANs SVIs Last Changed
----------------- ------------------------- ------------------------- -------------------------
border01 1,10,20,30,4001-4002 10 20 30 4001-4002 Wed Oct 28 15:25:43 2020
border02 1,10,20,30,4001-4002 10 20 30 4001-4002 Wed Oct 28 15:25:43 2020
leaf01 1,10,20,30,4001-4002 10 20 30 4001-4002 Wed Oct 28 15:25:43 2020
leaf02 1,10,20,30,4001-4002 10 20 30 4001-4002 Wed Oct 28 15:25:43 2020
leaf03 1,10,20,30,4001-4002 10 20 30 4001-4002 Wed Oct 28 15:25:43 2020
leaf04 1,10,20,30,4001-4002 10 20 30 4001-4002 Wed Oct 28 15:25:43 2020
This example shows the VLAN configuration on leaf02 in the last 24 hours and one week ago. In this case, no changes are present.
cumulus@switch:~$ netq leaf02 show vlan
Matching vlan records:
Hostname VLAN Ports SVI Last Changed
----------------- ------ ----------------------------------- ---- -------------------------
leaf02 20 bond2,vni20 yes Wed Oct 28 15:14:11 2020
leaf02 30 vni30,bond3 yes Wed Oct 28 15:14:11 2020
leaf02 1 peerlink no Wed Oct 28 15:14:11 2020
leaf02 10 bond1,vni10 yes Wed Oct 28 15:14:11 2020
leaf02 4001 vniRED yes Wed Oct 28 15:14:11 2020
leaf02 4002 vniBLUE yes Wed Oct 28 15:14:11 2020
cumulus@switch:~$ netq leaf02 show vlan around 7d
Matching vlan records:
Hostname VLAN Ports SVI Last Changed
----------------- ------ ----------------------------------- ---- -------------------------
leaf02 20 bond2,vni20 yes Wed Oct 28 15:36:39 2020
leaf02 30 vni30,bond3 yes Wed Oct 28 15:36:39 2020
leaf02 1 peerlink no Wed Oct 28 15:36:39 2020
leaf02 10 bond1,vni10 yes Wed Oct 28 15:36:39 2020
leaf02 4001 vniRED yes Wed Oct 28 15:36:39 2020
leaf02 4002 vniBLUE yes Wed Oct 28 15:36:39 2020
View VLAN Interface Information
You can view the current or past state of the interfaces associated with VLANs using the netq show interfaces command. This provides the status of the interface, its specified MTU, whether it is running over a VRF, and the last time it changed.
cumulus@switch:~$ netq show interfaces type vlan
Matching link records:
Hostname Interface Type State VRF Details Last Changed
----------------- ------------------------- ---------------- ---------- --------------- ----------------------------------- -------------------------
border01 vlan4002 vlan up BLUE MTU: 9216 Tue Oct 27 22:28:48 2020
border01 vlan4001 vlan up RED MTU: 9216 Tue Oct 27 22:28:48 2020
border01 peerlink.4094 vlan up default MTU: 9216 Tue Oct 27 22:28:48 2020
border02 vlan4002 vlan up BLUE MTU: 9216 Tue Oct 27 22:28:51 2020
border02 vlan4001 vlan up RED MTU: 9216 Tue Oct 27 22:28:51 2020
border02 peerlink.4094 vlan up default MTU: 9216 Tue Oct 27 22:28:51 2020
fw1 borderBond.20 vlan up default MTU: 9216 Tue Oct 27 22:28:25 2020
fw1 borderBond.10 vlan up default MTU: 9216 Tue Oct 27 22:28:25 2020
leaf01 vlan20 vlan up RED MTU: 9216 Tue Oct 27 22:28:42 2020
leaf01 vlan4002 vlan up BLUE MTU: 9216 Tue Oct 27 22:28:42 2020
leaf01 vlan30 vlan up BLUE MTU: 9216 Tue Oct 27 22:28:42 2020
leaf01 vlan4001 vlan up RED MTU: 9216 Tue Oct 27 22:28:42 2020
leaf01 vlan10 vlan up RED MTU: 9216 Tue Oct 27 22:28:42 2020
leaf01 peerlink.4094 vlan up default MTU: 9216 Tue Oct 27 22:28:42 2020
leaf02 vlan20 vlan up RED MTU: 9216 Tue Oct 27 22:28:51 2020
leaf02 vlan4002 vlan up BLUE MTU: 9216 Tue Oct 27 22:28:51 2020
leaf02 vlan30 vlan up BLUE MTU: 9216 Tue Oct 27 22:28:51 2020
leaf02 vlan4001 vlan up RED MTU: 9216 Tue Oct 27 22:28:51 2020
leaf02 vlan10 vlan up RED MTU: 9216 Tue Oct 27 22:28:51 2020
leaf02 peerlink.4094 vlan up default MTU: 9216 Tue Oct 27 22:28:51 2020
leaf03 vlan20 vlan up RED MTU: 9216 Tue Oct 27 22:28:23 2020
leaf03 vlan4002 vlan up BLUE MTU: 9216 Tue Oct 27 22:28:23 2020
leaf03 vlan4001 vlan up RED MTU: 9216 Tue Oct 27 22:28:23 2020
leaf03 vlan30 vlan up BLUE MTU: 9216 Tue Oct 27 22:28:23 2020
leaf03 vlan10 vlan up RED MTU: 9216 Tue Oct 27 22:28:23 2020
leaf03 peerlink.4094 vlan up default MTU: 9216 Tue Oct 27 22:28:23 2020
leaf04 vlan20 vlan up RED MTU: 9216 Tue Oct 27 22:29:06 2020
leaf04 vlan4002 vlan up BLUE MTU: 9216 Tue Oct 27 22:29:06 2020
leaf04 vlan4001 vlan up RED MTU: 9216 Tue Oct 27 22:29:06 2020
leaf04 vlan30 vlan up BLUE MTU: 9216 Tue Oct 27 22:29:06 2020
leaf04 vlan10 vlan up RED MTU: 9216 Tue Oct 27 22:29:06 2020
leaf04 peerlink.4094 vlan up default MTU: 9216 Tue Oct 27 22:29:06 2020
View the Number of VLAN Interfaces Configured
You can view the number of VLAN interfaces configured for a given device using the netq show vlan command with the hostname and count options.
This example shows the count of VLAN interfaces on the leaf02 switch in the last 24 hours.
cumulus@switch:~$ netq leaf02 show interfaces type vlan count
Count of matching link records: 6
View MAC Addresses Associated with a VLAN
You can determine the MAC addresses associated with a given VLAN using the netq show macs vlan command. The command also provides the hostnames of the devices, the egress port for the interface, whether the MAC address originated from the given device, whether it learns the MAC address from the peer (remote=yes), and the last time the configuration changed.
This example shows the MAC addresses associated with VLAN 10.
cumulus@switch:~$ netq show macs vlan 10
Matching mac records:
Origin MAC Address VLAN Hostname Egress Port Remote Last Changed
------ ------------------ ------ ----------------- ------------------------------ ------ -------------------------
yes 00:00:00:00:00:1a 10 leaf04 bridge no Tue Oct 27 22:29:07 2020
no 44:38:39:00:00:37 10 leaf04 vni10 no Tue Oct 27 22:29:07 2020
no 44:38:39:00:00:59 10 leaf04 vni10 no Tue Oct 27 22:29:07 2020
no 46:38:39:00:00:38 10 leaf04 vni10 yes Tue Oct 27 22:29:07 2020
no 44:38:39:00:00:3e 10 leaf04 bond1 no Tue Oct 27 22:29:07 2020
no 46:38:39:00:00:3e 10 leaf04 bond1 no Tue Oct 27 22:29:07 2020
yes 44:38:39:00:00:5e 10 leaf04 bridge no Tue Oct 27 22:29:07 2020
no 44:38:39:00:00:32 10 leaf04 vni10 yes Tue Oct 27 22:29:07 2020
no 44:38:39:00:00:5d 10 leaf04 peerlink no Tue Oct 27 22:29:07 2020
no 46:38:39:00:00:44 10 leaf04 bond1 no Tue Oct 27 22:29:07 2020
no 46:38:39:00:00:32 10 leaf04 vni10 yes Tue Oct 27 22:29:07 2020
yes 36:ae:d2:23:1d:8c 10 leaf04 vni10 no Tue Oct 27 22:29:07 2020
yes 00:00:00:00:00:1a 10 leaf03 bridge no Tue Oct 27 22:28:24 2020
no 44:38:39:00:00:59 10 leaf03 vni10 no Tue Oct 27 22:28:24 2020
no 44:38:39:00:00:37 10 leaf03 vni10 no Tue Oct 27 22:28:24 2020
no 46:38:39:00:00:38 10 leaf03 vni10 yes Tue Oct 27 22:28:24 2020
yes 36:99:0d:48:51:41 10 leaf03 vni10 no Tue Oct 27 22:28:24 2020
no 44:38:39:00:00:3e 10 leaf03 bond1 no Tue Oct 27 22:28:24 2020
no 44:38:39:00:00:5e 10 leaf03 peerlink no Tue Oct 27 22:28:24 2020
no 46:38:39:00:00:3e 10 leaf03 bond1 no Tue Oct 27 22:28:24 2020
no 44:38:39:00:00:32 10 leaf03 vni10 yes Tue Oct 27 22:28:24 2020
yes 44:38:39:00:00:5d 10 leaf03 bridge no Tue Oct 27 22:28:24 2020
no 46:38:39:00:00:44 10 leaf03 bond1 no Tue Oct 27 22:28:24 2020
no 46:38:39:00:00:32 10 leaf03 vni10 yes Tue Oct 27 22:28:24 2020
yes 00:00:00:00:00:1a 10 leaf02 bridge no Tue Oct 27 22:28:51 2020
no 44:38:39:00:00:59 10 leaf02 peerlink no Tue Oct 27 22:28:51 2020
yes 44:38:39:00:00:37 10 leaf02 bridge no Tue Oct 27 22:28:51 2020
no 46:38:39:00:00:38 10 leaf02 bond1 no Tue Oct 27 22:28:51 2020
no 44:38:39:00:00:3e 10 leaf02 vni10 yes Tue Oct 27 22:28:51 2020
no 46:38:39:00:00:3e 10 leaf02 vni10 yes Tue Oct 27 22:28:51 2020
no 44:38:39:00:00:5e 10 leaf02 vni10 no Tue Oct 27 22:28:51 2020
no 44:38:39:00:00:5d 10 leaf02 vni10 no Tue Oct 27 22:28:51 2020
no 44:38:39:00:00:32 10 leaf02 bond1 no Tue Oct 27 22:28:51 2020
no 46:38:39:00:00:44 10 leaf02 vni10 yes Tue Oct 27 22:28:51 2020
no 46:38:39:00:00:32 10 leaf02 bond1 no Tue Oct 27 22:28:51 2020
yes 4a:32:30:8c:13:08 10 leaf02 vni10 no Tue Oct 27 22:28:51 2020
yes 00:00:00:00:00:1a 10 leaf01 bridge no Tue Oct 27 22:28:42 2020
no 44:38:39:00:00:37 10 leaf01 peerlink no Tue Oct 27 22:28:42 2020
yes 44:38:39:00:00:59 10 leaf01 bridge no Tue Oct 27 22:28:42 2020
no 46:38:39:00:00:38 10 leaf01 bond1 no Tue Oct 27 22:28:42 2020
no 44:38:39:00:00:3e 10 leaf01 vni10 yes Tue Oct 27 22:28:43 2020
no 46:38:39:00:00:3e 10 leaf01 vni10 yes Tue Oct 27 22:28:42 2020
no 44:38:39:00:00:5e 10 leaf01 vni10 no Tue Oct 27 22:28:42 2020
no 44:38:39:00:00:5d 10 leaf01 vni10 no Tue Oct 27 22:28:42 2020
no 44:38:39:00:00:32 10 leaf01 bond1 no Tue Oct 27 22:28:43 2020
no 46:38:39:00:00:44 10 leaf01 vni10 yes Tue Oct 27 22:28:43 2020
no 46:38:39:00:00:32 10 leaf01 bond1 no Tue Oct 27 22:28:42 2020
yes 52:37:ca:35:d3:70 10 leaf01 vni10 no Tue Oct 27 22:28:42 2020
View MAC Addresses Associated with an Egress Port
You can filter information down to just the MAC addresses associated with a given VLAN on a device that use a particular egress port. Use the netq <hostname> show macs command with the egress-port and vlan options.
This example shows MAC addresses associated with the leaf02 switch and VLAN 10 that use the bridge port.
cumulus@netq-ts:~$ netq leaf02 show macs egress-port bridge vlan 10
Matching mac records:
Origin MAC Address VLAN Hostname Egress Port Remote Last Changed
------ ------------------ ------ ----------------- ------------------------------ ------ -------------------------
yes 00:00:00:00:00:1a 10 leaf02 bridge no Tue Oct 27 22:28:51 2020
yes 44:38:39:00:00:37 10 leaf02 bridge no Tue Oct 27 22:28:51 2020
View the MAC Addresses Associated with VRR Configurations
You can view all MAC addresses associated with your VRR (virtual router reflector) interface configuration using the netq show interfaces type macvlan command. This is useful for determining if the specified MAC address inside a VLAN is the same or different across your VRR configuration.
cumulus@switch:~$ netq show interfaces type macvlan
Matching mac records:
Origin MAC Address VLAN Hostname Egress Port Remote Last Changed
------ ------------------ ------ ----------------- ------------------------------ ------ -------------------------
yes 00:00:00:00:00:1a 10 leaf02 bridge no Tue Oct 27 22:28:51 2020
yes 44:38:39:00:00:37 10 leaf02 bridge no Tue Oct 27 22:28:51 2020
cumulus@netq-ts:~$ netq show interfaces type macvlan
Matching link records:
Hostname Interface Type State VRF Details Last Changed
----------------- ------------------------- ---------------- ---------- --------------- ----------------------------------- -------------------------
leaf01 vlan10-v0 macvlan up RED MAC: 00:00:00:00:00:1a, Tue Oct 27 22:28:42 2020
Mode: Private
leaf01 vlan20-v0 macvlan up RED MAC: 00:00:00:00:00:1b, Tue Oct 27 22:28:42 2020
Mode: Private
leaf01 vlan30-v0 macvlan up BLUE MAC: 00:00:00:00:00:1c, Tue Oct 27 22:28:42 2020
Mode: Private
leaf02 vlan10-v0 macvlan up RED MAC: 00:00:00:00:00:1a, Tue Oct 27 22:28:51 2020
Mode: Private
leaf02 vlan20-v0 macvlan up RED MAC: 00:00:00:00:00:1b, Tue Oct 27 22:28:51 2020
Mode: Private
leaf02 vlan30-v0 macvlan up BLUE MAC: 00:00:00:00:00:1c, Tue Oct 27 22:28:51 2020
Mode: Private
leaf03 vlan10-v0 macvlan up RED MAC: 00:00:00:00:00:1a, Tue Oct 27 22:28:23 2020
Mode: Private
leaf03 vlan20-v0 macvlan up RED MAC: 00:00:00:00:00:1b, Tue Oct 27 22:28:23 2020
Mode: Private
leaf03 vlan30-v0 macvlan up BLUE MAC: 00:00:00:00:00:1c, Tue Oct 27 22:28:23 2020
Mode: Private
leaf04 vlan10-v0 macvlan up RED MAC: 00:00:00:00:00:1a, Tue Oct 27 22:29:06 2020
Mode: Private
leaf04 vlan20-v0 macvlan up RED MAC: 00:00:00:00:00:1b, Tue Oct 27 22:29:06 2020
Mode: Private
leaf04 vlan30-v0 macvlan up BLUE MAC: 00:00:00:00:00:1c, Tue Oct 27 22:29:06 2020
View All VLAN Events
You can view all VLAN-related events using the netq show events type vlan command.
This example shows that there have been no VLAN events in the last 24 hours or the last 30 days.
cumulus@switch:~$ netq show events type vlan
No matching event records found
cumulus@switch:~$ netq show events type vlan between now and 30d
No matching event records found
Monitor MAC Addresses
A MAC (media access control) address is a layer 2 construct that uses 48 bits to uniquely identify a network interface controller (NIC) for communication within a network.
With NetQ, you can:
View MAC address across the network and for a given device, VLAN, egress port on a VLAN, and VRR
View a count of MAC addresses on a given device
View where MAC addresses have lived in the network (MAC history)
View commentary on changes to MAC addresses (MAC commentary)
View events related to MAC addresses
MAC addresses are associated with switch interfaces. They are classified as:
Origin: MAC address is owned by a particular switch, on one or more interfaces. A MAC address typically has only one origin node. The exceptions are when MLAG is configured, the MAC on the VRR interfaces for the MLAG pair is the same, and when EVPN is configured, the MAC is distributed across the layer 3 gateways.
Remote: MAC address is learned or distributed by the control plane on a tunnel interface pointing to a particular remote location. For a given MAC address and VLAN there is only one first-hop switch (or switch pair), but multiple nodes can have the same remote MAC address.
Local (not origin and not remote): MAC address is learned on a bridge and points to an interface on another switch. If the LLDP neighbor of the interface is a host, then this switch is the first-hop switch where the MAC address is learned. For a given MAC address and VLAN there is only one first-hop switch, except if the switches are part of an MLAG pair, and the interfaces on both switches form a dually or singly connected bond.
The NetQ UI provides a listing of current MAC addresses that you can filter by hostname, timestamp, MAC address, VLAN, and origin. You can sort the list by these parameters and also remote, static, and next hop.
The NetQ CLI provides the following commands:
netq show macs [<mac>] [vlan <1-4096>] [origin] [around <text-time>] [json]
netq <hostname> show macs [<mac>] [vlan <1-4096>] [origin | count] [around <text-time>] [json]
netq <hostname> show macs egress-port <egress-port> [<mac>] [vlan <1-4096>] [origin] [around <text-time>] [json]
netq [<hostname>] show mac-history <mac> [vlan <1-4096>] [diff] [between <text-time> and <text-endtime>] [listby <text-list-by>] [json]
netq [<hostname>] show mac-commentary <mac> vlan <1-4096> [between <text-time> and <text-endtime>] [json]
netq [<hostname>] show events [level info | level error | level warning | level critical | level debug] type macs [between <text-time> and <text-endtime>] [json]
When entering a time value, you must include a numeric value and the unit of measure:
w: weeks
d: days
h: hours
m: minutes
s: seconds
now
When using the between option, you can enter the start time (text-time) and end time (text-endtime) values as most recent first and least recent second, or vice versa. The values do not have to have the same unit of measure.
View MAC Addresses Networkwide
You can view all MAC addresses across your network with the NetQ UI or the NetQ CLI.
Use the netq show macs command to view all MAC addresses.
This example shows all MAC addresses in the Cumulus Networks reference topology.
cumulus@switch:~$ netq show macs
Matching mac records:
Origin MAC Address VLAN Hostname Egress Port Remote Last Changed
------ ------------------ ------ ----------------- ------------------------------ ------ -------------------------
no 46:38:39:00:00:46 20 leaf04 bond2 no Tue Oct 27 22:29:07 2020
yes 44:38:39:00:00:5e 20 leaf04 bridge no Tue Oct 27 22:29:07 2020
yes 00:00:00:00:00:1a 10 leaf04 bridge no Tue Oct 27 22:29:07 2020
yes 44:38:39:00:00:5e 4002 leaf04 bridge no Tue Oct 27 22:29:07 2020
no 44:38:39:00:00:5d 30 leaf04 peerlink no Tue Oct 27 22:29:07 2020
no 44:38:39:00:00:37 30 leaf04 vni30 no Tue Oct 27 22:29:07 2020
no 44:38:39:00:00:59 30 leaf04 vni30 no Tue Oct 27 22:29:07 2020
yes 7e:1a:b3:4f:05:b8 20 leaf04 vni20 no Tue Oct 27 22:29:07 2020
no 44:38:39:00:00:36 30 leaf04 vni30 yes Tue Oct 27 22:29:07 2020
no 44:38:39:00:00:59 20 leaf04 vni20 no Tue Oct 27 22:29:07 2020
no 44:38:39:00:00:37 20 leaf04 vni20 no Tue Oct 27 22:29:07 2020
...
yes 7a:4a:c7:bb:48:27 4001 border01 vniRED no Tue Oct 27 22:28:48 2020
yes ce:93:1d:e3:08:1b 4002 border01 vniBLUE no Tue Oct 27 22:28:48 2020
View MAC Addresses for a Given Device
You can view all MAC addresses on a given device with the NetQ UI or the NetQ CLI.
Click (main menu).
Click MACs under the Network heading.
Click and enter a hostname.
Click Apply.
This example shows all MAC address for the leaf03 switch.
Use the netq <hostname> show macs command to view MAC address on a given device.
This example shows all MAC addresses on the leaf03 switch.
cumulus@switch:~$ netq leaf03 show macs
Matching mac records:
Origin MAC Address VLAN Hostname Egress Port Remote Last Changed
------ ------------------ ------ ----------------- ------------------------------ ------ -------------------------
yes 2e:3d:b4:55:40:ba 4002 leaf03 vniBLUE no Tue Oct 27 22:28:24 2020
no 44:38:39:00:00:5e 20 leaf03 peerlink no Tue Oct 27 22:28:24 2020
no 46:38:39:00:00:46 20 leaf03 bond2 no Tue Oct 27 22:28:24 2020
yes 44:38:39:00:00:5d 4001 leaf03 bridge no Tue Oct 27 22:28:24 2020
yes 00:00:00:00:00:1a 10 leaf03 bridge no Tue Oct 27 22:28:24 2020
yes 44:38:39:00:00:5d 30 leaf03 bridge no Tue Oct 27 22:28:24 2020
yes 26:6e:54:35:3b:28 4001 leaf03 vniRED no Tue Oct 27 22:28:24 2020
no 44:38:39:00:00:37 30 leaf03 vni30 no Tue Oct 27 22:28:24 2020
no 44:38:39:00:00:59 30 leaf03 vni30 no Tue Oct 27 22:28:24 2020
yes 72:78:e6:4e:3d:4c 20 leaf03 vni20 no Tue Oct 27 22:28:24 2020
no 44:38:39:00:00:36 30 leaf03 vni30 yes Tue Oct 27 22:28:24 2020
no 44:38:39:00:00:59 20 leaf03 vni20 no Tue Oct 27 22:28:24 2020
no 44:38:39:00:00:37 20 leaf03 vni20 no Tue Oct 27 22:28:24 2020
no 44:38:39:00:00:59 10 leaf03 vni10 no Tue Oct 27 22:28:24 2020
no 44:38:39:00:00:37 10 leaf03 vni10 no Tue Oct 27 22:28:24 2020
no 46:38:39:00:00:48 30 leaf03 bond3 no Tue Oct 27 22:28:24 2020
no 46:38:39:00:00:38 10 leaf03 vni10 yes Tue Oct 27 22:28:24 2020
yes 36:99:0d:48:51:41 10 leaf03 vni10 no Tue Oct 27 22:28:24 2020
yes 1a:6e:d8:ed:d2:04 30 leaf03 vni30 no Tue Oct 27 22:28:24 2020
no 46:38:39:00:00:36 30 leaf03 vni30 yes Tue Oct 27 22:28:24 2020
no 44:38:39:00:00:5e 30 leaf03 peerlink no Tue Oct 27 22:28:24 2020
no 44:38:39:00:00:3e 10 leaf03 bond1 no Tue Oct 27 22:28:24 2020
no 44:38:39:00:00:34 20 leaf03 vni20 yes Tue Oct 27 22:28:24 2020
no 44:38:39:00:00:5e 10 leaf03 peerlink no Tue Oct 27 22:28:24 2020
no 46:38:39:00:00:3c 30 leaf03 vni30 yes Tue Oct 27 22:28:24 2020
no 46:38:39:00:00:3e 10 leaf03 bond1 no Tue Oct 27 22:28:24 2020
no 46:38:39:00:00:34 20 leaf03 vni20 yes Tue Oct 27 22:28:24 2020
no 44:38:39:00:00:42 30 leaf03 bond3 no Tue Oct 27 22:28:24 2020
yes 44:38:39:00:00:5d 4002 leaf03 bridge no Tue Oct 27 22:28:24 2020
yes 44:38:39:00:00:5d 20 leaf03 bridge no Tue Oct 27 22:28:24 2020
yes 44:38:39:be:ef:bb 4002 leaf03 bridge no Tue Oct 27 22:28:24 2020
no 44:38:39:00:00:32 10 leaf03 vni10 yes Tue Oct 27 22:28:24 2020
yes 44:38:39:00:00:5d 10 leaf03 bridge no Tue Oct 27 22:28:24 2020
yes 00:00:00:00:00:1b 20 leaf03 bridge no Tue Oct 27 22:28:24 2020
no 46:38:39:00:00:44 10 leaf03 bond1 no Tue Oct 27 22:28:24 2020
no 46:38:39:00:00:42 30 leaf03 bond3 no Tue Oct 27 22:28:24 2020
yes 44:38:39:be:ef:bb 4001 leaf03 bridge no Tue Oct 27 22:28:24 2020
yes 00:00:00:00:00:1c 30 leaf03 bridge no Tue Oct 27 22:28:24 2020
no 46:38:39:00:00:32 10 leaf03 vni10 yes Tue Oct 27 22:28:24 2020
no 44:38:39:00:00:40 20 leaf03 bond2 no Tue Oct 27 22:28:24 2020
no 46:38:39:00:00:3a 20 leaf03 vni20 yes Tue Oct 27 22:28:24 2020
no 46:38:39:00:00:40 20 leaf03 bond2 no Tue Oct 27 22:28:24 2020
View MAC Addresses Associated with a VLAN
You can determine the MAC addresses associated with a given VLAN with the NetQ UI or NetQ CLI.
Click (main menu).
Click MACs under the Network heading.
Click and enter a VLAN ID.
Click Apply.
This example shows all MAC address for VLAN 10.
Page through the listing.
Optionally, click and add the additional hostname filter to view the MAC addresses for a VLAN on a particular device.
Use the netq show macs command with the vlan option to view the MAC addresses for a given VLAN.
This example shows the MAC addresses associated with VLAN 10.
cumulus@switch:~$ netq show macs vlan 10
Matching mac records:
Origin MAC Address VLAN Hostname Egress Port Remote Last Changed
------ ------------------ ------ ----------------- ------------------------------ ------ -------------------------
yes 00:00:00:00:00:1a 10 leaf04 bridge no Tue Oct 27 22:29:07 2020
no 44:38:39:00:00:37 10 leaf04 vni10 no Tue Oct 27 22:29:07 2020
no 44:38:39:00:00:59 10 leaf04 vni10 no Tue Oct 27 22:29:07 2020
no 46:38:39:00:00:38 10 leaf04 vni10 yes Tue Oct 27 22:29:07 2020
no 44:38:39:00:00:3e 10 leaf04 bond1 no Tue Oct 27 22:29:07 2020
no 46:38:39:00:00:3e 10 leaf04 bond1 no Tue Oct 27 22:29:07 2020
yes 44:38:39:00:00:5e 10 leaf04 bridge no Tue Oct 27 22:29:07 2020
no 44:38:39:00:00:32 10 leaf04 vni10 yes Tue Oct 27 22:29:07 2020
no 44:38:39:00:00:5d 10 leaf04 peerlink no Tue Oct 27 22:29:07 2020
no 46:38:39:00:00:44 10 leaf04 bond1 no Tue Oct 27 22:29:07 2020
no 46:38:39:00:00:32 10 leaf04 vni10 yes Tue Oct 27 22:29:07 2020
yes 36:ae:d2:23:1d:8c 10 leaf04 vni10 no Tue Oct 27 22:29:07 2020
yes 00:00:00:00:00:1a 10 leaf03 bridge no Tue Oct 27 22:28:24 2020
no 44:38:39:00:00:59 10 leaf03 vni10 no Tue Oct 27 22:28:24 2020
no 44:38:39:00:00:37 10 leaf03 vni10 no Tue Oct 27 22:28:24 2020
no 46:38:39:00:00:38 10 leaf03 vni10 yes Tue Oct 27 22:28:24 2020
yes 36:99:0d:48:51:41 10 leaf03 vni10 no Tue Oct 27 22:28:24 2020
no 44:38:39:00:00:3e 10 leaf03 bond1 no Tue Oct 27 22:28:24 2020
no 44:38:39:00:00:5e 10 leaf03 peerlink no Tue Oct 27 22:28:24 2020
no 46:38:39:00:00:3e 10 leaf03 bond1 no Tue Oct 27 22:28:24 2020
no 44:38:39:00:00:32 10 leaf03 vni10 yes Tue Oct 27 22:28:24 2020
yes 44:38:39:00:00:5d 10 leaf03 bridge no Tue Oct 27 22:28:24 2020
no 46:38:39:00:00:44 10 leaf03 bond1 no Tue Oct 27 22:28:24 2020
no 46:38:39:00:00:32 10 leaf03 vni10 yes Tue Oct 27 22:28:24 2020
yes 00:00:00:00:00:1a 10 leaf02 bridge no Tue Oct 27 22:28:51 2020
no 44:38:39:00:00:59 10 leaf02 peerlink no Tue Oct 27 22:28:51 2020
yes 44:38:39:00:00:37 10 leaf02 bridge no Tue Oct 27 22:28:51 2020
no 46:38:39:00:00:38 10 leaf02 bond1 no Tue Oct 27 22:28:51 2020
no 44:38:39:00:00:3e 10 leaf02 vni10 yes Tue Oct 27 22:28:51 2020
no 46:38:39:00:00:3e 10 leaf02 vni10 yes Tue Oct 27 22:28:51 2020
no 44:38:39:00:00:5e 10 leaf02 vni10 no Tue Oct 27 22:28:51 2020
no 44:38:39:00:00:5d 10 leaf02 vni10 no Tue Oct 27 22:28:51 2020
no 44:38:39:00:00:32 10 leaf02 bond1 no Tue Oct 27 22:28:51 2020
no 46:38:39:00:00:44 10 leaf02 vni10 yes Tue Oct 27 22:28:51 2020
no 46:38:39:00:00:32 10 leaf02 bond1 no Tue Oct 27 22:28:51 2020
yes 4a:32:30:8c:13:08 10 leaf02 vni10 no Tue Oct 27 22:28:51 2020
yes 00:00:00:00:00:1a 10 leaf01 bridge no Tue Oct 27 22:28:42 2020
no 44:38:39:00:00:37 10 leaf01 peerlink no Tue Oct 27 22:28:42 2020
yes 44:38:39:00:00:59 10 leaf01 bridge no Tue Oct 27 22:28:42 2020
no 46:38:39:00:00:38 10 leaf01 bond1 no Tue Oct 27 22:28:42 2020
no 44:38:39:00:00:3e 10 leaf01 vni10 yes Tue Oct 27 22:28:43 2020
no 46:38:39:00:00:3e 10 leaf01 vni10 yes Tue Oct 27 22:28:42 2020
no 44:38:39:00:00:5e 10 leaf01 vni10 no Tue Oct 27 22:28:42 2020
no 44:38:39:00:00:5d 10 leaf01 vni10 no Tue Oct 27 22:28:42 2020
no 44:38:39:00:00:32 10 leaf01 bond1 no Tue Oct 27 22:28:43 2020
no 46:38:39:00:00:44 10 leaf01 vni10 yes Tue Oct 27 22:28:43 2020
no 46:38:39:00:00:32 10 leaf01 bond1 no Tue Oct 27 22:28:42 2020
yes 52:37:ca:35:d3:70 10 leaf01 vni10 no Tue Oct 27 22:28:42 2020
Use the netq show macs command with the hostname and vlan options to view the MAC addresses for a given VLAN on a particular device.
This example shows the MAC addresses associated with VLAN 10 on the leaf02 switch.
cumulus@switch:~$ netq leaf02 show macs vlan 10
Matching mac records:
Origin MAC Address VLAN Hostname Egress Port Remote Last Changed
------ ------------------ ------ ----------------- ------------------------------ ------ -------------------------
yes 00:00:00:00:00:1a 10 leaf02 bridge no Tue Oct 27 22:28:51 2020
no 44:38:39:00:00:59 10 leaf02 peerlink no Tue Oct 27 22:28:51 2020
yes 44:38:39:00:00:37 10 leaf02 bridge no Tue Oct 27 22:28:51 2020
no 46:38:39:00:00:38 10 leaf02 bond1 no Tue Oct 27 22:28:51 2020
no 44:38:39:00:00:3e 10 leaf02 vni10 yes Tue Oct 27 22:28:51 2020
no 46:38:39:00:00:3e 10 leaf02 vni10 yes Tue Oct 27 22:28:51 2020
no 44:38:39:00:00:5e 10 leaf02 vni10 no Tue Oct 27 22:28:51 2020
no 44:38:39:00:00:5d 10 leaf02 vni10 no Tue Oct 27 22:28:51 2020
no 44:38:39:00:00:32 10 leaf02 bond1 no Tue Oct 27 22:28:51 2020
no 46:38:39:00:00:44 10 leaf02 vni10 yes Tue Oct 27 22:28:51 2020
no 46:38:39:00:00:32 10 leaf02 bond1 no Tue Oct 27 22:28:51 2020
yes 4a:32:30:8c:13:08 10 leaf02 vni10 no Tue Oct 27 22:28:51 2020
View MAC Addresses Associated with an Egress Port
You can the MAC addresses that use a particular egress port with the NetQ UI and the NetQ CLI.
Click (main menu).
Click MACs under the Network heading.
Toggle between A-Z or Z-A order of the egress port used by a MAC address by clicking the Egress Port header.
This example shows the MAC addresses sorted in A-Z order.
Optionally, click and enter a hostname to view the MAC addresses on a particular device.
This filters the list down to only the MAC addresses for a given device. Then, toggle between A-Z or Z-A order of the egress port used by a MAC address by clicking the Egress Port header.
Use the netq <hostname> show macs egress-port <egress-port> command to view the MAC addresses on a given device that use a given egress port. Note that you cannot view this information across all devices.
This example shows MAC addresses associated with the leaf03 switch that use the bridge port for egress.
cumulus@switch:~$ netq leaf03 show macs egress-port bridge
Matching mac records:
Origin MAC Address VLAN Hostname Egress Port Remote Last Changed
------ ------------------ ------ ----------------- ------------------------------ ------ -------------------------
yes 44:38:39:00:00:5d 4001 leaf03 bridge no Tue Oct 27 22:28:24 2020
yes 00:00:00:00:00:1a 10 leaf03 bridge no Tue Oct 27 22:28:24 2020
yes 44:38:39:00:00:5d 30 leaf03 bridge no Tue Oct 27 22:28:24 2020
yes 44:38:39:00:00:5d 4002 leaf03 bridge no Tue Oct 27 22:28:24 2020
yes 44:38:39:00:00:5d 20 leaf03 bridge no Tue Oct 27 22:28:24 2020
yes 44:38:39:be:ef:bb 4002 leaf03 bridge no Tue Oct 27 22:28:24 2020
yes 44:38:39:00:00:5d 10 leaf03 bridge no Tue Oct 27 22:28:24 2020
yes 00:00:00:00:00:1b 20 leaf03 bridge no Tue Oct 27 22:28:24 2020
yes 44:38:39:be:ef:bb 4001 leaf03 bridge no Tue Oct 27 22:28:24 2020
yes 00:00:00:00:00:1c 30 leaf03 bridge no Tue Oct 27 22:28:24 2020
View MAC Addresses Associated with VRR Configurations
You can view all MAC addresses associated with your VRR (virtual router reflector) interface configuration using the netq show interfaces type macvlan command. This is useful for determining if the specified MAC address inside a VLAN is the same or different across your VRR configuration.
cumulus@switch:~$ netq show interfaces type macvlan
Matching link records:
Hostname Interface Type State VRF Details Last Changed
----------------- ------------------------- ---------------- ---------- --------------- ----------------------------------- -------------------------
leaf01 vlan10-v0 macvlan up RED MAC: 00:00:00:00:00:1a, Tue Oct 27 22:28:42 2020
Mode: Private
leaf01 vlan20-v0 macvlan up RED MAC: 00:00:00:00:00:1b, Tue Oct 27 22:28:42 2020
Mode: Private
leaf01 vlan30-v0 macvlan up BLUE MAC: 00:00:00:00:00:1c, Tue Oct 27 22:28:42 2020
Mode: Private
leaf02 vlan10-v0 macvlan up RED MAC: 00:00:00:00:00:1a, Tue Oct 27 22:28:51 2020
Mode: Private
leaf02 vlan20-v0 macvlan up RED MAC: 00:00:00:00:00:1b, Tue Oct 27 22:28:51 2020
Mode: Private
leaf02 vlan30-v0 macvlan up BLUE MAC: 00:00:00:00:00:1c, Tue Oct 27 22:28:51 2020
Mode: Private
leaf03 vlan10-v0 macvlan up RED MAC: 00:00:00:00:00:1a, Tue Oct 27 22:28:23 2020
Mode: Private
leaf03 vlan20-v0 macvlan up RED MAC: 00:00:00:00:00:1b, Tue Oct 27 22:28:23 2020
Mode: Private
leaf03 vlan30-v0 macvlan up BLUE MAC: 00:00:00:00:00:1c, Tue Oct 27 22:28:23 2020
Mode: Private
leaf04 vlan10-v0 macvlan up RED MAC: 00:00:00:00:00:1a, Tue Oct 27 22:29:06 2020
Mode: Private
leaf04 vlan20-v0 macvlan up RED MAC: 00:00:00:00:00:1b, Tue Oct 27 22:29:06 2020
Mode: Private
leaf04 vlan30-v0 macvlan up BLUE MAC: 00:00:00:00:00:1c, Tue Oct 27 22:29:06 2020
Mode: Private
View the History of a MAC Address
It is useful when debugging to be able to see whether a MAC address is learned, where it moved in the network after that, if there was a duplicate at any time, and so forth. The netq show mac-history command makes this information available. It enables you to see:
Each change made chronologically.
Changes made between two points in time, using the between option.
Only the differences in the changes between two points in time using the diff option.
The output ordered by selected output fields using the listby option.
Each change made for the MAC address on a particular VLAN, using the vlan option.
The default time range used is now to one hour ago. You can view the output in JSON format as well.
View MAC Address Changes in Chronological Order
View the full listing of changes for a MAC address for the last hour in chronological order using the netq show mac-history command.
This example shows how to view a full chronology of changes for a MAC address of 44:38:39:00:00:5d. When shown, the caret (^) notation indicates no change in this value from the row above.
cumulus@switch:~$ netq show mac-history 44:38:39:00:00:5d
Matching machistory records:
Last Changed Hostname VLAN Origin Link Destination Remote Static
------------------------- ----------------- ------ ------ ---------------- ---------------------- ------ ------------
Tue Oct 27 22:28:24 2020 leaf03 10 yes bridge no no
Tue Oct 27 22:28:42 2020 leaf01 10 no vni10 10.0.1.2 no yes
Tue Oct 27 22:28:51 2020 leaf02 10 no vni10 10.0.1.2 no yes
Tue Oct 27 22:29:07 2020 leaf04 10 no peerlink no yes
Tue Oct 27 22:28:24 2020 leaf03 4002 yes bridge no no
Tue Oct 27 22:28:24 2020 leaf03 0 yes peerlink no no
Tue Oct 27 22:28:24 2020 leaf03 20 yes bridge no no
Tue Oct 27 22:28:42 2020 leaf01 20 no vni20 10.0.1.2 no yes
Tue Oct 27 22:28:51 2020 leaf02 20 no vni20 10.0.1.2 no yes
Tue Oct 27 22:29:07 2020 leaf04 20 no peerlink no yes
Tue Oct 27 22:28:24 2020 leaf03 4001 yes bridge no no
Tue Oct 27 22:28:24 2020 leaf03 30 yes bridge no no
Tue Oct 27 22:28:42 2020 leaf01 30 no vni30 10.0.1.2 no yes
Tue Oct 27 22:28:51 2020 leaf02 30 no vni30 10.0.1.2 no yes
Tue Oct 27 22:29:07 2020 leaf04 30 no peerlink no yes
View MAC Address Changes for a Given Time Frame
View a listing of changes for a MAC address for a given timeframe using the netq show mac-history command with the between option. When shown, the caret (^) notation indicates no change in this value from the row above.
This example shows changes for a MAC address of 44:38:39:00:00:5d between now three and seven days ago.
cumulus@switch:~$ netq show mac-history 44:38:39:00:00:5d between 3d and 7d
Matching machistory records:
Last Changed Hostname VLAN Origin Link Destination Remote Static
------------------------- ----------------- ------ ------ ---------------- ---------------------- ------ ------------
Tue Oct 20 22:28:19 2020 leaf03 10 yes bridge no no
Tue Oct 20 22:28:24 2020 leaf01 10 no vni10 10.0.1.2 no yes
Tue Oct 20 22:28:37 2020 leaf02 10 no vni10 10.0.1.2 no yes
Tue Oct 20 22:28:53 2020 leaf04 10 no peerlink no yes
Wed Oct 21 22:28:19 2020 leaf03 10 yes bridge no no
Wed Oct 21 22:28:26 2020 leaf01 10 no vni10 10.0.1.2 no yes
Wed Oct 21 22:28:44 2020 leaf02 10 no vni10 10.0.1.2 no yes
Wed Oct 21 22:28:55 2020 leaf04 10 no peerlink no yes
Thu Oct 22 22:28:20 2020 leaf03 10 yes bridge no no
Thu Oct 22 22:28:28 2020 leaf01 10 no vni10 10.0.1.2 no yes
Thu Oct 22 22:28:45 2020 leaf02 10 no vni10 10.0.1.2 no yes
Thu Oct 22 22:28:57 2020 leaf04 10 no peerlink no yes
Fri Oct 23 22:28:21 2020 leaf03 10 yes bridge no no
Fri Oct 23 22:28:29 2020 leaf01 10 no vni10 10.0.1.2 no yes
Fri Oct 23 22:28:45 2020 leaf02 10 no vni10 10.0.1.2 no yes
Fri Oct 23 22:28:58 2020 leaf04 10 no peerlink no yes
Sat Oct 24 22:28:28 2020 leaf03 10 yes bridge no no
Sat Oct 24 22:28:29 2020 leaf01 10 no vni10 10.0.1.2 no yes
Sat Oct 24 22:28:45 2020 leaf02 10 no vni10 10.0.1.2 no yes
Sat Oct 24 22:28:59 2020 leaf04 10 no peerlink no yes
Tue Oct 20 22:28:19 2020 leaf03 4002 yes bridge no no
Tue Oct 20 22:28:19 2020 leaf03 0 yes peerlink no no
Tue Oct 20 22:28:19 2020 leaf03 20 yes bridge no no
Tue Oct 20 22:28:24 2020 leaf01 20 no vni20 10.0.1.2 no yes
Tue Oct 20 22:28:37 2020 leaf02 20 no vni20 10.0.1.2 no yes
Tue Oct 20 22:28:53 2020 leaf04 20 no peerlink no yes
Wed Oct 21 22:28:19 2020 leaf03 20 yes bridge no no
Wed Oct 21 22:28:26 2020 leaf01 20 no vni20 10.0.1.2 no yes
Wed Oct 21 22:28:44 2020 leaf02 20 no vni20 10.0.1.2 no yes
Wed Oct 21 22:28:55 2020 leaf04 20 no peerlink no yes
Thu Oct 22 22:28:20 2020 leaf03 20 yes bridge no no
Thu Oct 22 22:28:28 2020 leaf01 20 no vni20 10.0.1.2 no yes
Thu Oct 22 22:28:45 2020 leaf02 20 no vni20 10.0.1.2 no yes
Thu Oct 22 22:28:57 2020 leaf04 20 no peerlink no yes
Fri Oct 23 22:28:21 2020 leaf03 20 yes bridge no no
Fri Oct 23 22:28:29 2020 leaf01 20 no vni20 10.0.1.2 no yes
Fri Oct 23 22:28:45 2020 leaf02 20 no vni20 10.0.1.2 no yes
Fri Oct 23 22:28:58 2020 leaf04 20 no peerlink no yes
Sat Oct 24 22:28:28 2020 leaf03 20 yes bridge no no
Sat Oct 24 22:28:29 2020 leaf01 20 no vni20 10.0.1.2 no yes
Sat Oct 24 22:28:45 2020 leaf02 20 no vni20 10.0.1.2 no yes
Sat Oct 24 22:28:59 2020 leaf04 20 no peerlink no yes
Tue Oct 20 22:28:19 2020 leaf03 4001 yes bridge no no
Tue Oct 20 22:28:19 2020 leaf03 30 yes bridge no no
Tue Oct 20 22:28:24 2020 leaf01 30 no vni30 10.0.1.2 no yes
Tue Oct 20 22:28:37 2020 leaf02 30 no vni30 10.0.1.2 no yes
Tue Oct 20 22:28:53 2020 leaf04 30 no peerlink no yes
Wed Oct 21 22:28:19 2020 leaf03 30 yes bridge no no
Wed Oct 21 22:28:26 2020 leaf01 30 no vni30 10.0.1.2 no yes
Wed Oct 21 22:28:44 2020 leaf02 30 no vni30 10.0.1.2 no yes
Wed Oct 21 22:28:55 2020 leaf04 30 no peerlink no yes
Thu Oct 22 22:28:20 2020 leaf03 30 yes bridge no no
Thu Oct 22 22:28:28 2020 leaf01 30 no vni30 10.0.1.2 no yes
Thu Oct 22 22:28:45 2020 leaf02 30 no vni30 10.0.1.2 no yes
Thu Oct 22 22:28:57 2020 leaf04 30 no peerlink no yes
Fri Oct 23 22:28:21 2020 leaf03 30 yes bridge no no
Fri Oct 23 22:28:29 2020 leaf01 30 no vni30 10.0.1.2 no yes
Fri Oct 23 22:28:45 2020 leaf02 30 no vni30 10.0.1.2 no yes
Fri Oct 23 22:28:58 2020 leaf04 30 no peerlink no yes
Sat Oct 24 22:28:28 2020 leaf03 30 yes bridge no no
Sat Oct 24 22:28:29 2020 leaf01 30 no vni30 10.0.1.2 no yes
Sat Oct 24 22:28:45 2020 leaf02 30 no vni30 10.0.1.2 no yes
Sat Oct 24 22:28:59 2020 leaf04 30 no peerlink no yes
View Only the Differences in MAC Address Changes
Instead of viewing the full chronology of change made for a MAC address within a given timeframe, you can view only the differences between two snapshots using the netq show mac-history command with the diff option. When shown, the caret (^) notation indicates no change in this value from the row above.
This example shows only the differences in the changes for a MAC address of 44:38:39:00:00:5d between now and an hour ago.
cumulus@switch:~$ netq show mac-history 44:38:39:00:00:5d diff
Matching machistory records:
Last Changed Hostname VLAN Origin Link Destination Remote Static
------------------------- ----------------- ------ ------ ---------------- ---------------------- ------ ------------
Tue Oct 27 22:29:07 2020 leaf04 30 no peerlink no yes
This example shows only the differences in the changes for a MAC address of 44:38:39:00:00:5d between now and 30 days ago.
cumulus@switch:~$ netq show mac-history 44:38:39:00:00:5d diff between now and 30d
Matching machistory records:
Last Changed Hostname VLAN Origin Link Destination Remote Static
------------------------- ----------------- ------ ------ ---------------- ---------------------- ------ ------------
Mon Sep 28 00:02:26 2020 leaf04 30 no peerlink no no
Tue Oct 27 22:29:07 2020 leaf04 ^ ^ ^ ^ ^ yes
View MAC Address Changes by a Given Attribute
You can order the output of the MAC address changes by many of the attributes associated with the changes that you can make using the netq show mac-history command with the listby option. For example, you can order the output by hostname, link, destination, and so forth.
This example shows the history of MAC address 44:38:39:00:00:5d ordered by hostname. When shown, the caret (^) notation indicates no change in this value from the row above.
cumulus@switch:~$ netq show mac-history 44:38:39:00:00:5d listby hostname
Matching machistory records:
Last Changed Hostname VLAN Origin Link Destination Remote Static
------------------------- ----------------- ------ ------ ---------------- ---------------------- ------ ------------
Tue Oct 27 22:28:51 2020 leaf02 20 no vni20 10.0.1.2 no yes
Tue Oct 27 22:28:24 2020 leaf03 4001 yes bridge no no
Tue Oct 27 22:28:24 2020 leaf03 0 yes peerlink no no
Tue Oct 27 22:28:24 2020 leaf03 4002 yes bridge no no
Tue Oct 27 22:28:42 2020 leaf01 10 no vni10 10.0.1.2 no yes
Tue Oct 27 22:29:07 2020 leaf04 10 no peerlink no yes
Tue Oct 27 22:29:07 2020 leaf04 30 no peerlink no yes
Tue Oct 27 22:28:42 2020 leaf01 30 no vni30 10.0.1.2 no yes
Tue Oct 27 22:28:42 2020 leaf01 20 no vni20 10.0.1.2 no yes
Tue Oct 27 22:28:51 2020 leaf02 10 no vni10 10.0.1.2 no yes
Tue Oct 27 22:29:07 2020 leaf04 20 no peerlink no yes
Tue Oct 27 22:28:51 2020 leaf02 30 no vni30 10.0.1.2 no yes
Tue Oct 27 22:28:24 2020 leaf03 10 yes bridge no no
Tue Oct 27 22:28:24 2020 leaf03 20 yes bridge no no
Tue Oct 27 22:28:24 2020 leaf03 30 yes bridge no no
View MAC Address Changes for a Given VLAN
View a listing of changes for a MAC address for a given VLAN using the netq show mac-history command with the vlan option. When shown, the caret (^) notation indicates no change in this value from the row above.
This example shows changes for a MAC address of 44:38:39:00:00:5d and VLAN 10.
cumulus@switch:~$ netq show mac-history 44:38:39:00:00:5d vlan 10
Matching machistory records:
Last Changed Hostname VLAN Origin Link Destination Remote Static
------------------------- ----------------- ------ ------ ---------------- ---------------------- ------ ------------
Tue Oct 27 22:28:24 2020 leaf03 10 yes bridge no no
Tue Oct 27 22:28:42 2020 leaf01 10 no vni10 10.0.1.2 no yes
Tue Oct 27 22:28:51 2020 leaf02 10 no vni10 10.0.1.2 no yes
Tue Oct 27 22:29:07 2020 leaf04 10 no peerlink no yes
View MAC Address Commentary
You can get more descriptive information about changes to a given MAC address on a specific VLAN. Commentary is available for the following MAC address-related events based on their classification (refer to the definition of these at the beginning of this topic):
Event Triggers
Example Commentary
A MAC address is created, or the MAC address on the interface is changed via the hwaddress option in /etc/network/interface
leaf01 00:00:5e:00:00:03 configured on interface vlan1000-v0
An interface becomes a slave in, or is removed from, a bond
leaf01 00:00:5e:00:00:03 configured on interface vlan1000-v0
An interface is a bridge and it inherits a different MAC address due to a membership change
leaf01 00:00:5e:00:00:03 configured on interface vlan1000-v0
A remote MAC address is learned or installed by control plane on a tunnel interface
44:38:39:00:00:5d learned/installed on vni vni10 pointing to remote dest 10.0.1.34
A remote MAC address is flushed or expires
leaf01 44:38:39:00:00:5d is flushed or expired
A remote MAC address moves from behind one remote switch to another remote switch or becomes a local MAC address
leaf02: 00:08:00:00:aa:13 moved from remote dest 27.0.0.22 to remote dest 27.0.0.34 00:08:00:00:aa:13 moved from remote dest 27.0.0.22 to local interface hostbond2
A MAC address is learned at the first-hop switch (or MLAG switch pair)
leaf04 (and MLAG peer leaf05): 44:38:39:00:00:5d learned on first hop switch, pointing to local interface bond4
A local MAC address is flushed or expires
leaf04 (and MLAG peer leaf05) 44:38:39:00:00:5d is flushed or expires from bond4
A local MAC address moves from one interface to another interface or to another switch
leaf04: 00:08:00:00:aa:13 moved from hostbond2 to hostbond3 00:08:00:00:aa:13 moved from hostbond2 to remote dest 27.0.0.13
Click (main menu).
Click MACs under the Network heading.
Select a MAC address for the switch and VLAN of interest from the table.
Click (Open Card).
The card is added to the workbench indicated. If you want to place it on a different workbench, select it from the dropdown list.
Choose the time range to view; either:
A time starting from now and going back in time for 6 hr, 12 hrs, 24 hrs, a week, a month, or a quarter, or
Click Custom, and choose the specific start and end times
Then click Continue.
Scroll through the list on the right to see comments related to the MAC address moves and changes.
Optionally, you can filter the list by a given device:
Hover over the MAC move commentary card.
Click , and begin entering the device name. Complete the name or select it from the suggestions that appear as you type.
Click Done.
A red dot on the filter icon indicates that filtering is active. To remove the filter, click again, then click Clear Filter.
To see MAC address commentary, use the netq show mac-commentary command. The following examples show the commentary seen in common situations.
MAC Address Configured Locally
In this example, the 46:38:39:00:00:44 MAC address was configured on the VlanA-1 interface of multiple switches so we see the MAC configured commentary on all of those switches.
cumulus@server-01:~$ netq show mac-commentary 46:38:39:00:00:44 between now and 1hr
Matching mac_commentary records:
Last Updated Hostname VLAN Commentary
------------------------- ---------------- ------ --------------------------------------------------------------------------------
Mon Aug 24 2020 14:14:33 leaf11 100 leaf11: 46:38:39:00:00:44 configured on interface VlanA-1
Mon Aug 24 2020 14:15:03 leaf12 100 leaf12: 46:38:39:00:00:44 configured on interface VlanA-1
Mon Aug 24 2020 14:15:19 leaf21 100 leaf21: 46:38:39:00:00:44 configured on interface VlanA-1
Mon Aug 24 2020 14:15:40 leaf22 100 leaf22: 46:38:39:00:00:44 configured on interface VlanA-1
Mon Aug 24 2020 14:15:19 leaf21 1003 leaf21: 46:38:39:00:00:44 configured on interface VlanA-1
Mon Aug 24 2020 14:15:40 leaf22 1003 leaf22: 46:38:39:00:00:44 configured on interface VlanA-1
Mon Aug 24 2020 14:16:32 leaf02 1003 leaf02: 00:00:5e:00:01:01 configured on interface VlanA-1
MAC Address Configured on Server and Learned from a Peer
In this example, the 00:08:00:00:aa:13 MAC address was configured on server01. As a result, both leaf11 and leaf12 learned this address on the next hop interface serv01bond2 (learned locally), whereas, the leaf01 switch learned this address remotely on vx-34 (learned remotely).
cumulus@server11:~$ netq show mac-commentary 00:08:00:00:aa:13 vlan 1000 between now and 5hr
Matching mac_commentary records:
Last Updated Hostname VLAN Commentary
------------------------- ---------------- ------ --------------------------------------------------------------------------------
Tue Aug 25 2020 10:29:23 leaf12 1000 leaf12: 00:08:00:00:aa:13 learned on first hop switch interface serv01bond2
Tue Aug 25 2020 10:29:23 leaf11 1000 leaf11: 00:08:00:00:aa:13 learned on first hop switch interface serv01bond2
Tue Aug 25 2020 10:29:23 leaf01 1000 leaf01: 00:08:00:00:aa:13 learned/installed on vni vx-34 pointing to remote dest 36.0.0.24
MAC Address Removed
In this example the bridge FDB entry for the 00:02:00:00:00:a0 MAC address, interface VlanA-1, and VLAN 100 was deleted impacting leaf11 and leaf12.
cumulus@server11:~$ netq show mac-commentary 00:02:00:00:00:a0 vlan 100 between now and 5hr
Matching mac_commentary records:
Last Updated Hostname VLAN Commentary
------------------------- ---------------- ------ --------------------------------------------------------------------------------
Mon Aug 24 2020 14:14:33 leaf11 100 leaf11: 00:02:00:00:00:a0 configured on interface VlanA-1
Mon Aug 24 2020 14:15:03 leaf12 100 leaf12: 00:02:00:00:00:a0 learned on first hop switch interface peerlink-1
Tue Aug 25 2020 13:06:52 leaf11 100 leaf11: 00:02:00:00:00:a0 unconfigured on interface VlanA-1
MAC Address Moved on Server and Learned from a Peer
The MAC address on server11 changed from 00:08:00:00:aa:13. In this example, the MAC learned remotely on leaf01 is now a locally learned MAC address from its local interface swp6. Similarly, the locally learned MAC addresses on leaf11 and leaf12 are now learned from remote dest 27.0.0.22.
cumulus@server11:~$ netq show mac-commentary 00:08:00:00:aa:13 vlan 1000 between now and 5hr
Matching mac_commentary records:
Last Updated Hostname VLAN Commentary
------------------------- ---------------- ------ --------------------------------------------------------------------------------
Tue Aug 25 2020 10:29:23 leaf12 1000 leaf12: 00:08:00:00:aa:13 learned on first hop switch interface serv01bond2
Tue Aug 25 2020 10:29:23 leaf11 1000 leaf11: 00:08:00:00:aa:13 learned on first hop switch interface serv01bond2
Tue Aug 25 2020 10:29:23 leaf01 1000 leaf01: 00:08:00:00:aa:13 learned/installed on vni vx-34 pointing to remote dest 36.0.0.24
Tue Aug 25 2020 10:33:06 leaf01 1000 leaf01: 00:08:00:00:aa:13 moved from remote dest 36.0.0.24 to local interface swp6
Tue Aug 25 2020 10:33:06 leaf12 1000 leaf12: 00:08:00:00:aa:13 moved from local interface serv01bond2 to remote dest 27.0.0.22
Tue Aug 25 2020 10:33:06 leaf11 1000 leaf11: 00:08:00:00:aa:13 moved from local interface serv01bond2 to remote dest 27.0.0.22
MAC Address Learned from MLAG Pair
In this example, after the local first hop learning of the 00:02:00:00:00:1c MAC address on leaf11 and leaf12, the MLAG exchanged the learning on the dually connected interface serv01bond3.
cumulus@server11:~$ netq show mac-commentary 00:02:00:00:00:1c vlan 105 between now and 2d
Matching mac_commentary records:
Last Updated Hostname VLAN Commentary
------------------------- ---------------- ------ --------------------------------------------------------------------------------
Sun Aug 23 2020 14:13:39 leaf11 105 leaf11: 00:02:00:00:00:1c learned on first hop switch interface serv01bond3
Sun Aug 23 2020 14:14:02 leaf12 105 leaf12: 00:02:00:00:00:1c learned on first hop switch interface serv01bond3
Sun Aug 23 2020 14:14:16 leaf11 105 leaf11: 00:02:00:00:00:1c moved from interface serv01bond3 to interface serv01bond3
Sun Aug 23 2020 14:14:23 leaf12 105 leaf12: 00:02:00:00:00:1c learned on MLAG peer dually connected interface serv01bond3
Sun Aug 23 2020 14:14:37 leaf11 105 leaf11: 00:02:00:00:00:1c learned on MLAG peer dually connected interface serv01bond3
Sun Aug 23 2020 14:14:39 leaf12 105 leaf12: 00:02:00:00:00:1c moved from interface serv01bond3 to interface serv01bond3
Sun Aug 23 2020 14:53:31 leaf11 105 leaf11: 00:02:00:00:00:1c learned on MLAG peer dually connected interface serv01bond3
Mon Aug 24 2020 14:15:03 leaf12 105 leaf12: 00:02:00:00:00:1c learned on MLAG peer dually connected interface serv01bond3
MAC Address Flushed
In this example, the interface VlanA-1 associated with the 00:02:00:00:00:2d MAC address and VLAN 1008 is deleted, impacting leaf11 and leaf12.
cumulus@server11:~$ netq show mac-commentary 00:02:00:00:00:2d vlan 1008 between now and 5hr
Matching mac_commentary records:
Last Updated Hostname VLAN Commentary
------------------------- ---------------- ------ --------------------------------------------------------------------------------
Mon Aug 24 2020 14:14:33 leaf11 1008 leaf11: 00:02:00:00:00:2d learned/installed on vni vx-42 pointing to remote dest 27.0.0.22
Mon Aug 24 2020 14:15:03 leaf12 1008 leaf12: 00:02:00:00:00:2d learned/installed on vni vx-42 pointing to remote dest 27.0.0.22
Mon Aug 24 2020 14:16:03 leaf01 1008 leaf01: 00:02:00:00:00:2d learned on MLAG peer dually connected interface swp8
Tue Aug 25 2020 11:36:06 leaf11 1008 leaf11: 00:02:00:00:00:2d is flushed or expired
Tue Aug 25 2020 11:36:06 leaf11 1008 leaf11: 00:02:00:00:00:2d on vni 1008 remote dest changed to 27.0.0.22
Monitor the MLAG Service
You use Multi-Chassis Link Aggregation (MLAG) to enable a server or switch with a two-port bond (such as a link aggregation group/LAG, EtherChannel, port group or trunk) to connect those ports to different switches and operate as if they have a connection to a single, logical switch. This provides greater redundancy and greater system throughput. Dual-connected devices can create LACP bonds that contain links to each physical switch. Therefore, NetQ supports active-active links from the dual-connected devices even though each switch connects to a different physical switch. For an overview and how to configure MLAG in your network, refer to
Multi-Chassis Link Aggregation - MLAG.
MLAG or CLAG?
Other vendors refer to the Cumulus Linux implementation of MLAG as MLAG, MC-LAG or VPC. The NetQ UI uses the MLAG terminology predominantly. However, the management daemon, named clagd, and other options in the code, such as clag-id, remain for historical purposes.
NetQ enables operators to view the health of the MLAG service on a networkwide and a per session basis, giving greater insight into all aspects of the service. You accomplish this in the NetQ UI through two card workflows, one for the service and one for the session, and in the NetQ CLI with the netq show mlag command.
Any prior scripts or automation that use the older netq show clag command continue to work as the command still exists in the operating system.
Monitor the MLAG Service Networkwide
With NetQ, you can monitor MLAG performance across the network:
Network Services|All MLAG Sessions
Small: view number of nodes running MLAG service and number and distribution of alarms
Medium: view number of nodes running MLAG service, number and distribution of sessions and alarms, number of sessions with inactive backup IPs, and number of bonds with single connections
Large: view number of nodes running MLAG service, number of sessions and alarms, number of sessions with inactive backup IPs, switches with the most established/unestablished sessions, devices with the most alarms
Full-screen: view all switches, all sessions, and all alarms
netq show mlag command: view host, peer, system MAC address, state, information about the bonds, and last time each session running MLAG had a change
When entering a time value in the netq show mlag command, you must include a numeric value and the unit of measure:
w: weeks
d: days
h: hours
m: minutes
s: seconds
now
When using the between option, you can enter the start time (text-time) and end time (text-endtime) values as most recent first and least recent second, or vice versa. The values do not have to have the same unit of measure.
View Service Status Summary
You can view a summary of the MLAG service from the NetQ UI or the NetQ CLI.
To view the summary, open the small Network Services|All MLAG Sessions card. In this example, the number of devices running the MLAG service is 4 and no alarms are present.
To view MLAG service status, run netq show mlag.
This example shows the Cumulus reference topology, where MLAG is configured on the border and leaf switches. You can view host, peer, system MAC address, state, information about the bonds, and last time a change was made for each MLAG session.
cumulus@switch~$ netq show mlag
Matching clag records:
Hostname Peer SysMac State Backup #Bond #Dual Last Changed
s
----------------- ----------------- ------------------ ---------- ------ ----- ----- -------------------------
border01(P) border02 44:38:39:be:ef:ff up up 3 3 Tue Oct 27 10:50:26 2020
border02 border01(P) 44:38:39:be:ef:ff up up 3 3 Tue Oct 27 10:46:38 2020
leaf01(P) leaf02 44:38:39:be:ef:aa up up 8 8 Tue Oct 27 10:44:39 2020
leaf02 leaf01(P) 44:38:39:be:ef:aa up up 8 8 Tue Oct 27 10:52:15 2020
leaf03(P) leaf04 44:38:39:be:ef:bb up up 8 8 Tue Oct 27 10:48:07 2020
leaf04 leaf03(P) 44:38:39:be:ef:bb up up 8 8 Tue Oct 27 10:48:18 2020
View the Distribution of Sessions and Alarms
It is useful to know the number of network nodes running the MLAG protocol over a period of time, as it gives you insight into the amount of traffic associated with and breadth of use of the protocol. It is also useful to compare the number of nodes running MLAG with the alarms present at the same time to determine if there is any correlation between the issues and the ability to establish an MLAG session.
Nodes with a large number of unestablished sessions might have a misconfiguration or might be experiencing communication issues. This is visible with the NetQ UI.
To view the distribution, open the medium Network Services|All MLAG Sessions card.
This example shows the following for the last 24 hours:
Four nodes have been running the MLAG protocol with no changes in that number
Four sessions were established and remained so
No MLAG-related alarms have occurred
If there was a visual correlation between the alarms and sessions, you could dig a little deeper with the large Network Services|All MLAG Sessions card.
To view the number of switches running the MLAG service, run:
netq show mlag
Count the switches in the output.
This example shows two border and four leaf switches, for a total of six switches running the protocol. NetQ marks the device in each session acting in the primary role with (P).
cumulus@switch~$ netq show mlag
Matching clag records:
Hostname Peer SysMac State Backup #Bond #Dual Last Changed
s
----------------- ----------------- ------------------ ---------- ------ ----- ----- -------------------------
border01(P) border02 44:38:39:be:ef:ff up up 3 3 Tue Oct 27 10:50:26 2020
border02 border01(P) 44:38:39:be:ef:ff up up 3 3 Tue Oct 27 10:46:38 2020
leaf01(P) leaf02 44:38:39:be:ef:aa up up 8 8 Tue Oct 27 10:44:39 2020
leaf02 leaf01(P) 44:38:39:be:ef:aa up up 8 8 Tue Oct 27 10:52:15 2020
leaf03(P) leaf04 44:38:39:be:ef:bb up up 8 8 Tue Oct 27 10:48:07 2020
leaf04 leaf03(P) 44:38:39:be:ef:bb up up 8 8 Tue Oct 27 10:48:18 2020
View Bonds with Only a Single Link
You can determine whether there are any bonds in your MLAG configuration with only a single link, instead of the usual two, using the NetQ UI or the NetQ CLI.
Open the medium Network Services|All MLAG Sessions card.
This example shows that four bonds have single links.
Hover over the card and change to the full-screen card using the card size picker.
Click the All Sessions tab.
Browse the sessions looking for either a blank value in the Dual Bonds column, or with one or more bonds listed in the Single Bonds column, to determine whether or not the devices participating in these sessions are incorrectly configured.
Optionally, change the time period of the data on either size card to determine when the configuration might have changed from a dual to a single bond.
Run the netq show mlag command to view bonds with single links in the last 24 hours. Use the around option to view bonds with single links for a time in the past.
This example shows that no bonds have single links, because the #Bonds value equals the #Dual value for all sessions.
cumulus@switch:~$ netq show mlag
Matching clag records:
Hostname Peer SysMac State Backup #Bond #Dual Last Changed
s
----------------- ----------------- ------------------ ---------- ------ ----- ----- -------------------------
border01(P) border02 44:38:39:be:ef:ff up up 3 3 Tue Oct 27 10:50:26 2020
border02 border01(P) 44:38:39:be:ef:ff up up 3 3 Tue Oct 27 10:46:38 2020
leaf01(P) leaf02 44:38:39:be:ef:aa up up 8 8 Tue Oct 27 10:44:39 2020
leaf02 leaf01(P) 44:38:39:be:ef:aa up up 8 8 Tue Oct 27 10:52:15 2020
leaf03(P) leaf04 44:38:39:be:ef:bb up up 8 8 Tue Oct 27 10:48:07 2020
leaf04 leaf03(P) 44:38:39:be:ef:bb up up 8 8 Tue Oct 27 10:48:18 2020
This example shows that you configured more bonds 30 days ago than in the last 24 hours, but in either case, none of those bonds had single links.
cumulus@switch:~$ netq show mlag around 30d
Matching clag records:
Hostname Peer SysMac State Backup #Bond #Dual Last Changed
s
----------------- ----------------- ------------------ ---------- ------ ----- ----- -------------------------
border01(P) border02 44:38:39:be:ef:ff up up 6 6 Sun Sep 27 03:41:52 2020
border02 border01(P) 44:38:39:be:ef:ff up up 6 6 Sun Sep 27 03:34:57 2020
leaf01(P) leaf02 44:38:39:be:ef:aa up up 8 8 Sun Sep 27 03:59:25 2020
leaf02 leaf01(P) 44:38:39:be:ef:aa up up 8 8 Sun Sep 27 03:38:39 2020
leaf03(P) leaf04 44:38:39:be:ef:bb up up 8 8 Sun Sep 27 03:36:40 2020
leaf04 leaf03(P) 44:38:39:be:ef:bb up up 8 8 Sun Sep 27 03:37:59 2020
View Sessions with No Backup IP addresses Assigned
You can determine whether MLAG sessions have a backup IP address assigned and ready using the NetQ UI or NetQ CLI.
Open the medium Network Services|All MLAG Sessions card.
This example shows that non of the bonds have single links.
Hover over the card and change to the full-screen card using the card size picker.
Click the All Sessions tab.
Look for the Backup IP column to confirm the IP address assigned if assigned.
Optionally, change the time period of the data on either size card to determine when a backup IP address was added or removed.
Run netq show mlag to view the status of backup IP addresses for sessions.
This example shows that a backup IP has been configured and is currently reachable for all MLAG sessions because the Backup column indicates up.
cumulus@switch:~$ netq show mlag
Matching clag records:
Hostname Peer SysMac State Backup #Bond #Dual Last Changed
s
----------------- ----------------- ------------------ ---------- ------ ----- ----- -------------------------
border01(P) border02 44:38:39:be:ef:ff up up 3 3 Tue Oct 27 10:50:26 2020
border02 border01(P) 44:38:39:be:ef:ff up up 3 3 Tue Oct 27 10:46:38 2020
leaf01(P) leaf02 44:38:39:be:ef:aa up up 8 8 Tue Oct 27 10:44:39 2020
leaf02 leaf01(P) 44:38:39:be:ef:aa up up 8 8 Tue Oct 27 10:52:15 2020
leaf03(P) leaf04 44:38:39:be:ef:bb up up 8 8 Tue Oct 27 10:48:07 2020
leaf04 leaf03(P) 44:38:39:be:ef:bb up up 8 8 Tue Oct 27 10:48:18 2020
View Sessions with Conflicted Bonds
You can view sessions with conflicted bonds (bonds that conflict with existing bond relationships) in the NetQ UI.
To view these sessions:
Open the Network Services|All MLAG Sessions card.
Hover over the card and change to the full-screen card using the card size picker.
Click the All Sessions tab.
Scroll to the right to view the Conflicted Bonds column. Based on the value/s in that field, reconfigure MLAG accordingly, using the net add bond NCLU command or edit the /etc/network/interfaces file. Refer to Basic Configuration in the Cumulus Linux MLAG topic.
View Devices with the Most MLAG Sessions
You can view the load from MLAG on your switches using the large Network Services|All MLAG Sessions card. This data enables you to see which switches are handling the most MLAG traffic currently, validate that is what you expect based on your network design, and compare that with data from an earlier time to look for any differences.
To view switches and hosts with the most MLAG sessions:
Open the large Network Services|All MLAG Sessions card.
Select Switches with Most Sessions from the filter above the table.
The table content sorts by this characteristic, listing nodes running the most MLAG sessions at the top. Scroll down to view those with the fewest sessions.
To compare this data with the same data at a previous time:
Open another large Network Services|All MLAG Sessions card.
Move the new card next to the original card if needed.
Change the time period for the data on the new card by hovering over the card and clicking .
Select the time period that you want to compare with the current time. You can now see whether there are significant differences between this time period and the previous time period.
If the changes are unexpected, you can investigate further by looking at another timeframe, determining if more nodes are now running MLAG than previously, looking for changes in the topology, and so forth.
To determine the devices with the most sessions, run netq show mlag. Then count the sessions on each device.
In this example, there are two sessions between border01 and border02, two sessions between leaf01 and leaf02, and two session between leaf03 and leaf04. Therefore, no devices has more sessions that any other.
cumulus@switch:~$ netq show mlag
Matching clag records:
Hostname Peer SysMac State Backup #Bond #Dual Last Changed
s
----------------- ----------------- ------------------ ---------- ------ ----- ----- -------------------------
border01(P) border02 44:38:39:be:ef:ff up up 3 3 Tue Oct 27 10:50:26 2020
border02 border01(P) 44:38:39:be:ef:ff up up 3 3 Tue Oct 27 10:46:38 2020
leaf01(P) leaf02 44:38:39:be:ef:aa up up 8 8 Tue Oct 27 10:44:39 2020
leaf02 leaf01(P) 44:38:39:be:ef:aa up up 8 8 Tue Oct 27 10:52:15 2020
leaf03(P) leaf04 44:38:39:be:ef:bb up up 8 8 Tue Oct 27 10:48:07 2020
leaf04 leaf03(P) 44:38:39:be:ef:bb up up 8 8 Tue Oct 27 10:48:18 2020
View Devices with the Most Unestablished MLAG Sessions
You can identify switches that are experiencing difficulties establishing MLAG sessions; both currently and in the past, using the NetQ UI.
To view switches with the most unestablished MLAG sessions:
Open the large Network Services|All MLAG Sessions card.
Select Switches with Most Unestablished Sessions from the filter above the table.
The table content sorts by this characteristic, listing nodes with the most unestablished MLAG sessions at the top. Scroll down to view those with the fewest unestablished sessions.
Where to go next depends on what data you see, but a few options include:
Change the time period for the data to compare with a prior time. If the same switches are consistently indicating the most unestablished sessions, you might want to look more carefully at those switches using the Switches card workflow to determine probable causes. Refer to Monitor Switch Performance.
Click Show All Sessions to investigate all MLAG sessions with events in the full-screen card.
View MLAG Configuration Information for a Given Device
You can view the MLAG configuration information for a given device from the NetQ UI or the NetQ CLI.
Open the full-screen Network Services|All MLAG Sessions card.
Click to filter by hostname.
Click Apply.
The sessions with the identified device as the primary, or host device in the MLAG pair, are listed. This example shows the sessions for the leaf01 switch.
Run the netq show mlag command with the hostname option.
This example shows all sessions in which the leaf01 switch is the primary node.
cumulus@switch:~$ netq leaf01 show mlag
Matching clag records:
Hostname Peer SysMac State Backup #Bond #Dual Last Changed
s
----------------- ----------------- ------------------ ---------- ------ ----- ----- -------------------------
leaf01(P) leaf02 44:38:39:be:ef:aa up up 8 8 Tue Oct 27 10:44:39 2020
View Switches with the Most MLAG-related Alarms
Switches experiencing a large number of MLAG alarms might indicate a configuration or performance issue that needs further investigation. You can view this information using the NetQ UI or NetQ CLI.
With the NetQ UI, you can view the switches sorted by the number of MLAG alarms and then use the Switches card workflow or the Events|Alarms card workflow to gather more information about possible causes for the alarms.
To view switches with most MLAG alarms:
Open the large Network Services|All MLAG Sessions card.
Hover over the header and click .
Select Events by Most Active Device from the filter above the table.
The table content sorts by this characteristic, listing nodes with the most MLAG alarms at the top. Scroll down to view those with the fewest alarms.
Where to go next depends on what data you see, but a few options include:
Change the time period for the data to compare with a prior time. If the same switches are consistently indicating the most alarms, you might want to look more carefully at those switches using the Switches card workflow.
Click Show All Sessions to investigate all MLAG sessions with alarms in the full-screen card.
To view the switches and hosts with the most MLAG alarms and informational events, run the netq show events command with the type option set to clag, and optionally the between option set to display the events within a given time range. Count the events associated with each switch.
This example shows that no MLAG events have occurred in the last 24 hours. Note that this command still uses the clag nomenclature.
cumulus@switch:~$ netq show events type clag
No matching event records found
This example shows all MLAG events between now and 30 days ago, a total of 1 info event.
cumulus@switch:~$ netq show events type clag between now and 30d
Matching events records:
Hostname Message Type Severity Message Timestamp
----------------- ------------------------ ---------------- ----------------------------------- -------------------------
border02 clag info Peer state changed to up Fri Oct 2 22:39:28 2020
View All MLAG Events
The Network Services|All MLAG Sessions card workflow and the netq show events type mlag command enable you to view all MLAG events in a designated time period.
To view all MLAG events:
Open the Network Services|All MLAG Sessions card.
Change to the full-screen card using the card size picker.
Click All Alarms tab.
By default, events sort by most recent to least recent.
Where to go next depends on what data you see, but a few options include:
Sort on various parameters:
By Message to determine the frequency of particular events.
By Severity to determine the most critical events.
By Time to find events that might have occurred at a particular time to try to correlate them with other system events.
Export the data to a file for use in another analytics tool by clicking .
Return to your workbench by clicking in the top right corner.
To view all MLAG alarms, run:
netq show events [level info | level error | level warning | level critical | level debug] type clag [between <text-time> and <text-endtime>] [json]
Use the level option to set the severity of the events to show. Use the between option to show events within a given time range.
This example shows that no MLAG events have occurred in the last three days.
cumulus@switch:~$ netq show events type clag between now and 3d
No matching event records found
This example shows that one MLAG event occurred in the last 30 days.
cumulus@switch:~$ netq show events type clag between now and 30d
Matching events records:
Hostname Message Type Severity Message Timestamp
----------------- ------------------------ ---------------- ----------------------------------- -------------------------
border02 clag info Peer state changed to up Fri Oct 2 22:39:28 2020
View Details About All Switches Running MLAG
You can view attributes of all switches running MLAG in your network in the full-screen card.
To view all switch details:
Open the Network Services|All MLAG Sessions card.
Change to the full-screen card using the card size picker.
Click the All Switches tab.
Use the icons above the table to select/deselect, filter, and export items in the list. Refer to Table Settings for more detail.
To return to your workbench, click in the top right corner.
View Details for All MLAG Sessions
You can view attributes of all MLAG sessions in your network
with the NetQ UI or NetQ CLI.
To view all session details:
Open the Network Services|All MLAG Sessions card.
Change to the full-screen card using the card size picker.
Click the All Sessions tab.
Use the icons above the table to select/deselect, filter, and export items in the list. Refer to Table Settings for more detail.
Return to your workbench by clicking in the top right corner.
To view session details, run netq show mlag.
This example shows all current sessions (one per row) and the attributes associated with them.
cumulus@switch:~$ netq show mlag
Matching clag records:
Hostname Peer SysMac State Backup #Bond #Dual Last Changed
s
----------------- ----------------- ------------------ ---------- ------ ----- ----- -------------------------
border01(P) border02 44:38:39:be:ef:ff up up 3 3 Tue Oct 27 10:50:26 2020
border02 border01(P) 44:38:39:be:ef:ff up up 3 3 Tue Oct 27 10:46:38 2020
leaf01(P) leaf02 44:38:39:be:ef:aa up up 8 8 Tue Oct 27 10:44:39 2020
leaf02 leaf01(P) 44:38:39:be:ef:aa up up 8 8 Tue Oct 27 10:52:15 2020
leaf03(P) leaf04 44:38:39:be:ef:bb up up 8 8 Tue Oct 27 10:48:07 2020
leaf04 leaf03(P) 44:38:39:be:ef:bb up up 8 8 Tue Oct 27 10:48:18 2020
Monitor a Single MLAG Session
With NetQ, you can monitor the number of nodes running the MLAG service, view switches with the most peers alive and not alive, and view alarms triggered by the MLAG service. For an overview and how to configure MLAG in your data center network, refer to
Multi-Chassis Link Aggregation - MLAG.
To access the single session cards, you must open the full-screen Network Services|All MLAG Sessions card, click the All Sessions tab, select the desired session, then click (Open Card).
Granularity of Data Shown Based on Time Period
On the medium and large single MLAG session cards, vertically stacked heat maps represent the status of the peers; one for peers that are reachable (alive), and one for peers that are unreachable (not alive). Depending on the time period of data on the card, the number of smaller time blocks used to indicate the status varies. A vertical stack of time blocks, one from each map, includes the results from all checks during that time. The amount of saturation for each block indicates how many peers were alive. If all peers during that time period were alive for the entire time block, then the top block is 100% saturated (white) and the not alive block is zero percent saturated (gray). As peers that are not alive increase in saturation, the amount of saturation diminishes proportionally for peers that are in the alive block. The example below shows a heat map for a time period of 24 hours with the most common time periods in the table showing the resulting time blocks.
Time Period
Number of Runs
Number Time Blocks
Amount of Time in Each Block
6 hours
18
6
1 hour
12 hours
36
12
1 hour
24 hours
72
24
1 hour
1 week
504
7
1 day
1 month
2,086
30
1 day
1 quarter
7,000
13
1 week
View Session Status Summary
A summary of the MLAG session is available about a given MLAG session using the NetQ UI or NetQ CLI.
A summary of the MLAG session is available from the Network Services|MLAG Session card workflow, showing the host and peer devices participating in the session, node role, peer role and state, the associated system MAC address, and the distribution of the MLAG session state.
To view the summary:
Open or add the Network Services|All MLAG Sessions card.
Change to the full-screen card using the card size picker.
Click the All Sessions tab.
Select the session of interest, then click (Open Card).
Locate the medium Network Services|MLAG Session card.
In the left example, we see that the tor1 switch plays the secondary role in this session with the switch at 44:38:39:ff:01:01 and that there is an issue with this session. In the right example, we see that the leaf03 switch plays the primary role in this session with leaf04 and this session is in good health.
Optionally, open the small Network Services|MLAG Session card to keep track of the session health.
Run the netq show mlag command with the hostname option.
This example shows the session information when the leaf01 switch is acting as the primary role in the session.
cumulus@switch:~$ netq leaf01 show mlag
Matching clag records:
Hostname Peer SysMac State Backup #Bond #Dual Last Changed
s
----------------- ----------------- ------------------ ---------- ------ ----- ----- -------------------------
leaf01(P) leaf02 44:38:39:be:ef:aa up up 8 8 Tue Oct 27 10:44:39 2020
View MLAG Session Peering State Changes
You can view the peering state for a given MLAG session from the medium and large MLAG Session cards. For a given time period, you can determine the stability of the MLAG session between two devices. If you experienced connectivity issues at a particular time, you can use these cards to help verify the state of the peer. If the peer was not alive more than it was alive, you can then investigate further into possible causes.
To view the state transitions for a given MLAG session on the medium card:
Open the or add the Network Services|All MLAG Sessions card.
Change to the full-screen card using the card size picker.
Click the All Sessions tab.
Select the session of interest, then click (Open Card).
Locate the medium Network Services|MLAG Session card.
In this example, the heat map tells us that the peer switch has been alive for the entire 24-hour period.
From this card, you can also view the node role, peer role and state, and MLAG system MAC address which identify the session in more detail.
To view the peering state transitions for a given MLAG session on the large Network Services|MLAG Session card:
Open a Network Services|MLAG Session card.
Hover over the card, and change to the large card using the card size picker.
From this card, you can also view the alarm and info event counts, node role, peer role, state, and interface, MLAG system MAC address, active backup IP address, single, dual, conflicted, and protocol down bonds, and the VXLAN anycast address identifying the session in more detail.
View Changes to the MLAG Service Configuration File
Each time a change is made to the configuration file for the MLAG service, NetQ logs the change and enables you to compare it with the last version using the NetQ UI. This can be useful when you are troubleshooting potential causes for alarms or sessions losing their connections.
To view the configuration file changes:
Open or add the Network Services|All MLAG Sessions card.
Switch to the full-screen card using the card size picker.
Click the All Sessions tab.
Select the session of interest, then click (Open Card).
Locate the medium Network Services|MLAG Session card.
Hover over the card, and change to the large card using the card size picker.
Hover over the card and click to open the Configuration File Evolution tab.
Select the time of interest on the left; when a change might have impacted the performance. Scroll down if needed.
Choose between the File view and the Diff view (selected option is dark; File by default).
The File view displays the content of the file for you to review.
The Diff view displays the changes between this version (on left) and the most recent version (on right) side by side. The changes are highlighted in red and green. In this example, we don’t have any changes after this first creation, so the same file is shown on both sides and no highlighting is present.
All MLAG Session Details
You can view attributes of all of the MLAG sessions for the devices participating in a given session with the NetQ UI and the NetQ CLI.
To view all session details:
Open or add the Network Services|All MLAG Sessions card.
Switch to the full-screen card using the card size picker.
Click the All Sessions tab.
Select the session of interest, then click (Open Card).
Locate the medium Network Services|MLAG Session card.
Hover over the card, and change to the full-screen card using the card size picker. The All MLAG Sessions tab is displayed by default.
Where to go next depends on what data you see, but a few options include:
Open the All Events tabs to look more closely at the alarm and info events fin the network.
Sort on other parameters:
By Single Bonds to determine which interface sets are only connected to one of the switches.
By Backup IP and Backup IP Active to determine if the correct backup IP address is specified for the service.
Export the data to a file by clicking .
Return to your workbench by clicking in the top right corner.
Run the netq show mlag command.
This example shows all MLAG sessions in the last 24 hours.
cumulus@switch:~$ netq show mlag
Matching clag records:
Hostname Peer SysMac State Backup #Bond #Dual Last Changed
s
----------------- ----------------- ------------------ ---------- ------ ----- ----- -------------------------
border01(P) border02 44:38:39:be:ef:ff up up 3 3 Tue Oct 27 10:50:26 2020
border02 border01(P) 44:38:39:be:ef:ff up up 3 3 Tue Oct 27 10:46:38 2020
leaf01(P) leaf02 44:38:39:be:ef:aa up up 8 8 Tue Oct 27 10:44:39 2020
leaf02 leaf01(P) 44:38:39:be:ef:aa up up 8 8 Tue Oct 27 10:52:15 2020
leaf03(P) leaf04 44:38:39:be:ef:bb up up 8 8 Tue Oct 27 10:48:07 2020
leaf04 leaf03(P) 44:38:39:be:ef:bb up up 8 8 Tue Oct 27 10:48:18 2020
View All MLAG Session Events
You can view all alarm and info events for the two devices on this card.
Open or add the Network Services|All MLAG Sessions card.
Switch to the full-screen card using the card size picker.
Click the All Sessions tab.
Select the session of interest, then click (Open Card).
Locate the medium Network Services|MLAG Session card.
Hover over the card, and change to the full-screen card using the card size picker.
Click the All Events tab.
Where to go next depends on what data you see, but a few options include:
Sort on other parameters:
By Message to determine the frequency of particular events.
By Severity to determine the most critical events.
By Time to find events that might have occurred at a particular time to try to correlate them with other system events.
Export the data to a file by clicking .
Return to your workbench by clicking in the top right corner.
Monitor Network Layer Protocols and Services
The core capabilities of NetQ enable you to monitor your network by viewing performance and configuration data about your individual network devices and the entire fabric networkwide. The topics contained in this section describe monitoring tasks that apply across the entire network. For device-specific monitoring refer to Monitor Devices.
Monitor Internet Protocol Service
With NetQ, a user can monitor IP (Internet Protocol) addresses, neighbors, and routes, including viewing the current status and the status an earlier point in time.
It helps answer questions such as:
Who are the IP neighbors for each switch?
How many IPv4 and IPv6 addresses am I using in total and on which interface?
Which routes are owned by which switches?
When did changes occur to my IP configuration?
You use the netq show ip command to obtain the address, neighbor, and route information from the devices. Its syntax is:
netq <hostname> show ip addresses [<remote-interface>] [<ipv4>|<ipv4/prefixlen>] [vrf <vrf>] [around <text-time>] [count] [json]
netq [<hostname>] show ip addresses [<remote-interface>] [<ipv4>|<ipv4/prefixlen>] [vrf <vrf>] [around <text-time>] [json]
netq show ip addresses [<remote-interface>] [<ipv4>|<ipv4/prefixlen>] [vrf <vrf>] [subnet|supernet|gateway] [around <text-time>] [json]
netq <hostname> show ip neighbors [<remote-interface>] [<ipv4>|<ipv4> vrf <vrf>|vrf <vrf>] [<mac>] [around <text-time>] [json]
netq [<hostname>] show ip neighbors [<remote-interface>] [<ipv4>|<ipv4> vrf <vrf>|vrf <vrf>] [<mac>] [around <text-time>] [count] [json]
netq <hostname> show ip routes [<ipv4>|<ipv4/prefixlen>] [vrf <vrf>] [origin] [around <text-time>] [count] [json]
netq [<hostname>] show ip routes [<ipv4>|<ipv4/prefixlen>] [vrf <vrf>] [origin] [around <text-time>] [json]
netq <hostname> show ipv6 addresses [<remote-interface>] [<ipv6>|<ipv6/prefixlen>] [vrf <vrf>] [around <text-time>] [count] [json]
netq [<hostname>] show ipv6 addresses [<remote-interface>] [<ipv6>|<ipv6/prefixlen>] [vrf <vrf>] [around <text-time>] [json]
netq show ipv6 addresses [<remote-interface>] [<ipv6>|<ipv6/prefixlen>] [vrf <vrf>] [subnet|supernet|gateway] [around <text-time>] [json]
netq <hostname> show ipv6 neighbors [<remote-interface>] [<ipv6>|<ipv6> vrf <vrf>|vrf <vrf>] [<mac>] [around <text-time>] [count] [json]
netq [<hostname>] show ipv6 neighbors [<remote-interface>] [<ipv6>|<ipv6> vrf <vrf>|vrf <vrf>] [<mac>] [around <text-time>] [json]
netq <hostname> show ipv6 routes [<ipv6>|<ipv6/prefixlen>] [vrf <vrf>] [origin] [around <text-time>] [count] [json]
netq [<hostname>] show ipv6 routes [<ipv6>|<ipv6/prefixlen>] [vrf <vrf>] [origin] [around <text-time>] [json]
When entering a time value, you must include a numeric value and the unit of measure:
w: weeks
d: days
h: hours
m: minutes
s: seconds
now
For the between option, you can enter the start (text-time) and end time (text-endtime) values as most recent first and least recent second, or vice versa. The values do not have to have the same unit of measure.
View IP Address Information
You can view the IPv4 and IPv6 address information for all your devices, including the interface and VRF for each device. Additionally, you can:
View the information at an earlier point in time
Filter against a particular device, interface or VRF assignment
Obtain a count of all addresses
Each of these provides information for troubleshooting potential configuration and communication issues at the layer 3 level.
View IPv4 Address Information for All Devices
To view only IPv4 addresses, run netq show ip addresses. This example shows all IPv4 addresses in the reference topology.
cumulus@switch:~$ netq show ip addresses
Matching address records:
Address Hostname Interface VRF Last Changed
------------------------- ----------------- ------------------------- --------------- -------------------------
10.10.10.104/32 spine04 lo default Mon Oct 19 22:28:23 2020
192.168.200.24/24 spine04 eth0 Tue Oct 20 15:46:20 2020
10.10.10.103/32 spine03 lo default Mon Oct 19 22:29:01 2020
192.168.200.23/24 spine03 eth0 Tue Oct 20 15:19:24 2020
192.168.200.22/24 spine02 eth0 Tue Oct 20 15:40:03 2020
10.10.10.102/32 spine02 lo default Mon Oct 19 22:28:45 2020
192.168.200.21/24 spine01 eth0 Tue Oct 20 15:59:36 2020
10.10.10.101/32 spine01 lo default Mon Oct 19 22:28:48 2020
192.168.200.38/24 server08 eth0 default Mon Oct 19 22:28:50 2020
192.168.200.37/24 server07 eth0 default Mon Oct 19 22:28:43 2020
192.168.200.36/24 server06 eth0 default Mon Oct 19 22:40:52 2020
10.1.20.105/24 server05 uplink default Mon Oct 19 22:41:08 2020
10.1.10.104/24 server04 uplink default Mon Oct 19 22:40:45 2020
192.168.200.33/24 server03 eth0 default Mon Oct 19 22:41:04 2020
192.168.200.32/24 server02 eth0 default Mon Oct 19 22:41:00 2020
10.1.10.101/24 server01 uplink default Mon Oct 19 22:40:36 2020
10.255.1.228/24 oob-mgmt-server vagrant default Mon Oct 19 22:28:20 2020
192.168.200.1/24 oob-mgmt-server eth1 default Mon Oct 19 22:28:20 2020
10.1.20.3/24 leaf04 vlan20 RED Mon Oct 19 22:28:47 2020
10.1.10.1/24 leaf04 vlan10-v0 RED Mon Oct 19 22:28:47 2020
192.168.200.14/24 leaf04 eth0 Tue Oct 20 15:56:40 2020
10.10.10.4/32 leaf04 lo default Mon Oct 19 22:28:47 2020
10.1.20.1/24 leaf04 vlan20-v0 RED Mon Oct 19 22:28:47 2020
...
View IPv6 Address Information for All Devices
To view only IPv6 addresses, run netq show ipv6 addresses. This example shows all IPv6 addresses in the reference topology.
cumulus@switch:~$ netq show ipv6 addresses
Matching address records:
Address Hostname Interface VRF Last Changed
------------------------- ----------------- ------------------------- --------------- -------------------------
fe80::4638:39ff:fe00:16c/ spine04 eth0 Mon Oct 19 22:28:23 2020
64
fe80::4638:39ff:fe00:27/6 spine04 swp5 default Mon Oct 19 22:28:23 2020
4
fe80::4638:39ff:fe00:2f/6 spine04 swp6 default Mon Oct 19 22:28:23 2020
4
fe80::4638:39ff:fe00:17/6 spine04 swp3 default Mon Oct 19 22:28:23 2020
4
fe80::4638:39ff:fe00:1f/6 spine04 swp4 default Mon Oct 19 22:28:23 2020
4
fe80::4638:39ff:fe00:7/64 spine04 swp1 default Mon Oct 19 22:28:23 2020
fe80::4638:39ff:fe00:f/64 spine04 swp2 default Mon Oct 19 22:28:23 2020
fe80::4638:39ff:fe00:2d/6 spine03 swp6 default Mon Oct 19 22:29:01 2020
4
fe80::4638:39ff:fe00:25/6 spine03 swp5 default Mon Oct 19 22:29:01 2020
4
fe80::4638:39ff:fe00:170/ spine03 eth0 Mon Oct 19 22:29:01 2020
64
fe80::4638:39ff:fe00:15/6 spine03 swp3 default Mon Oct 19 22:29:01 2020
4
...
Filter IP Address Information
You can filter the IP address information by hostname, interface, or VRF.
This example shows the IPv4 address information for the eth0 interface on all devices.
cumulus@switch:~$ netq show ip addresses eth0
Matching address records:
Address Hostname Interface VRF Last Changed
------------------------- ----------------- ------------------------- --------------- -------------------------
192.168.200.24/24 spine04 eth0 Tue Oct 20 15:46:20 2020
192.168.200.23/24 spine03 eth0 Tue Oct 20 15:19:24 2020
192.168.200.22/24 spine02 eth0 Tue Oct 20 15:40:03 2020
192.168.200.21/24 spine01 eth0 Tue Oct 20 15:59:36 2020
192.168.200.38/24 server08 eth0 default Mon Oct 19 22:28:50 2020
192.168.200.37/24 server07 eth0 default Mon Oct 19 22:28:43 2020
192.168.200.36/24 server06 eth0 default Mon Oct 19 22:40:52 2020
192.168.200.35/24 server05 eth0 default Mon Oct 19 22:41:08 2020
192.168.200.34/24 server04 eth0 default Mon Oct 19 22:40:45 2020
192.168.200.33/24 server03 eth0 default Mon Oct 19 22:41:04 2020
192.168.200.32/24 server02 eth0 default Mon Oct 19 22:41:00 2020
192.168.200.31/24 server01 eth0 default Mon Oct 19 22:40:36 2020
192.168.200.14/24 leaf04 eth0 Tue Oct 20 15:56:40 2020
192.168.200.13/24 leaf03 eth0 Tue Oct 20 15:40:56 2020
192.168.200.12/24 leaf02 eth0 Tue Oct 20 15:43:24 2020
192.168.200.11/24 leaf01 eth0 Tue Oct 20 16:12:00 2020
192.168.200.62/24 fw2 eth0 Tue Oct 20 15:31:29 2020
192.168.200.61/24 fw1 eth0 Tue Oct 20 15:56:03 2020
192.168.200.64/24 border02 eth0 Tue Oct 20 15:20:23 2020
192.168.200.63/24 border01 eth0 Tue Oct 20 15:46:57 2020
This example shows the IPv6 address information for the leaf01 switch.
cumulus@switch:~$ netq leaf01 show ipv6 addresses
Matching address records:
Address Hostname Interface VRF Last Changed
------------------------- ----------------- ------------------------- --------------- -------------------------
fe80::4638:39ff:febe:efaa leaf01 vlan4002 BLUE Mon Oct 19 22:28:22 2020
/64
fe80::4638:39ff:fe00:8/64 leaf01 swp54 default Mon Oct 19 22:28:22 2020
fe80::4638:39ff:fe00:59/6 leaf01 vlan10 RED Mon Oct 19 22:28:22 2020
4
fe80::4638:39ff:fe00:59/6 leaf01 vlan20 RED Mon Oct 19 22:28:22 2020
4
fe80::4638:39ff:fe00:59/6 leaf01 vlan30 BLUE Mon Oct 19 22:28:22 2020
4
fe80::4638:39ff:fe00:2/64 leaf01 swp51 default Mon Oct 19 22:28:22 2020
fe80::4638:39ff:fe00:4/64 leaf01 swp52 default Mon Oct 19 22:28:22 2020
fe80::4638:39ff:febe:efaa leaf01 vlan4001 RED Mon Oct 19 22:28:22 2020
/64
fe80::4638:39ff:fe00:6/64 leaf01 swp53 default Mon Oct 19 22:28:22 2020
fe80::200:ff:fe00:1c/64 leaf01 vlan30-v0 BLUE Mon Oct 19 22:28:22 2020
fe80::200:ff:fe00:1b/64 leaf01 vlan20-v0 RED Mon Oct 19 22:28:22 2020
fe80::200:ff:fe00:1a/64 leaf01 vlan10-v0 RED Mon Oct 19 22:28:22 2020
fe80::4638:39ff:fe00:59/6 leaf01 peerlink.4094 default Mon Oct 19 22:28:22 2020
4
fe80::4638:39ff:fe00:59/6 leaf01 bridge default Mon Oct 19 22:28:22 2020
4
fe80::4638:39ff:fe00:17a/ leaf01 eth0 Mon Oct 19 22:28:22 2020
64
View When IP Address Information Last Changed
You can view the last time that address information changed using the netq show ip/ipv6 addresses commands.
This example shows the last time IPv4 address information changed for all devices ago. Note the value in the Last Changed column.
cumulus@switch:~$ netq show ip addresses
Matching address records:
Address Hostname Interface VRF Last Changed
------------------------- ----------------- ------------------------- --------------- -------------------------
10.10.10.104/32 spine04 lo default Mon Oct 12 22:28:12 2020
192.168.200.24/24 spine04 eth0 Tue Oct 13 15:59:37 2020
10.10.10.103/32 spine03 lo default Mon Oct 12 22:28:23 2020
192.168.200.23/24 spine03 eth0 Tue Oct 13 15:33:03 2020
192.168.200.22/24 spine02 eth0 Tue Oct 13 16:08:11 2020
10.10.10.102/32 spine02 lo default Mon Oct 12 22:28:30 2020
192.168.200.21/24 spine01 eth0 Tue Oct 13 15:47:16 2020
10.10.10.101/32 spine01 lo default Mon Oct 12 22:28:03 2020
192.168.200.38/24 server08 eth0 default Mon Oct 12 22:28:41 2020
192.168.200.37/24 server07 eth0 default Mon Oct 12 22:28:37 2020
192.168.200.36/24 server06 eth0 default Mon Oct 12 22:40:44 2020
10.1.30.106/24 server06 uplink default Mon Oct 12 22:40:44 2020
192.168.200.35/24 server05 eth0 default Mon Oct 12 22:40:40 2020
10.1.20.105/24 server05 uplink default Mon Oct 12 22:40:40 2020
10.1.10.104/24 server04 uplink default Mon Oct 12 22:40:33 2020
192.168.200.34/24 server04 eth0 default Mon Oct 12 22:40:33 2020
10.1.30.103/24 server03 uplink default Mon Oct 12 22:40:51 2020
192.168.200.33/24 server03 eth0 default Mon Oct 12 22:40:51 2020
192.168.200.32/24 server02 eth0 default Mon Oct 12 22:40:38 2020
10.1.20.102/24 server02 uplink default Mon Oct 12 22:40:38 2020
192.168.200.31/24 server01 eth0 default Mon Oct 12 22:40:33 2020
10.1.10.101/24 server01 uplink default Mon Oct 12 22:40:33 2020
...
Obtain a Count of IP Addresses Used on a Device
If you have concerns that a particular device an overload of addresses in use, you can quickly view the address count using the count option.
This example shows the number of IPv4 and IPv6 addresses on the leaf01 switch.
cumulus@switch:~$ netq leaf01 show ip addresses count
Count of matching address records: 9
cumulus@switch:~$ netq leaf01 show ipv6 addresses count
Count of matching address records: 17
View IP Neighbor Information
You can view the IPv4 and IPv6 neighbor information for all your devices, including the interface port, MAC address, VRF assignment, and whether it learns the MAC address from the peer (remote=yes).
Additionally, you can:
View the information at an earlier point in time
Filter against a particular device, interface, address or VRF assignment
Obtain a count of all addresses
Each of these provides information for troubleshooting potential configuration and communication issues at the layer 3 level.
View IP Neighbor Information for All Devices
You can view neighbor information for all devices running IPv4 or IPv6 using the netq show ip/ipv6 neighbors command.
This example shows all neighbors for devices running IPv4.
cumulus@switch:~$ netq show ip neighbors
Matching neighbor records:
IP Address Hostname Interface MAC Address VRF Remote Last Changed
------------------------- ----------------- ------------------------- ------------------ --------------- ------ -------------------------
169.254.0.1 spine04 swp1 44:38:39:00:00:08 default no Mon Oct 19 22:28:23 2020
169.254.0.1 spine04 swp6 44:38:39:00:00:30 default no Mon Oct 19 22:28:23 2020
169.254.0.1 spine04 swp5 44:38:39:00:00:28 default no Mon Oct 19 22:28:23 2020
192.168.200.1 spine04 eth0 44:38:39:00:00:6d no Tue Oct 20 17:39:25 2020
169.254.0.1 spine04 swp4 44:38:39:00:00:20 default no Mon Oct 19 22:28:23 2020
169.254.0.1 spine04 swp3 44:38:39:00:00:18 default no Mon Oct 19 22:28:23 2020
169.254.0.1 spine04 swp2 44:38:39:00:00:10 default no Mon Oct 19 22:28:23 2020
192.168.200.24 spine04 mgmt c6:b3:15:1d:84:c4 no Mon Oct 19 22:28:23 2020
192.168.200.250 spine04 eth0 44:38:39:00:01:80 no Mon Oct 19 22:28:23 2020
169.254.0.1 spine03 swp1 44:38:39:00:00:06 default no Mon Oct 19 22:29:01 2020
169.254.0.1 spine03 swp6 44:38:39:00:00:2e default no Mon Oct 19 22:29:01 2020
169.254.0.1 spine03 swp5 44:38:39:00:00:26 default no Mon Oct 19 22:29:01 2020
192.168.200.1 spine03 eth0 44:38:39:00:00:6d no Tue Oct 20 17:25:19 2020
169.254.0.1 spine03 swp4 44:38:39:00:00:1e default no Mon Oct 19 22:29:01 2020
169.254.0.1 spine03 swp3 44:38:39:00:00:16 default no Mon Oct 19 22:29:01 2020
169.254.0.1 spine03 swp2 44:38:39:00:00:0e default no Mon Oct 19 22:29:01 2020
192.168.200.250 spine03 eth0 44:38:39:00:01:80 no Mon Oct 19 22:29:01 2020
169.254.0.1 spine02 swp1 44:38:39:00:00:04 default no Mon Oct 19 22:28:46 2020
169.254.0.1 spine02 swp6 44:38:39:00:00:2c default no Mon Oct 19 22:28:46 2020
169.254.0.1 spine02 swp5 44:38:39:00:00:24 default no Mon Oct 19 22:28:46 2020
...
Filter IP Neighbor Information
You can filter the list of IP neighbor information to show only neighbors for a particular device, interface, address or VRF assignment.
This example shows the IPv6 neighbors for leaf02 switch.
cumulus@switch$ netq leaf02 show ipv6 neighbors
Matching neighbor records:
IP Address Hostname Interface MAC Address VRF Remote Last Changed
------------------------- ----------------- ------------------------- ------------------ --------------- ------ -------------------------
ff02::16 leaf02 eth0 33:33:00:00:00:16 no Mon Oct 19 22:28:30 2020
fe80::4638:39ff:fe00:32 leaf02 vlan10-v0 44:38:39:00:00:32 RED no Mon Oct 19 22:28:30 2020
fe80::4638:39ff:febe:efaa leaf02 vlan4001 44:38:39:be:ef:aa RED no Mon Oct 19 22:28:30 2020
fe80::4638:39ff:fe00:3a leaf02 vlan20-v0 44:38:39:00:00:34 RED no Mon Oct 19 22:28:30 2020
ff02::1 leaf02 mgmt 33:33:00:00:00:01 no Mon Oct 19 22:28:30 2020
fe80::4638:39ff:fe00:3c leaf02 vlan30 44:38:39:00:00:36 BLUE no Mon Oct 19 22:28:30 2020
fe80::4638:39ff:fe00:59 leaf02 peerlink.4094 44:38:39:00:00:59 default no Mon Oct 19 22:28:30 2020
fe80::4638:39ff:fe00:59 leaf02 vlan20 44:38:39:00:00:59 RED no Mon Oct 19 22:28:30 2020
fe80::4638:39ff:fe00:42 leaf02 vlan30-v0 44:38:39:00:00:42 BLUE no Mon Oct 19 22:28:30 2020
fe80::4638:39ff:fe00:9 leaf02 swp51 44:38:39:00:00:09 default no Mon Oct 19 22:28:30 2020
fe80::4638:39ff:fe00:44 leaf02 vlan10 44:38:39:00:00:3e RED yes Mon Oct 19 22:28:30 2020
fe80::4638:39ff:fe00:3c leaf02 vlan30-v0 44:38:39:00:00:36 BLUE no Mon Oct 19 22:28:30 2020
fe80::4638:39ff:fe00:32 leaf02 vlan10 44:38:39:00:00:32 RED no Mon Oct 19 22:28:30 2020
fe80::4638:39ff:fe00:59 leaf02 vlan30 44:38:39:00:00:59 BLUE no Mon Oct 19 22:28:30 2020
fe80::4638:39ff:fe00:190 leaf02 eth0 44:38:39:00:01:90 no Mon Oct 19 22:28:30 2020
fe80::4638:39ff:fe00:40 leaf02 vlan20-v0 44:38:39:00:00:40 RED no Mon Oct 19 22:28:30 2020
fe80::4638:39ff:fe00:44 leaf02 vlan10-v0 44:38:39:00:00:3e RED no Mon Oct 19 22:28:30 2020
fe80::4638:39ff:fe00:3a leaf02 vlan20 44:38:39:00:00:34 RED no Mon Oct 19 22:28:30 2020
fe80::4638:39ff:fe00:180 leaf02 eth0 44:38:39:00:01:80 no Mon Oct 19 22:28:30 2020
fe80::4638:39ff:fe00:40 leaf02 vlan20 44:38:39:00:00:40 RED yes Mon Oct 19 22:28:30 2020
fe80::4638:39ff:fe00:f leaf02 swp54 44:38:39:00:00:0f default no Mon Oct 19 22:28:30 2020
This example shows all IPv4 neighbors using the RED VRF. Note that the VRF name is case sensitive.
cumulus@switch:~$ netq show ip neighbors vrf RED
Matching neighbor records:
IP Address Hostname Interface MAC Address VRF Remote Last Changed
------------------------- ----------------- ------------------------- ------------------ --------------- ------ -------------------------
10.1.10.2 leaf04 vlan10 44:38:39:00:00:5d RED no Mon Oct 19 22:28:47 2020
10.1.20.2 leaf04 vlan20 44:38:39:00:00:5d RED no Mon Oct 19 22:28:47 2020
10.1.10.3 leaf03 vlan10 44:38:39:00:00:5e RED no Mon Oct 19 22:28:18 2020
10.1.20.3 leaf03 vlan20 44:38:39:00:00:5e RED no Mon Oct 19 22:28:18 2020
10.1.10.2 leaf02 vlan10 44:38:39:00:00:59 RED no Mon Oct 19 22:28:30 2020
10.1.20.2 leaf02 vlan20 44:38:39:00:00:59 RED no Mon Oct 19 22:28:30 2020
10.1.10.3 leaf01 vlan10 44:38:39:00:00:37 RED no Mon Oct 19 22:28:22 2020
10.1.20.3 leaf01 vlan20 44:38:39:00:00:37 RED no Mon Oct 19 22:28:22 2020
This example shows all IPv6 neighbors using the vlan10 interface.
cumulus@netq-ts:~$ netq show ipv6 neighbors vlan10
Matching neighbor records:
IP Address Hostname Interface MAC Address VRF Remote Last Changed
------------------------- ----------------- ------------------------- ------------------ --------------- ------ -------------------------
fe80::4638:39ff:fe00:44 leaf04 vlan10 44:38:39:00:00:3e RED no Mon Oct 19 22:28:47 2020
fe80::4638:39ff:fe00:5d leaf04 vlan10 44:38:39:00:00:5d RED no Mon Oct 19 22:28:47 2020
fe80::4638:39ff:fe00:32 leaf04 vlan10 44:38:39:00:00:32 RED yes Mon Oct 19 22:28:47 2020
fe80::4638:39ff:fe00:44 leaf03 vlan10 44:38:39:00:00:3e RED no Mon Oct 19 22:28:18 2020
fe80::4638:39ff:fe00:5e leaf03 vlan10 44:38:39:00:00:5e RED no Mon Oct 19 22:28:18 2020
fe80::4638:39ff:fe00:32 leaf03 vlan10 44:38:39:00:00:32 RED yes Mon Oct 19 22:28:18 2020
fe80::4638:39ff:fe00:44 leaf02 vlan10 44:38:39:00:00:3e RED yes Mon Oct 19 22:28:30 2020
fe80::4638:39ff:fe00:32 leaf02 vlan10 44:38:39:00:00:32 RED no Mon Oct 19 22:28:30 2020
fe80::4638:39ff:fe00:59 leaf02 vlan10 44:38:39:00:00:59 RED no Mon Oct 19 22:28:30 2020
fe80::4638:39ff:fe00:44 leaf01 vlan10 44:38:39:00:00:3e RED yes Mon Oct 19 22:28:22 2020
fe80::4638:39ff:fe00:32 leaf01 vlan10 44:38:39:00:00:32 RED no Mon Oct 19 22:28:22 2020
fe80::4638:39ff:fe00:37 leaf01 vlan10 44:38:39:00:00:37 RED no Mon Oct 19 22:28:22 2020
View IP Routes Information
You can view the IPv4 and IPv6 routes for all your devices, including the IP address (with or without mask), the destination (by hostname) of the route, next hops available, VRF assignment, and whether a host is the owner of the route or MAC address. Additionally, you can:
View the information at an earlier point in time
Filter against a particular address or VRF assignment
Obtain a count of all routes
Each of these provides information for troubleshooting potential configuration and communication issues at the layer 3 level.
View IP Routes for All Devices
This example shows the IPv4 and IPv6 routes for all devices in the network.
cumulus@switch:~$ netq show ip routes
Matching routes records:
Origin VRF Prefix Hostname Nexthops Last Changed
------ --------------- ------------------------------ ----------------- ----------------------------------- -------------------------
no default 10.0.1.2/32 spine04 169.254.0.1: swp3, Mon Oct 19 22:28:23 2020
169.254.0.1: swp4
no default 10.10.10.4/32 spine04 169.254.0.1: swp3, Mon Oct 19 22:28:23 2020
169.254.0.1: swp4
no default 10.10.10.3/32 spine04 169.254.0.1: swp3, Mon Oct 19 22:28:23 2020
169.254.0.1: swp4
no default 10.10.10.2/32 spine04 169.254.0.1: swp1, Mon Oct 19 22:28:23 2020
169.254.0.1: swp2
no default 10.10.10.1/32 spine04 169.254.0.1: swp1, Mon Oct 19 22:28:23 2020
169.254.0.1: swp2
yes 192.168.200.0/24 spine04 eth0 Mon Oct 19 22:28:23 2020
yes 192.168.200.24/32 spine04 eth0 Mon Oct 19 22:28:23 2020
no default 10.0.1.1/32 spine04 169.254.0.1: swp1, Mon Oct 19 22:28:23 2020
169.254.0.1: swp2
yes default 10.10.10.104/32 spine04 lo Mon Oct 19 22:28:23 2020
no 0.0.0.0/0 spine04 Blackhole Mon Oct 19 22:28:23 2020
no default 10.10.10.64/32 spine04 169.254.0.1: swp5, Mon Oct 19 22:28:23 2020
169.254.0.1: swp6
no default 10.10.10.63/32 spine04 169.254.0.1: swp5, Mon Oct 19 22:28:23 2020
169.254.0.1: swp6
...
cumulus@switch:~$ netq show ipv6 routes
Matching routes records:
Origin VRF Prefix Hostname Nexthops Last Changed
------ --------------- ------------------------------ ----------------- ----------------------------------- -------------------------
no ::/0 spine04 Blackhole Mon Oct 19 22:28:23 2020
no ::/0 spine03 Blackhole Mon Oct 19 22:29:01 2020
no ::/0 spine02 Blackhole Mon Oct 19 22:28:46 2020
no ::/0 spine01 Blackhole Mon Oct 19 22:28:48 2020
no RED ::/0 leaf04 Blackhole Mon Oct 19 22:28:47 2020
no ::/0 leaf04 Blackhole Mon Oct 19 22:28:47 2020
no BLUE ::/0 leaf04 Blackhole Mon Oct 19 22:28:47 2020
no RED ::/0 leaf03 Blackhole Mon Oct 19 22:28:18 2020
no ::/0 leaf03 Blackhole Mon Oct 19 22:28:18 2020
no BLUE ::/0 leaf03 Blackhole Mon Oct 19 22:28:18 2020
no RED ::/0 leaf02 Blackhole Mon Oct 19 22:28:30 2020
no ::/0 leaf02 Blackhole Mon Oct 19 22:28:30 2020
no BLUE ::/0 leaf02 Blackhole Mon Oct 19 22:28:30 2020
no RED ::/0 leaf01 Blackhole Mon Oct 19 22:28:22 2020
no ::/0 leaf01 Blackhole Mon Oct 19 22:28:22 2020
no BLUE ::/0 leaf01 Blackhole Mon Oct 19 22:28:22 2020
no ::/0 fw2 Blackhole Mon Oct 19 22:28:22 2020
no ::/0 fw1 Blackhole Mon Oct 19 22:28:10 2020
no RED ::/0 border02 Blackhole Mon Oct 19 22:28:38 2020
no ::/0 border02 Blackhole Mon Oct 19 22:28:38 2020
no BLUE ::/0 border02 Blackhole Mon Oct 19 22:28:38 2020
no RED ::/0 border01 Blackhole Mon Oct 19 22:28:34 2020
no ::/0 border01 Blackhole Mon Oct 19 22:28:34 2020
no BLUE ::/0 border01 Blackhole Mon Oct 19 22:28:34 2020
Filter IP Route Information
You can filter the IP route information listing for a particular device, interface address, VRF assignment or route origination.
This example shows the routes available for an IP address of 10.0.0.12. The result shows nine available routes.
cumulus@switch:~$ netq show ip routes 10.0.0.12
Matching routes records:
Origin VRF Prefix Hostname Nexthops Last Changed
------ --------------- ------------------------------ ----------------- ----------------------------------- -------------------------
no 0.0.0.0/0 spine04 Blackhole Mon Oct 19 22:28:23 2020
no 0.0.0.0/0 spine03 Blackhole Mon Oct 19 22:29:01 2020
no 0.0.0.0/0 spine02 Blackhole Mon Oct 19 22:28:46 2020
no 0.0.0.0/0 spine01 Blackhole Mon Oct 19 22:28:48 2020
no default 0.0.0.0/0 server08 192.168.200.1: eth0 Mon Oct 19 22:28:50 2020
no default 0.0.0.0/0 server07 192.168.200.1: eth0 Mon Oct 19 22:28:43 2020
no default 10.0.0.0/8 server06 10.1.30.1: uplink Mon Oct 19 22:40:52 2020
no default 10.0.0.0/8 server05 10.1.20.1: uplink Mon Oct 19 22:41:08 2020
no default 10.0.0.0/8 server04 10.1.10.1: uplink Mon Oct 19 22:40:45 2020
no default 10.0.0.0/8 server03 10.1.30.1: uplink Mon Oct 19 22:41:04 2020
no default 10.0.0.0/8 server02 10.1.20.1: uplink Mon Oct 19 22:41:00 2020
no default 10.0.0.0/8 server01 10.1.10.1: uplink Mon Oct 19 22:40:36 2020
no default 0.0.0.0/0 oob-mgmt-server 10.255.1.1: vagrant Mon Oct 19 22:28:20 2020
no BLUE 0.0.0.0/0 leaf04 Blackhole Mon Oct 19 22:28:47 2020
no 0.0.0.0/0 leaf04 Blackhole Mon Oct 19 22:28:47 2020
no RED 0.0.0.0/0 leaf04 Blackhole Mon Oct 19 22:28:47 2020
no BLUE 0.0.0.0/0 leaf03 Blackhole Mon Oct 19 22:28:18 2020
no 0.0.0.0/0 leaf03 Blackhole Mon Oct 19 22:28:18 2020
no RED 0.0.0.0/0 leaf03 Blackhole Mon Oct 19 22:28:18 2020
no BLUE 0.0.0.0/0 leaf02 Blackhole Mon Oct 19 22:28:30 2020
no 0.0.0.0/0 leaf02 Blackhole Mon Oct 19 22:28:30 2020
...
This example shows all IPv4 routes owned by spine01 switch.
cumulus@switch:~$ netq spine01 show ip routes origin
Matching routes records:
Origin VRF Prefix Hostname Nexthops Last Changed
------ --------------- ------------------------------ ----------------- ----------------------------------- -------------------------
yes 192.168.200.0/24 spine01 eth0 Mon Oct 19 22:28:48 2020
yes 192.168.200.21/32 spine01 eth0 Mon Oct 19 22:28:48 2020
yes default 10.10.10.101/32 spine01 lo Mon Oct 19 22:28:48 2020
View IP Routes for a Given Device at a Prior Time
As with most NetQ CLI commands, you can view a characteristic for a time in the past. The same is true with IP routes.
This example show the IPv4 routes for spine01 switch about 24 hours ago.
cumulus@switch:~$ netq spine01 show ip routes around 24h
Matching routes records:
Origin VRF Prefix Hostname Nexthops Last Changed
------ --------------- ------------------------------ ----------------- ----------------------------------- -------------------------
no default 10.0.1.2/32 spine01 169.254.0.1: swp3, Sun Oct 18 22:28:41 2020
169.254.0.1: swp4
no default 10.10.10.4/32 spine01 169.254.0.1: swp3, Sun Oct 18 22:28:41 2020
169.254.0.1: swp4
no default 10.10.10.3/32 spine01 169.254.0.1: swp3, Sun Oct 18 22:28:41 2020
169.254.0.1: swp4
no default 10.10.10.2/32 spine01 169.254.0.1: swp1, Sun Oct 18 22:28:41 2020
169.254.0.1: swp2
no default 10.10.10.1/32 spine01 169.254.0.1: swp1, Sun Oct 18 22:28:41 2020
169.254.0.1: swp2
yes 192.168.200.0/24 spine01 eth0 Sun Oct 18 22:28:41 2020
yes 192.168.200.21/32 spine01 eth0 Sun Oct 18 22:28:41 2020
no default 10.0.1.1/32 spine01 169.254.0.1: swp1, Sun Oct 18 22:28:41 2020
169.254.0.1: swp2
yes default 10.10.10.101/32 spine01 lo Sun Oct 18 22:28:41 2020
no 0.0.0.0/0 spine01 Blackhole Sun Oct 18 22:28:41 2020
no default 10.10.10.64/32 spine01 169.254.0.1: swp5, Sun Oct 18 22:28:41 2020
169.254.0.1: swp6
no default 10.10.10.63/32 spine01 169.254.0.1: swp5, Sun Oct 18 22:28:41 2020
169.254.0.1: swp6
no default 10.0.1.254/32 spine01 169.254.0.1: swp5, Sun Oct 18 22:28:41 2020
169.254.0.1: swp6
View the Number of IP Routes
You can view the total number of IP routes on all devices or for those on a particular device.
This example shows the total number of IPv4 and IPv6 routes for all devices on a the leaf01 switch.
cumulus@switch:~$ netq leaf01 show ip routes count
Count of matching routes records: 27
cumulus@switch:~$ netq leaf01 show ipv6 routes count
Count of matching routes records: 3
View the History of an IP Address
It is useful when debugging to be able to see when the IP address configuration changed for an interface. The netq show address-history command makes this information available. It enables you to see:
Each change made chronologically.
Changes made between two points in time, using the between option.
Only the difference between to points in time using the diff option.
To order the output by selected output fields using the listby option.
Each change made for the IP address on a particular interface, using the ifname option.
And as with many NetQ commands, the default time range used is now to one hour ago. You can view the output in JSON format as well.
The syntax of the command is:
netq [<hostname>] show address-history <text-prefix> [ifname <text-ifname>] [vrf <text-vrf>] [diff] [between <text-time> and <text-endtime>] [listby <text-list-by>] [json]
When entering a time value, you must include a numeric value and the unit of measure:
w: weeks
d: days
h: hours
m: minutes
s: seconds
now
For the between option, you can enter the start (text-time) and end time (text-endtime) values as most recent first and least recent second, or vice versa. The values do not have to have the same unit of measure.
This example shows how to view a full chronology of changes for an IP address. If a caret (^) notation appeared, it would indicate that there was no change in this value from the row above.
This example shows how to view the history of an IP address by hostname. If a caret (^) notation appeared, it would indicate that there was no change in this value from the row above.
This example shows how to view the history of an IP address between now and two hours ago. If a caret (^) notation appeared, it would indicate that there was no change in this value from the row above.
cumulus@switch:~$ netq show address-history 10.1.10.2/24 between 2h and now
Matching addresshistory records:
Last Changed Hostname Ifname Prefix Mask Vrf
------------------------- ----------------- ------------ ------------------------------ -------- ---------------
Tue Sep 29 15:35:21 2020 leaf03 vlan10 10.1.10.2 24 RED
Tue Sep 29 15:35:24 2020 leaf01 vlan10 10.1.10.2 24 RED
Tue Sep 29 17:24:59 2020 leaf03 vlan10 10.1.10.2 24 RED
Tue Sep 29 17:24:59 2020 leaf01 vlan10 10.1.10.2 24 RED
Tue Sep 29 17:25:05 2020 leaf03 vlan10 10.1.10.2 24 RED
Tue Sep 29 17:25:05 2020 leaf01 vlan10 10.1.10.2 24 RED
Tue Sep 29 17:25:07 2020 leaf03 vlan10 10.1.10.2 24 RED
Tue Sep 29 17:25:08 2020 leaf01 vlan10 10.1.10.2 24 RED
View the Neighbor History for an IP Address
It is useful when debugging to be able to see when the neighbor configuration changed for an IP address. The netq show neighbor-history command makes this information available. It enables you to see:
Each change that made chronologically.
Changes made between two points in time, using the between option.
Only the difference between to points in time using the diff option.
To order the output by selected output fields using the listby option.
Each change made for the IP address on a particular interface, using the ifname option.
And as with many NetQ commands, the default time range used is now to one hour ago. You can view the output in JSON format as well.
The syntax of the command is:
netq [<hostname>] show neighbor-history <text-ipaddress> [ifname <text-ifname>] [diff] [between <text-time> and <text-endtime>] [listby <text-list-by>] [json]
When entering a time value, you must include a numeric value and the unit of measure:
w: weeks
d: days
h: hours
m: minutes
s: seconds
now
For the between option, you can enter the start (text-time) and end time (text-endtime) values as most recent first and least recent second, or vice versa. The values do not have to have the same unit of measure.
This example shows how to view a full chronology of changes for an IP address neighbor. If a caret (^) notation appeared, it would indicate that there was no change in this value from the row above.
cumulus@switch:~$ netq show neighbor-history 10.1.10.2
Matching neighborhistory records:
Last Changed Hostname Ifname Vrf Remote Ifindex Mac Address Ipv6 Ip Address
------------------------- ----------------- ------------ --------------- ------ -------------- ------------------ -------- -------------------------
Tue Sep 29 17:25:08 2020 leaf02 vlan10 RED no 24 44:38:39:00:00:59 no 10.1.10.2
Tue Sep 29 17:25:17 2020 leaf04 vlan10 RED no 24 44:38:39:00:00:5d no 10.1.10.2
This example shows how to view the history of an IP address neighbor by hostname. If a caret (^) notation appeared, it would indicate that there was no change in this value from the row above.
cumulus@switch:~$ netq show neighbor-history 10.1.10.2 listby hostname
Matching neighborhistory records:
Last Changed Hostname Ifname Vrf Remote Ifindex Mac Address Ipv6 Ip Address
------------------------- ----------------- ------------ --------------- ------ -------------- ------------------ -------- -------------------------
Tue Sep 29 17:25:08 2020 leaf02 vlan10 RED no 24 44:38:39:00:00:59 no 10.1.10.2
Tue Sep 29 17:25:17 2020 leaf04 vlan10 RED no 24 44:38:39:00:00:5d no 10.1.10.2
This example shows show to view the history of an IP address neighbor between now and two hours ago. If a caret (^) notation appeared, it would indicate that there was no change in this value from the row above.
cumulus@switch:~$ netq show neighbor-history 10.1.10.2 between 2h and now
Matching neighborhistory records:
Last Changed Hostname Ifname Vrf Remote Ifindex Mac Address Ipv6 Ip Address
------------------------- ----------------- ------------ --------------- ------ -------------- ------------------ -------- -------------------------
Tue Sep 29 15:35:18 2020 leaf02 vlan10 RED no 24 44:38:39:00:00:59 no 10.1.10.2
Tue Sep 29 15:35:22 2020 leaf04 vlan10 RED no 24 44:38:39:00:00:5d no 10.1.10.2
Tue Sep 29 17:25:00 2020 leaf02 vlan10 RED no 24 44:38:39:00:00:59 no 10.1.10.2
Tue Sep 29 17:25:08 2020 leaf04 vlan10 RED no 24 44:38:39:00:00:5d no 10.1.10.2
Tue Sep 29 17:25:08 2020 leaf02 vlan10 RED no 24 44:38:39:00:00:59 no 10.1.10.2
Tue Sep 29 17:25:14 2020 leaf04 vlan10 RED no 24 44:38:39:00:00:5d no 10.1.10.2
Monitor the BGP Service
BGP is the routing protocol that runs the Internet. It is an increasingly popular protocol for use in the data center as it lends itself well to the rich interconnections in a Clos topology. Specifically, BGP:
Does not require the routing state to be periodically refreshed, unlike OSPF.
Is less chatty than its link-state siblings. For example, a link or node transition can result in a bestpath change, causing BGP to send updates.
Is multi-protocol and extensible.
Has many robust vendor implementations.
Is very mature as a protocol and comes with many years of operational experience.
RFC 7938 provides further details of the use of BGP within the data center. For an overview and how to configure BGP to run in your data center network, refer to
Border Gateway Protocol - BGP.
NetQ enables operators to view the health of the BGP service on a networkwide or per session basis, giving greater insight into all aspects of the service. You accomplish this in the NetQ UI through two card workflows, one for the service and one for the session, and in the NetQ CLI with the netq show bgp command.
Monitor the BGP Service Networkwide
With NetQ, you can monitor BGP performance across the network:
Network Services|All BGP Sessions
Small: view number of nodes running BGP service and distribution and number of alarms
Medium: view number and distribution of nodes running BGP service, alarms, and with unestablished sessions
Large: view number and distribution of nodes running BGP service and those with unestablished sessions, and view nodes with the most established and unestablished BGP sessions
Full-screen: view all switches, all sessions, and all alarms
netq show bgp command: view associated neighbors, ASN (autonomous system number), peer ASN, receive IP or EVPN address prefixes, and VRF assignment for each node
When entering a time value in the netq show bgp command, you must include a numeric value and the unit of measure:
w: weeks
d: days
h: hours
m: minutes
s: seconds
now
When using the between option, you can enter the start time (text-time) and end time (text-endtime) values as most recent first and least recent second, or vice versa. The values do not have to have the same unit of measure.
View Service Status Summary
You can view a summary of BGP service with the NetQ UI or the NetQ CLI.
To view the summary, open the small Network Services|All BGP Sessions card.
To view the summary, run netq show bgp.
This example shows each node, their neighbor, VRF, ASN, peer ASN, received address IPv4/IPv6/EVPN prefix, and last time something changed.
It is useful to know the number of network nodes running the BGP protocol over a period of time, as it gives you insight into the amount of traffic associated with and breadth of use of the protocol.
It is also useful to compare the number of nodes running BGP with unestablished sessions with the alarms present at the same time to determine if there is any correlation between the issues and the ability to establish a BGP session. This is visible with the NetQ UI.
To view these distributions, open the medium Network Services|All BGP Sessions card.
In this example, we see that 10 nodes are running the BGP protocol, there are no nodes with unestablished sessions, and that 54 LLDP-related alarms have occurred in the last 24 hours. If a visual correlation between the alarms and unestablished sessions is apparent, you can dig a little deeper with the large Network Services|All BGP Sessions card.
To view the number of switches running the BGP service, run:
netq show bgp
Count the switches in the output.
This example shows two border switches, four leaf switches, and four spine switches are running the BGP service, for a total of 10.
You can view the load from BGP on your switches and hosts using the large Network Services|All BGP Sessions card or the NetQ CLI. This data enables you to see which switches are handling the most BGP sessions currently, validate your expectations based on your network design, and compare that with data from an earlier time to look for any differences.
To view switches and hosts with the most BGP sessions:
Open the large Network Services|ALL BGP Sessions card.
Select Switches With Most Sessions from the filter above the table.
The table content sorts on this characteristic, listing nodes running the most BGP sessions at the top. Scroll down to view those with the fewest sessions.
To compare this data with the same data at a previous time:
Open another large BGP Service card.
Move the new card next to the original card if needed.
Change the time period for the data on the new card by hovering over the card and clicking .
Select the time period that you want to compare with the original time. We chose Past Week for this example.
You can now see whether there are significant differences between this time and the original time. If the changes are unexpected, you can investigate further by looking at another timeframe, determining if more nodes are now running BGP than previously, looking for changes in the topology, and so forth.
To determine the devices with the most sessions, run netq show bgp. Then count the sessions on each device.
In this example, border01-02 and leaf01-04 each have four sessions. The spine01-04 switches each have five sessions. Therefore the spine switches have the most sessions.
View Devices with the Most Unestablished BGP Sessions
You can identify switches and hosts that are experiencing difficulties establishing BGP sessions; both currently and in the past, using the NetQ UI.
To view switches with the most unestablished BGP sessions:
Open the large Network Services|All BGP Sessions card.
Select Switches with Most Unestablished Sessions from the filter above the table.
The table content sorts on this characteristic, listing nodes with the most unestablished BGP sessions at the top. Scroll down to view those with the fewest unestablished sessions.
Where to go next depends on what data you see, but a couple of options
include:
Change the time period for the data to compare with a prior time.
If the same switches are consistently indicating the most unestablished sessions, you might want to look more carefully at those switches using the Switches card workflow to determine probable causes. Refer to Monitor Switch Performance.
Click Show All Sessions to investigate all BGP sessions with events in the full screen card.
View BGP Configuration Information for a Given Device
You can view the BGP configuration information for a given device from the NetQ UI or the NetQ CLI.
Open the full-screen Network Services|All BGP Sessions card.
Click to filter by hostname.
Click Apply.
Run the netq show bgp command with the hostname option.
This example shows the BGP configuration information for the spine02
switch. The switch is peered with swp1 on leaf01, swp2 on leaf02, and so
on. Spine02 has an ASN of 65199 and each of the peers have unique ASNs.
View BGP Configuration Information for a Given ASN
You can view the BGP configuration information for a given ASN from the NetQ UI or the NetQ CLI.
Open the full-screen Network Services|All BGP Sessions card.
Locate the ASN column.
You might want to pause the auto-refresh feature during this process to avoid the page update while you are browsing the data.
Click the header to sort on that column.
Scroll down as needed to find the devices using the ASN of interest.
Run the netq show bgp command with the asn <number-asn> option.
This example shows the BGP configuration information for ASN of
65102. This ASN is associated with leaf02-leaf04 and so the results show
the BGP neighbors for those switches.
Switches or hosts experiencing a large number of BGP alarms might indicate a configuration or performance issue that needs further investigation. You can view this information using the NetQ UI or NetQ CLI.
With the NetQ UI, you can view the devices sorted by the number of BGP alarms and then use the Switches card workflow or the Events|Alarms card workflow to gather more information about possible causes for the alarms.
To view switches with the most BGP alarms:
Open the large Network Services|All BGP Sessions card.
Hover over the header and click .
Select Switches with Most Alarms from the filter above the table.
The table content sorts on this characteristic, listing nodes with the most BGP alarms at the top. Scroll down to view those with the fewest alarms.
Where to go next depends on what data you see, but a few options include:
Change the time period for the data to compare with a prior time. If the same switches are consistently indicating the most alarms, you might want to look more carefully at those switches using the Switches card workflow.
Click Show All Sessions to investigate all BGP sessions with events in the full-screen card.
To view the switches and hosts with the most BGP alarms and informational events, run the netq show events command with the type option set to bgp, and optionally the between option set to display the events within a given time range. Count the events associated with each switch.
This example shows all BGP events between now and five days ago.
cumulus@switch:~$ netq show events type bgp between now and 5d
Matching bgp records:
Hostname Message Type Severity Message Timestamp
----------------- ------------ -------- ----------------------------------- -------------------------
leaf01 bgp info BGP session with peer spine01 @desc 2h:10m:11s
: state changed from failed to esta
blished
leaf01 bgp info BGP session with peer spine02 @desc 2h:10m:11s
: state changed from failed to esta
blished
leaf01 bgp info BGP session with peer spine03 @desc 2h:10m:11s
: state changed from failed to esta
blished
leaf01 bgp info BGP session with peer spine01 @desc 2h:10m:11s
: state changed from failed to esta
blished
leaf01 bgp info BGP session with peer spine03 @desc 2h:10m:11s
: state changed from failed to esta
blished
leaf01 bgp info BGP session with peer spine02 @desc 2h:10m:11s
: state changed from failed to esta
blished
leaf01 bgp info BGP session with peer spine03 @desc 2h:10m:11s
: state changed from failed to esta
blished
leaf01 bgp info BGP session with peer spine02 @desc 2h:10m:11s
: state changed from failed to esta
blished
leaf01 bgp info BGP session with peer spine01 @desc 2h:10m:11s
: state changed from failed to esta
blished
...
View All BGP Events
The Network Services|All BGP Sessions card workflow and the netq show events type bgp command enable you to view all BGP events in a designated time period.
To view all BGP events:
Open the full-screen Network Services|All BGP Sessions card.
Click All Alarms tab in the navigation panel.
By default, events appear in most recent to least recent order.
Where to go next depends on what data you see, but a couple of options include:
Sort on various parameters:
by Message to determine the frequency of particular events
by Severity to determine the most critical events
by Time to find events that might have occurred at a particular time to try to correlate them with other system events
Open one of the other full screen tabs in this flow to focus on devices or sessions
Export the data for use in another analytics tool, by clicking and providing a name for the data file.
To return to your workbench, click in the top right corner.
To view all BGP alarms, run:
netq show events [level info | level error | level warning | level critical | level debug] type bgp [between <text-time> and <text-endtime>] [json]
Use the level option to set the severity of the events to show. Use the between option to show events within a given time range.
This example shows informational BGP events in the past five days.
cumulus@switch:~$ netq show events type bgp between now and 5d
Matching bgp records:
Hostname Message Type Severity Message Timestamp
----------------- ------------ -------- ----------------------------------- -------------------------
leaf01 bgp info BGP session with peer spine01 @desc 2h:10m:11s
: state changed from failed to esta
blished
leaf01 bgp info BGP session with peer spine02 @desc 2h:10m:11s
: state changed from failed to esta
blished
leaf01 bgp info BGP session with peer spine03 @desc 2h:10m:11s
: state changed from failed to esta
blished
leaf01 bgp info BGP session with peer spine01 @desc 2h:10m:11s
: state changed from failed to esta
blished
leaf01 bgp info BGP session with peer spine03 @desc 2h:10m:11s
: state changed from failed to esta
blished
leaf01 bgp info BGP session with peer spine02 @desc 2h:10m:11s
: state changed from failed to esta
blished
leaf01 bgp info BGP session with peer spine03 @desc 2h:10m:11s
: state changed from failed to esta
blished
leaf01 bgp info BGP session with peer spine02 @desc 2h:10m:11s
: state changed from failed to esta
blished
leaf01 bgp info BGP session with peer spine01 @desc 2h:10m:11s
: state changed from failed to esta
blished
...
View Details for All Devices Running BGP
You can view all stored attributes of all switches and hosts running BGP in your network in the full-screen Network Services|All BGP Sessions card in the NetQ UI.
To view all device details, open the full-screen Network Services|All BGP Sessions card and click the All Switches tab.
To return to your workbench, click in the top right corner.
View Details for All BGP Sessions
You can view attributes of all BGP sessions in your network with the NetQ UI or NetQ CLI.
To view all session details, open the full-screen Network Services|All BGP Sessions card and click the All Sessions tab.
Use the icons above the table to select/deselect, filter, and export items in the list. Refer to Table Settings for more detail.
To return to your workbench, click in the top right corner.
To view session details, run netq show bgp.
This example shows all current sessions (one per row) and the attributes associated with them.
With NetQ, you can monitor a single session of the BGP service, view session state changes, and compare with alarms occurring at the same time, as well as monitor the running BGP configuration and changes to the configuration file. For an overview and how to configure BGP to run in your data center network, refer to
Border Gateway Protocol - BGP.
To access the single session cards, you must open the full-screen Network Services|All BGP Sessions card, click the All Sessions tab, select the desired session, then click (Open Card).
To open the BGP single session card, verify that both the peer hostname and peer ASN are valid. This ensures the information presented is reliable.
Granularity of Data Shown Based on Time Period
On the medium and large single BGP session cards, vertically stacked heat maps represent the status of the sessions; one for established sessions, and one for unestablished sessions. Depending on the time period of data on the card, the number of smaller time blocks indicate that the status varies. A vertical stack of time blocks, one from each map, includes the results from all checks during that time. The results appear by how saturated the color is for each block. If only established sessions occurred during that time period for the entire time block, then the top block is 100% saturated (white) and the unestablished block is zero percent saturated (gray). As unestablished sessions increase in saturation, the established sessions block is proportionally reduced in saturation. An example heat map for a time period of 24 hours appears here with the most common time periods in the table showing the resulting time blocks.
Time Period
Number of Runs
Number Time Blocks
Amount of Time in Each Block
6 hours
18
6
1 hour
12 hours
36
12
1 hour
24 hours
72
24
1 hour
1 week
504
7
1 day
1 month
2,086
30
1 day
1 quarter
7,000
13
1 week
View Session Status Summary
You can view information about a given BGP session using the NetQ UI or NetQ CLI.
A summary of a BGP session is available from the Network Services|BGP Session card workflow, showing the node and its peer and current status.
To view the summary:
Open or add the Network Services|All BGP Sessions card.
Switch to the full-screen card using the card size picker.
Click the All Sessions tab.
Select the session of interest, then click (Open Card).
Locate the medium Network Services|BGP Session card.
Optionally, switch to the small Network Services|BGP Session card.
Run the netq show bgp command with the bgp-session option.
This example first shows the available sessions, then the information for the BGP session on swp51 of spine01.
cumulus@switch~$ netq show bgp <tab>
around : Go back in time to around ...
asn : BGP Autonomous System Number (ASN)
json : Provide output in JSON
peerlink.4094 : peerlink.4094
swp1 : swp1
swp2 : swp2
swp3 : swp3
swp4 : swp4
swp5 : swp5
swp6 : swp6
swp51 : swp51
swp52 : swp52
swp53 : swp53
swp54 : swp54
vrf : VRF
<ENTER>
cumulus@switch:~$ netq show bgp swp51
Matching bgp records:
Hostname Neighbor VRF ASN Peer ASN PfxRx Last Changed
----------------- ---------------------------- --------------- ---------- ---------- ------------ -------------------------
border01 swp51(spine01) default 65132 65199 7/-/72 Fri Oct 2 22:39:00 2020
border02 swp51(spine01) default 65132 65199 7/-/72 Fri Oct 2 22:39:00 2020
leaf01 swp51(spine01) default 65101 65199 7/-/36 Fri Oct 2 22:39:00 2020
leaf02 swp51(spine01) default 65101 65199 7/-/36 Fri Oct 2 22:39:00 2020
leaf03 swp51(spine01) default 65102 65199 7/-/36 Fri Oct 2 22:39:00 2020
leaf04 swp51(spine01) default 65102 65199 7/-/36 Fri Oct 2 22:39:00 2020
View BGP Session State Changes
You can view the state of a given BGP session from the medium and large Network Service|All BGP Sessions card in the NetQ UI. For a given time period, you can determine the stability of the BGP session between two devices. If you experienced connectivity issues at a particular time, you can use these cards to help verify the state of the session. If the session is unestablished more than it was established, you can then investigate further into possible causes.
To view the state transitions for a given BGP session, on the medium BGP Session card:
Open or add the Network Services|All BGP Sessions card.
Switch to the full-screen card using the card size picker.
Click the All Sessions tab.
Select the session of interest, then click (Open Card).
Locate the medium Network Services|BGP Session card.
The heat map indicates the status of the session over the designated time period. In this example, the session has been established for the entire time period.
From this card, you can also view the Peer ASN, name, hostname and router id identifying the session in more detail.
To view the state transitions for a given BGP session on the large BGP Session card:
Open a Network Services|BGP Session card.
Hover over the card, and change to the large card using the card size picker.
From this card, you can view the alarm and info event counts, Peer ASN, hostname, and router id, VRF, and Tx/Rx families identifying the session in more detail. The Connection Drop Count gives you a sense of the session performance.
View Changes to the BGP Service Configuration File
Each time a change is made to the configuration file for the BGP service, NetQ logs the change and enables you to compare it with the last version using the NetQ UI. This can be useful when you are troubleshooting potential causes for alarms or sessions losing their connections.
To view the configuration file changes:
Open or add the Network Services|All BGP Sessions card.
Switch to the full-screen card using the card size picker.
Click the All Sessions tab.
Select the session of interest, then click (Open Card).
Locate the medium Network Services|BGP Session card.
Hover over the card, and change to the large card using the card size picker.
Hover over the card and click to open the BGP Configuration File Evolution tab.
Select the time of interest on the left; when a change might have impacted the performance. Scroll down if needed.
Choose between the File view and the Diff view (selected option is dark; File by default).
The File view displays the content of the file for you to review.
The Diff view displays the changes between this version (on left) and the most recent version (on right) side by side. The changes are highlighted, as seen in this example.
View All BGP Session Details
You can view attributes of all of the BGP sessions for the devices participating in a given session with the NetQ UI and the NetQ CLI.
To view all session details:
Open or add the Network Services|All BGP Sessions card.
Switch to the full-screen card using the card size picker.
Click the All Sessions tab.
Select the session of interest, then click (Open Card).
Locate the medium Network Services|BGP Session card.
Hover over the card, and change to the full-screen card using the card size picker.
To return to your workbench, click in the top right corner.
Run the netq show bgp command with the bgp-session option.
This example shows all BGP sessions associated with swp4.
You can view all alarm and info events for the devices participating in a given session with the NetQ UI.
To view all events:
Open or add the Network Services|All BGP Sessions card.
Switch to the full-screen card using the card size picker.
Click the All Sessions tab.
Select the session of interest, then click (Open Card).
Locate the medium Network Services|BGP Session card.
Hover over the card, and change to the full-screen card using the card size picker.
Click the All Events tab.
To return to your workbench, click in the top right corner.
Monitor the OSPF Service
OSPF maintains the view of the network topology conceptually as a directed graph. Each router represents a vertex in the graph. Each link between neighboring routers represents a unidirectional edge and has an associated weight (called cost) that is either automatically derived from its bandwidth or administratively assigned. Using the weighted topology graph, each router computes a shortest path tree (SPT) with itself as the root, and applies the results to build its forwarding table. For more information about OSPF operation and how to configure OSPF to run in your data center network, refer to
Open Shortest Path First - OSPF or
Open Shortest Path First v3 - OSPFv3.
If you have OSPF running on your switches and hosts, NetQ enables you to view the health of the OSPF service on a networkwide and a per session basis, giving greater insight into all aspects of the service. For each device, you can view its associated interfaces, areas, peers, state, and type of OSPF running (numbered or unnumbered). Additionally, you can view the information at an earlier point in time and filter against a particular device, interface, or area.
You accomplish this in the NetQ UI through two card workflows, one for the service and one for the session, and in the NetQ CLI with the netq show ospf command.
Monitor the OSPF Service Networkwide
With NetQ, you can monitor OSPF performance across the network:
Network Services|All OSPF Sessions
Small: view number of nodes running OSPF service and number and distribution of alarms
Medium: view number and distribution of nodes running OSPF service, total sessions, unestablished sessions, and alarms
Large: view number and distribution of nodes running OSPF service, total sessions, unestablished sessions, and alarms, switches with the most established sessions/alarms
Full-screen: view and filter configuration and status for all switches, all sessions, and all alarms
netq show ospf command: view configuration and status for all devices, including interface, area, type, state, peer hostname and interface, and last time each device changed
When entering a time value, you must include a numeric value and the unit of measure:
w: weeks
d: days
h: hours
m: minutes
s: seconds
now
For the between option, you can enter the start (text-time) and end time (text-endtime) values as most recent first and least recent second, or vice versa. The values do not have to have the same unit of measure.
View Service Status Summary
You can view a summary of the OSPF service from the NetQ UI or the NetQ CLI.
To view the summary, open the Network Services|All OSPF Sessions card. In this example, the number of devices running the OSPF service is nine (9) and the number and distribution of related critical severity alarms is zero (0).
To view OSPF service status, run:
netq show ospf
This example shows all devices included in OSPF unnumbered routing, the assigned areas, state, peer and interface, and the last time this information changed.
cumulus@switch:~$ netq show ospf
Matching ospf records:
Hostname Interface Area Type State Peer Hostname Peer Interface Last Changed
----------------- ------------------------- ------------ ---------------- ---------- ----------------- ------------------------- -------------------------
leaf01 swp51 0.0.0.0 Unnumbered Full spine01 swp1 Thu Feb 7 14:42:16 2019
leaf01 swp52 0.0.0.0 Unnumbered Full spine02 swp1 Thu Feb 7 14:42:16 2019
leaf02 swp51 0.0.0.0 Unnumbered Full spine01 swp2 Thu Feb 7 14:42:16 2019
leaf02 swp52 0.0.0.0 Unnumbered Full spine02 swp2 Thu Feb 7 14:42:16 2019
leaf03 swp51 0.0.0.0 Unnumbered Full spine01 swp3 Thu Feb 7 14:42:16 2019
leaf03 swp52 0.0.0.0 Unnumbered Full spine02 swp3 Thu Feb 7 14:42:16 2019
leaf04 swp51 0.0.0.0 Unnumbered Full spine01 swp4 Thu Feb 7 14:42:16 2019
leaf04 swp52 0.0.0.0 Unnumbered Full spine02 swp4 Thu Feb 7 14:42:16 2019
spine01 swp1 0.0.0.0 Unnumbered Full leaf01 swp51 Thu Feb 7 14:42:16 2019
spine01 swp2 0.0.0.0 Unnumbered Full leaf02 swp51 Thu Feb 7 14:42:16 2019
spine01 swp3 0.0.0.0 Unnumbered Full leaf03 swp51 Thu Feb 7 14:42:16 2019
spine01 swp4 0.0.0.0 Unnumbered Full leaf04 swp51 Thu Feb 7 14:42:16 2019
spine02 swp1 0.0.0.0 Unnumbered Full leaf01 swp52 Thu Feb 7 14:42:16 2019
spine02 swp2 0.0.0.0 Unnumbered Full leaf02 swp52 Thu Feb 7 14:42:16 2019
spine02 swp3 0.0.0.0 Unnumbered Full leaf03 swp52 Thu Feb 7 14:42:16 2019
spine02 swp4 0.0.0.0 Unnumbered Full leaf04 swp52 Thu Feb 7 14:42:16 2019
View the Distribution of Sessions
It is useful to know the number of network nodes running the OSPF protocol over a period of time, as it gives you insight into the amount of traffic associated with and breadth of use of the protocol. It is also useful to view the health of the sessions.
To view these distributions, open the medium Network Services|All OSPF Sessions card. In this example, there are nine nodes running the service with a total of 40 sessions. This has not changed over the past 24 hours.
To view the number of switches running the OSPF service, run:
netq show ospf
Count the switches in the output.
This example shows four leaf switches and two spine switches are running the OSPF service, for a total of six switches.
cumulus@switch:~$ netq show ospf
Matching ospf records:
Hostname Interface Area Type State Peer Hostname Peer Interface Last Changed
----------------- ------------------------- ------------ ---------------- ---------- ----------------- ------------------------- -------------------------
leaf01 swp51 0.0.0.0 Unnumbered Full spine01 swp1 Thu Feb 7 14:42:16 2019
leaf01 swp52 0.0.0.0 Unnumbered Full spine02 swp1 Thu Feb 7 14:42:16 2019
leaf02 swp51 0.0.0.0 Unnumbered Full spine01 swp2 Thu Feb 7 14:42:16 2019
leaf02 swp52 0.0.0.0 Unnumbered Full spine02 swp2 Thu Feb 7 14:42:16 2019
leaf03 swp51 0.0.0.0 Unnumbered Full spine01 swp3 Thu Feb 7 14:42:16 2019
leaf03 swp52 0.0.0.0 Unnumbered Full spine02 swp3 Thu Feb 7 14:42:16 2019
leaf04 swp51 0.0.0.0 Unnumbered Full spine01 swp4 Thu Feb 7 14:42:16 2019
leaf04 swp52 0.0.0.0 Unnumbered Full spine02 swp4 Thu Feb 7 14:42:16 2019
spine01 swp1 0.0.0.0 Unnumbered Full leaf01 swp51 Thu Feb 7 14:42:16 2019
spine01 swp2 0.0.0.0 Unnumbered Full leaf02 swp51 Thu Feb 7 14:42:16 2019
spine01 swp3 0.0.0.0 Unnumbered Full leaf03 swp51 Thu Feb 7 14:42:16 2019
spine01 swp4 0.0.0.0 Unnumbered Full leaf04 swp51 Thu Feb 7 14:42:16 2019
spine02 swp1 0.0.0.0 Unnumbered Full leaf01 swp52 Thu Feb 7 14:42:16 2019
spine02 swp2 0.0.0.0 Unnumbered Full leaf02 swp52 Thu Feb 7 14:42:16 2019
spine02 swp3 0.0.0.0 Unnumbered Full leaf03 swp52 Thu Feb 7 14:42:16 2019
spine02 swp4 0.0.0.0 Unnumbered Full leaf04 swp52 Thu Feb 7 14:42:16 2019
To compare this count with the count at another time, run the netq show ospf command with the around option. Count the devices running OSPF at that time. Repeat with another time to collect a picture of changes over time.
View Devices with the Most OSPF Sessions
You can view the load from OSPF on your switches and hosts using the large Network Services card. This data enables you to see which switches are handling the most OSPF traffic currently, validate that is what you expect based on your network design, and compare that with data from an earlier time to look for any differences.
To view switches and hosts with the most OSPF sessions:
Open the large Network Services|All OSPF Sessions card.
Select Switches with Most Sessions from the filter above the table.
The table content sorts by this characteristic, listing nodes running the most OSPF sessions at the top. Scroll down to view those with the fewest sessions.
To compare this data with the same data at a previous time:
Open another large OSPF Service card.
Move the new card next to the original card if needed.
Change the time period for the data on the new card by hovering over the card and clicking .
Select the time period that you want to compare with the original time. We chose Past Week for this example.
You can now see whether there are significant differences between this time and the original time. If the changes are unexpected, you can investigate further by looking at another timeframe, determining if more nodes are now running OSPF than previously, looking for changes in the topology, and so forth.
To determine the devices with the most sessions, run netq show ospf. Then count the sessions on each device.
In this example, the leaf01-04 switches each have two sessions and the spine01-02 switches have four session each. Therefore the spine switches have the most sessions.
cumulus@switch:~$ netq show ospf
Matching ospf records:
Hostname Interface Area Type State Peer Hostname Peer Interface Last Changed
----------------- ------------------------- ------------ ---------------- ---------- ----------------- ------------------------- -------------------------
leaf01 swp51 0.0.0.0 Unnumbered Full spine01 swp1 Thu Feb 7 14:42:16 2019
leaf01 swp52 0.0.0.0 Unnumbered Full spine02 swp1 Thu Feb 7 14:42:16 2019
leaf02 swp51 0.0.0.0 Unnumbered Full spine01 swp2 Thu Feb 7 14:42:16 2019
leaf02 swp52 0.0.0.0 Unnumbered Full spine02 swp2 Thu Feb 7 14:42:16 2019
leaf03 swp51 0.0.0.0 Unnumbered Full spine01 swp3 Thu Feb 7 14:42:16 2019
leaf03 swp52 0.0.0.0 Unnumbered Full spine02 swp3 Thu Feb 7 14:42:16 2019
leaf04 swp51 0.0.0.0 Unnumbered Full spine01 swp4 Thu Feb 7 14:42:16 2019
leaf04 swp52 0.0.0.0 Unnumbered Full spine02 swp4 Thu Feb 7 14:42:16 2019
spine01 swp1 0.0.0.0 Unnumbered Full leaf01 swp51 Thu Feb 7 14:42:16 2019
spine01 swp2 0.0.0.0 Unnumbered Full leaf02 swp51 Thu Feb 7 14:42:16 2019
spine01 swp3 0.0.0.0 Unnumbered Full leaf03 swp51 Thu Feb 7 14:42:16 2019
spine01 swp4 0.0.0.0 Unnumbered Full leaf04 swp51 Thu Feb 7 14:42:16 2019
spine02 swp1 0.0.0.0 Unnumbered Full leaf01 swp52 Thu Feb 7 14:42:16 2019
spine02 swp2 0.0.0.0 Unnumbered Full leaf02 swp52 Thu Feb 7 14:42:16 2019
spine02 swp3 0.0.0.0 Unnumbered Full leaf03 swp52 Thu Feb 7 14:42:16 2019
spine02 swp4 0.0.0.0 Unnumbered Full leaf04 swp52 Thu Feb 7 14:42:16 2019
View Devices with the Most Unestablished OSPF Sessions
You can identify switches and hosts that are experiencing difficulties establishing OSPF sessions; both currently and in the past using the NetQ UI.
To view switches with the most unestablished OSPF sessions:
Open the large Network Services|All OSPF Sessions card.
Select Switches with Most Unestablished Sessions from the filter above the table.
The table content sorts by this characteristic, listing nodes with the most unestablished OSPF sessions at the top. Scroll down to view those with the fewest unestablished sessions.
Where to go next depends on what data you see, but a couple of options include:
Change the time period for the data to compare with a prior time.
If the same switches are consistently indicating the most unestablished sessions, you might want to look more carefully at those switches using the Switches card workflow to determine probable causes. Refer to Monitor Switch Performance.
Click Show All Sessions to investigate all OSPF sessions with events in the full screen card.
View Devices with the Most OSPF-related Alarms
Switches or hosts experiencing a large number of OSPF alarms might indicate a configuration or performance issue that needs further investigation. You can view the devices sorted by the number of OSPF alarms and then use the Switches card workflow or the Alarms card workflow to gather more information about possible causes for the alarms. Compare the number of nodes running OSPF with unestablished sessions with the alarms present at the same time to determine if there is any correlation between the issues and the ability to establish an OSPF session.
To view switches with the most OSPF alarms:
Open the large OSPF Service card.
Hover over the header and click .
Select Switches with Most Alarms from the filter above the table.
The table content is sorted by this characteristic, listing nodes with the most OSPF alarms at the top. Scroll down to view those with the fewest alarms.
Where to go next depends on what data you see, but a few options include:
Change the time period for the data to compare with a prior time. If the same switches are consistently indicating the most alarms, you might want to look more carefully at those switches using the Switches card workflow.
Click Show All Sessions to investigate all OSPF sessions with events in the full screen card.
View All OSPF Events
You can view all of the OSPF-related events in the network using the NetQ UI or the NetQ CLI.
The Network Services|All OSPF Sessions card enables you to view all of the OSPF events in the designated time period.
To view all OSPF events:
Open the full-screen Network Services|All OSPF Sessions card.
Click All Alarms in the navigation panel. By default, events are listed in most recent to least recent order.
Where to go next depends on what data you see, but a couple of options include:
Open one of the other full-screen tabs in this flow to focus on devices or sessions.
Export the data for use in another analytics tool, by clicking and providing a name for the data file.
To view OSPF events, run:
netq [<hostname>] show events [level info | level error | level warning | level critical | level debug] type ospf [between <text-time> and <text-endtime>] [json]
For example:
To view all OSPF events, run netq show events type ospf.
To view only critical OSPF events, run netq show events level critical type ospf.
To view all OSPF events in the past three days, run netq show events type ospf between now and 3d.
View Details for All Devices Running OSPF
You can view all stored attributes of all switches and hosts running OSPF in your network in the full screen card.
To view all device details, open the full screen OSPF Service card and click the All Switches tab.
To return to your workbench, click in the top right corner.
View Details for All OSPF Sessions
You can view all stored attributes of all OSPF sessions in your network with the NetQ UI or the NetQ CLI.
To view all session details, open the full screen Network Services|All OSPF Sessions card and click the All Sessions tab.
To return to your workbench, click in the top right corner.
Use the icons above the table to select/deselect, filter, and export items in the list. Refer to Table Settings for more detail. To return to original display of results, click the associated tab.
To view session details, run netq show ospf.
This example show all current sessions and the attributes associated with them.
cumulus@switch:~$ netq show ospf
Matching ospf records:
Hostname Interface Area Type State Peer Hostname Peer Interface Last Changed
----------------- ------------------------- ------------ ---------------- ---------- ----------------- ------------------------- -------------------------
leaf01 swp51 0.0.0.0 Unnumbered Full spine01 swp1 Thu Feb 7 14:42:16 2019
leaf01 swp52 0.0.0.0 Unnumbered Full spine02 swp1 Thu Feb 7 14:42:16 2019
leaf02 swp51 0.0.0.0 Unnumbered Full spine01 swp2 Thu Feb 7 14:42:16 2019
leaf02 swp52 0.0.0.0 Unnumbered Full spine02 swp2 Thu Feb 7 14:42:16 2019
leaf03 swp51 0.0.0.0 Unnumbered Full spine01 swp3 Thu Feb 7 14:42:16 2019
leaf03 swp52 0.0.0.0 Unnumbered Full spine02 swp3 Thu Feb 7 14:42:16 2019
leaf04 swp51 0.0.0.0 Unnumbered Full spine01 swp4 Thu Feb 7 14:42:16 2019
leaf04 swp52 0.0.0.0 Unnumbered Full spine02 swp4 Thu Feb 7 14:42:16 2019
spine01 swp1 0.0.0.0 Unnumbered Full leaf01 swp51 Thu Feb 7 14:42:16 2019
spine01 swp2 0.0.0.0 Unnumbered Full leaf02 swp51 Thu Feb 7 14:42:16 2019
spine01 swp3 0.0.0.0 Unnumbered Full leaf03 swp51 Thu Feb 7 14:42:16 2019
spine01 swp4 0.0.0.0 Unnumbered Full leaf04 swp51 Thu Feb 7 14:42:16 2019
spine02 swp1 0.0.0.0 Unnumbered Full leaf01 swp52 Thu Feb 7 14:42:16 2019
spine02 swp2 0.0.0.0 Unnumbered Full leaf02 swp52 Thu Feb 7 14:42:16 2019
spine02 swp3 0.0.0.0 Unnumbered Full leaf03 swp52 Thu Feb 7 14:42:16 2019
spine02 swp4 0.0.0.0 Unnumbered Full leaf04 swp52 Thu Feb 7 14:42:16 2019
Monitor a Single OSPF Session
With NetQ, you can monitor the performance of a single OSPF session using the NetQ UI or the NetQ CLI.
Network Services|OSPF Session
Small: view devices participating in the session and summary status
Medium: view devices participating in the session, summary status, session state changes, and key identifiers of the session
Large: view devices participating in the session, summary status, session state changes, event distribution and counts, attributes of the session, and the running OSPF configuration and changes to the configuration file
Full-screen: view all session attributes and all events
netq <hostname> show ospf command: view configuration and status for session by hostname, including interface, area, type, state, peer hostname, peer interface, and the last time this information changed
To access the single session cards, you must open the full screen Network Services|All OSPF Sessions card, click the All Sessions tab, select the desired session, then click (Open Card).
Granularity of Data Shown Based on Time Period
On the medium and large single OSPF session cards, vertically stacked heat maps represent the status of the sessions; one for established sessions, and one for unestablished sessions. Depending on the time period of data on the card, the number of smaller time blocks used to indicate the status varies. A vertical stack of time blocks, one from each map, includes the results from all checks during that time. The results appear by how saturated the color is for each block. If all sessions during that time period were established for the entire time block, then the top block is 100% saturated (white) and the unestablished block is zero percent saturated (gray). As sessions that are not established increase in saturation, the sessions that are established block is proportionally reduced in saturation. The following example heat map is for a time period of 24 hours, with the most common time periods in the table showing the resulting time blocks.
Time Period
Number of Runs
Number Time Blocks
Amount of Time in Each Block
6 hours
18
6
1 hour
12 hours
36
12
1 hour
24 hours
72
24
1 hour
1 week
504
7
1 day
1 month
2,086
30
1 day
1 quarter
7,000
13
1 week
View Session Status Summary
You can view a summary of a given OSPF session from the NetQ UI or NetQ CLI.
To view the summary:
Open the Network Services|All OSPF Sessions card.
Switch to the full-screen card using the card size picker.
Click the All Sessions tab.
Select the session of interest, then click (Open Card).
Optionally, switch to the small OSPF Session card.
To view a session summary, run:
netq <hostname> show ospf [<remote-interface>] [area <area-id>] [around <text-time>] [json]
Where:
remote-interface specifies the interface on host node
area filters for sessions occurring in a designated OSPF area
around shows status at a time in the past
json outputs the results in JSON format
This example show OSPF sessions on the leaf01 switch:
cumulus@switch:~$ netq leaf01 show ospf
Matching ospf records:
Hostname Interface Area Type State Peer Hostname Peer Interface Last Changed
----------------- ------------------------- ------------ ---------------- ---------- ----------------- ------------------------- -------------------------
leaf01 swp51 0.0.0.0 Unnumbered Full spine01 swp1 Thu Feb 7 14:42:16 2019
leaf01 swp52 0.0.0.0 Unnumbered Full spine02 swp1 Thu Feb 7 14:42:16 2019
This example shows OSPF sessions for all devices using the swp51 interface on the host node.
cumulus@switch:~$ netq show ospf swp51
Matching ospf records:
Hostname Interface Area Type State Peer Hostname Peer Interface Last Changed
----------------- ------------------------- ------------ ---------------- ---------- ----------------- ------------------------- -------------------------
leaf01 swp51 0.0.0.0 Unnumbered Full spine01 swp1 Thu Feb 7 14:42:16 2019
leaf02 swp51 0.0.0.0 Unnumbered Full spine01 swp2 Thu Feb 7 14:42:16 2019
leaf03 swp51 0.0.0.0 Unnumbered Full spine01 swp3 Thu Feb 7 14:42:16 2019
leaf04 swp51 0.0.0.0 Unnumbered Full spine01 swp4 Thu Feb 7 14:42:16 2019
View OSPF Session State Changes
You can view the state of a given OSPF session from the medium and large Network Service|All OSPF Sessions card. For a given time period, you can determine the stability of the OSPF session between two devices. If you experienced connectivity issues at a particular time, you can use these cards to help verify the state of the session. If it was not established more than it was established, you can then investigate further into possible causes.
To view the state transitions for a given OSPF session, on the medium OSPF Session card:
Open the Network Services|All OSPF Sessions card.
Switch to the full-screen card using the card size picker.
Click the All Sessions tab.
Select the session of interest. The full-screen card closes automatically.
The heat map indicates the status of the session over the designated time period. In this example, the session has been established for the entire time period.
From this card, you can also view the interface name, peer address, and peer id identifying the session in more detail.
To view the state transitions for a given OSPF session on the large OSPF Session card:
Open a Network Services|OSPF Session card.
Hover over the card, and change to the large card using the card size picker.
From this card, you can view the alarm and info event counts, interface name, peer address and peer id, state, and several other parameters identifying the session in more detail.
View Changes to the OSPF Service Configuration File
Each time a change is made to the configuration file for the OSPF service, NetQ logs the change and enables you to compare it with the last version using the NetQ UI. This can be useful when you are troubleshooting potential causes for alarms or sessions losing their connections.
To view the configuration file changes:
Open or add the Network Services|All OSPF Sessions card.
Switch to the full-screen card.
Click the All Sessions tab.
Select the session of interest. The full-screen card closes automatically.
Hover over the card, and change to the large card using the card size picker.
Hover over the card and click to open the Configuration File Evolution tab.
Select the time of interest on the left; when a change might have impacted the performance. Scroll down if needed.
Choose between the File view and the Diff view (selected option is dark; File by default).
The File view displays the content of the file for you to review.
The Diff view displays the changes between this version (on left) and the most recent version (on right) side by side. The changes are highlighted in red and green. In this example, we don’t have a change to highlight, so it shows the same file on both sides.
View All OSPF Session Details
You can view attributes of all of the OSPF sessions for the devices participating in a given session with the NetQ UI and the NetQ CLI.
To view all session details:
Open or add the Network Services|All OSPF Sessions card.
Switch to the full-screen card.
Click the All Sessions tab.
Select the session of interest. The full-screen card closes automatically.
Hover over the card, and change to the full-screen card using the card size picker.
To return to your workbench, click in the top right corner.
Run the netq show ospf command.
This example shows all OSPF sessions. Filter by remote interface or area to narrow the listing. Scroll until you find the session of interest.
cumulus@switch:~$ netq show ospf
Matching ospf records:
Hostname Interface Area Type State Peer Hostname Peer Interface Last Changed
----------------- ------------------------- ------------ ---------------- ---------- ----------------- ------------------------- -------------------------
leaf01 swp51 0.0.0.0 Unnumbered Full spine01 swp1 Thu Feb 7 14:42:16 2019
leaf01 swp52 0.0.0.0 Unnumbered Full spine02 swp1 Thu Feb 7 14:42:16 2019
leaf02 swp51 0.0.0.0 Unnumbered Full spine01 swp2 Thu Feb 7 14:42:16 2019
leaf02 swp52 0.0.0.0 Unnumbered Full spine02 swp2 Thu Feb 7 14:42:16 2019
leaf03 swp51 0.0.0.0 Unnumbered Full spine01 swp3 Thu Feb 7 14:42:16 2019
leaf03 swp52 0.0.0.0 Unnumbered Full spine02 swp3 Thu Feb 7 14:42:16 2019
leaf04 swp51 0.0.0.0 Unnumbered Full spine01 swp4 Thu Feb 7 14:42:16 2019
leaf04 swp52 0.0.0.0 Unnumbered Full spine02 swp4 Thu Feb 7 14:42:16 2019
spine01 swp1 0.0.0.0 Unnumbered Full leaf01 swp51 Thu Feb 7 14:42:16 2019
spine01 swp2 0.0.0.0 Unnumbered Full leaf02 swp51 Thu Feb 7 14:42:16 2019
spine01 swp3 0.0.0.0 Unnumbered Full leaf03 swp51 Thu Feb 7 14:42:16 2019
spine01 swp4 0.0.0.0 Unnumbered Full leaf04 swp51 Thu Feb 7 14:42:16 2019
spine02 swp1 0.0.0.0 Unnumbered Full leaf01 swp52 Thu Feb 7 14:42:16 2019
spine02 swp2 0.0.0.0 Unnumbered Full leaf02 swp52 Thu Feb 7 14:42:16 2019
spine02 swp3 0.0.0.0 Unnumbered Full leaf03 swp52 Thu Feb 7 14:42:16 2019
spine02 swp4 0.0.0.0 Unnumbered Full leaf04 swp52 Thu Feb 7 14:42:16 2019
View All Events for a Given Session
You can view all alarm and info events for the devices participating in a given session with the NetQ UI.
To view all events:
Open or add the Network Services|All OSPF Sessions card.
Switch to the full-screen card.
Click the All Sessions tab.
Select the session of interest. The full-screen card closes automatically.
Hover over the card, and change to the full-screen card using the card size picker.
Click the All Events tab.
To return to your workbench, click in the top right corner.
Monitor Virtual Network Overlays
Cumulus Linux supports network virtualization with EVPN and VXLANs. For more detail about network virtualization support, refer to the
Cumulus Linux user guide. For information about monitoring EVPN and VXLANs with NetQ, continue with the topics here.
Monitor the EVPN Service
EVPN (Ethernet Virtual Private Network) enables network administrators in the data center to deploy a virtual layer 2 bridge overlay on top of a layer 3 IP network, creating access, or a tunnel, between two locations. This connects devices in different layer 2 domains or sites running VXLANs and their associated underlays. For an overview and how to configure EVPN in your data center network, refer to
Ethernet Virtual Private Network-EVPN.
NetQ enables operators to view the health of the EVPN service on a networkwide and a per session basis, giving greater insight into all aspects of the service. You accomplish this through two card workflows, one for the service and one for the session, and in the NetQ CLI with the netq show evpn command.
Monitor the EVPN Service Networkwide
With NetQ, you can monitor EVPN performance across the network:
Network Services|All EVPN Sessions
Small: view number of nodes running EVPN service and number of alarms
Medium: view number of nodes running EVPN service, number of sessions, and number of alarms
Large: view number of nodes running EVPN service, number of sessions, number of VNIs, switches with the most sessions, and alarms
Full-screen: view all switches, all sessions, and all alarms
netq show evpn command: view configuration and status for all devices, including associated VNI, VTEP address, import and export route (showing BGP ASN and VNI path), and last time a change occurred for each device running EVPN
When entering a time value in the netq show evpn command, you must include a numeric value and the unit of measure:
w: weeks
d: days
h: hours
m: minutes
s: seconds
now
When using the between option, you can enter the start time (text-time) and end time (text-endtime) values as most recent first and least recent second, or vice versa. The values do not have to have the same unit of measure.
View the EVPN Service Status
You can view the configuration and status of your EVPN overlay across your network or for a particular device from the NetQ UI or the NetQ CLI. The example below shows the configuration and status for all devices, including the associated VNI, VTEP address, the import and export route (showing the BGP ASN and VNI path), and the last time a change occurred for each device running EVPN. Use the hostname option to view the configuration and status for a single device.
Open the small Network Services|All EVPN Sessions card. In this example, the number of devices running the EVPN service is six (6) and the number and distribution of related critical severity alarms is zero (0).
To view EVPN service status, run netq show evpn.
This example shows the Cumulus reference topology, where EVPN runs on all border and leaf switches. Each session is represented by a single row.
cumulus@switch:~$ netq show evpn
Matching evpn records:
Hostname VNI VTEP IP Type Mapping In Kernel Export RT Import RT Last Changed
----------------- ---------- ---------------- ---------------- -------------- --------- ---------------- ---------------- -------------------------
border01 4002 10.0.1.254 L3 Vrf BLUE yes 65132:4002 65132:4002 Wed Oct 7 00:49:27 2020
border01 4001 10.0.1.254 L3 Vrf RED yes 65132:4001 65132:4001 Wed Oct 7 00:49:27 2020
border02 4002 10.0.1.254 L3 Vrf BLUE yes 65132:4002 65132:4002 Wed Oct 7 00:48:47 2020
border02 4001 10.0.1.254 L3 Vrf RED yes 65132:4001 65132:4001 Wed Oct 7 00:48:47 2020
leaf01 10 10.0.1.1 L2 Vlan 10 yes 65101:10 65101:10 Wed Oct 7 00:49:30 2020
leaf01 30 10.0.1.1 L2 Vlan 30 yes 65101:30 65101:30 Wed Oct 7 00:49:30 2020
leaf01 4002 10.0.1.1 L3 Vrf BLUE yes 65101:4002 65101:4002 Wed Oct 7 00:49:30 2020
leaf01 4001 10.0.1.1 L3 Vrf RED yes 65101:4001 65101:4001 Wed Oct 7 00:49:30 2020
leaf01 20 10.0.1.1 L2 Vlan 20 yes 65101:20 65101:20 Wed Oct 7 00:49:30 2020
leaf02 10 10.0.1.1 L2 Vlan 10 yes 65101:10 65101:10 Wed Oct 7 00:48:25 2020
leaf02 20 10.0.1.1 L2 Vlan 20 yes 65101:20 65101:20 Wed Oct 7 00:48:25 2020
leaf02 4001 10.0.1.1 L3 Vrf RED yes 65101:4001 65101:4001 Wed Oct 7 00:48:25 2020
leaf02 4002 10.0.1.1 L3 Vrf BLUE yes 65101:4002 65101:4002 Wed Oct 7 00:48:25 2020
leaf02 30 10.0.1.1 L2 Vlan 30 yes 65101:30 65101:30 Wed Oct 7 00:48:25 2020
leaf03 4002 10.0.1.2 L3 Vrf BLUE yes 65102:4002 65102:4002 Wed Oct 7 00:50:13 2020
leaf03 10 10.0.1.2 L2 Vlan 10 yes 65102:10 65102:10 Wed Oct 7 00:50:13 2020
leaf03 30 10.0.1.2 L2 Vlan 30 yes 65102:30 65102:30 Wed Oct 7 00:50:13 2020
leaf03 20 10.0.1.2 L2 Vlan 20 yes 65102:20 65102:20 Wed Oct 7 00:50:13 2020
leaf03 4001 10.0.1.2 L3 Vrf RED yes 65102:4001 65102:4001 Wed Oct 7 00:50:13 2020
leaf04 4001 10.0.1.2 L3 Vrf RED yes 65102:4001 65102:4001 Wed Oct 7 00:50:09 2020
leaf04 4002 10.0.1.2 L3 Vrf BLUE yes 65102:4002 65102:4002 Wed Oct 7 00:50:09 2020
leaf04 20 10.0.1.2 L2 Vlan 20 yes 65102:20 65102:20 Wed Oct 7 00:50:09 2020
leaf04 10 10.0.1.2 L2 Vlan 10 yes 65102:10 65102:10 Wed Oct 7 00:50:09 2020
leaf04 30 10.0.1.2 L2 Vlan 30 yes 65102:30 65102:30 Wed Oct 7 00:50:09 2020
View the Distribution of Sessions and Alarms
It is useful to know the number of network nodes running the EVPN protocol over a period of time, as it gives you insight into the amount of traffic associated with and breadth of use of the protocol.
It is also useful to compare the number of nodes running EVPN with the alarms present at the same time to determine if there is any correlation between the issues and the ability to establish an EVPN session. This is visible with the NetQ UI.
Open the medium Network Services|All EVPN Sessions card. In this example there are no alarms, but there are three (3) VNIs.
If a visual correlation is apparent, you can dig a little deeper with the large card tabs.
To view the number of switches running the EVPN service, run:
netq show evpn
Count the switches in the output.
This example shows two border switches and four leaf switches are running the EVPN service, for a total of six (6).
cumulus@switch:~$ netq show evpn
Matching evpn records:
Hostname VNI VTEP IP Type Mapping In Kernel Export RT Import RT Last Changed
----------------- ---------- ---------------- ---------------- -------------- --------- ---------------- ---------------- -------------------------
border01 4002 10.0.1.254 L3 Vrf BLUE yes 65132:4002 65132:4002 Wed Oct 7 00:49:27 2020
border01 4001 10.0.1.254 L3 Vrf RED yes 65132:4001 65132:4001 Wed Oct 7 00:49:27 2020
border02 4002 10.0.1.254 L3 Vrf BLUE yes 65132:4002 65132:4002 Wed Oct 7 00:48:47 2020
border02 4001 10.0.1.254 L3 Vrf RED yes 65132:4001 65132:4001 Wed Oct 7 00:48:47 2020
leaf01 10 10.0.1.1 L2 Vlan 10 yes 65101:10 65101:10 Wed Oct 7 00:49:30 2020
leaf01 30 10.0.1.1 L2 Vlan 30 yes 65101:30 65101:30 Wed Oct 7 00:49:30 2020
leaf01 4002 10.0.1.1 L3 Vrf BLUE yes 65101:4002 65101:4002 Wed Oct 7 00:49:30 2020
leaf01 4001 10.0.1.1 L3 Vrf RED yes 65101:4001 65101:4001 Wed Oct 7 00:49:30 2020
leaf01 20 10.0.1.1 L2 Vlan 20 yes 65101:20 65101:20 Wed Oct 7 00:49:30 2020
leaf02 10 10.0.1.1 L2 Vlan 10 yes 65101:10 65101:10 Wed Oct 7 00:48:25 2020
leaf02 20 10.0.1.1 L2 Vlan 20 yes 65101:20 65101:20 Wed Oct 7 00:48:25 2020
leaf02 4001 10.0.1.1 L3 Vrf RED yes 65101:4001 65101:4001 Wed Oct 7 00:48:25 2020
leaf02 4002 10.0.1.1 L3 Vrf BLUE yes 65101:4002 65101:4002 Wed Oct 7 00:48:25 2020
leaf02 30 10.0.1.1 L2 Vlan 30 yes 65101:30 65101:30 Wed Oct 7 00:48:25 2020
leaf03 4002 10.0.1.2 L3 Vrf BLUE yes 65102:4002 65102:4002 Wed Oct 7 00:50:13 2020
leaf03 10 10.0.1.2 L2 Vlan 10 yes 65102:10 65102:10 Wed Oct 7 00:50:13 2020
leaf03 30 10.0.1.2 L2 Vlan 30 yes 65102:30 65102:30 Wed Oct 7 00:50:13 2020
leaf03 20 10.0.1.2 L2 Vlan 20 yes 65102:20 65102:20 Wed Oct 7 00:50:13 2020
leaf03 4001 10.0.1.2 L3 Vrf RED yes 65102:4001 65102:4001 Wed Oct 7 00:50:13 2020
leaf04 4001 10.0.1.2 L3 Vrf RED yes 65102:4001 65102:4001 Wed Oct 7 00:50:09 2020
leaf04 4002 10.0.1.2 L3 Vrf BLUE yes 65102:4002 65102:4002 Wed Oct 7 00:50:09 2020
leaf04 20 10.0.1.2 L2 Vlan 20 yes 65102:20 65102:20 Wed Oct 7 00:50:09 2020
leaf04 10 10.0.1.2 L2 Vlan 10 yes 65102:10 65102:10 Wed Oct 7 00:50:09 2020
leaf04 30 10.0.1.2 L2 Vlan 30 yes 65102:30 65102:30 Wed Oct 7 00:50:09 2020
To compare this count with the count at another time, run the netq show evpn command with the around option. Count the devices running EVPN at that time. Repeat with another time to collect a picture of changes over time.
View the Distribution of Layer 3 VNIs
It is useful to know the number sessions between devices and VNIs that are occurring over layer 3, as it gives you insight into the complexity of the VXLAN.
To view this distribution, open the large Network Services|All EVPN Services card and view the bottom chart on the left. In this example, there are 12 layer 3 EVPN sessions running on the three VNIs.
To view the distribution of switches running layer 3 VNIs, run:
netq show evpn
Count the switches using layer 3 VNIs (shown in the VNI and Type columns). Compare that to the total number of VNIs (count these from the VNI column) to determine the ratio of layer 3 versus the total VNIs.
This example shows two (2) layer 3 VNIs (4001 and 4002) and a total of five (5) VNIs (4001, 4002, 10, 20, 30). This then gives a distribution of 2/5 of the total, or 40%.
cumulus@switch:~$ netq show evpn
Matching evpn records:
Hostname VNI VTEP IP Type Mapping In Kernel Export RT Import RT Last Changed
----------------- ---------- ---------------- ---------------- -------------- --------- ---------------- ---------------- -------------------------
border01 4002 10.0.1.254 L3 Vrf BLUE yes 65132:4002 65132:4002 Wed Oct 7 00:49:27 2020
border01 4001 10.0.1.254 L3 Vrf RED yes 65132:4001 65132:4001 Wed Oct 7 00:49:27 2020
border02 4002 10.0.1.254 L3 Vrf BLUE yes 65132:4002 65132:4002 Wed Oct 7 00:48:47 2020
border02 4001 10.0.1.254 L3 Vrf RED yes 65132:4001 65132:4001 Wed Oct 7 00:48:47 2020
leaf01 10 10.0.1.1 L2 Vlan 10 yes 65101:10 65101:10 Wed Oct 7 00:49:30 2020
leaf01 30 10.0.1.1 L2 Vlan 30 yes 65101:30 65101:30 Wed Oct 7 00:49:30 2020
leaf01 4002 10.0.1.1 L3 Vrf BLUE yes 65101:4002 65101:4002 Wed Oct 7 00:49:30 2020
leaf01 4001 10.0.1.1 L3 Vrf RED yes 65101:4001 65101:4001 Wed Oct 7 00:49:30 2020
leaf01 20 10.0.1.1 L2 Vlan 20 yes 65101:20 65101:20 Wed Oct 7 00:49:30 2020
leaf02 10 10.0.1.1 L2 Vlan 10 yes 65101:10 65101:10 Wed Oct 7 00:48:25 2020
leaf02 20 10.0.1.1 L2 Vlan 20 yes 65101:20 65101:20 Wed Oct 7 00:48:25 2020
leaf02 4001 10.0.1.1 L3 Vrf RED yes 65101:4001 65101:4001 Wed Oct 7 00:48:25 2020
leaf02 4002 10.0.1.1 L3 Vrf BLUE yes 65101:4002 65101:4002 Wed Oct 7 00:48:25 2020
leaf02 30 10.0.1.1 L2 Vlan 30 yes 65101:30 65101:30 Wed Oct 7 00:48:25 2020
leaf03 4002 10.0.1.2 L3 Vrf BLUE yes 65102:4002 65102:4002 Wed Oct 7 00:50:13 2020
leaf03 10 10.0.1.2 L2 Vlan 10 yes 65102:10 65102:10 Wed Oct 7 00:50:13 2020
leaf03 30 10.0.1.2 L2 Vlan 30 yes 65102:30 65102:30 Wed Oct 7 00:50:13 2020
leaf03 20 10.0.1.2 L2 Vlan 20 yes 65102:20 65102:20 Wed Oct 7 00:50:13 2020
leaf03 4001 10.0.1.2 L3 Vrf RED yes 65102:4001 65102:4001 Wed Oct 7 00:50:13 2020
leaf04 4001 10.0.1.2 L3 Vrf RED yes 65102:4001 65102:4001 Wed Oct 7 00:50:09 2020
leaf04 4002 10.0.1.2 L3 Vrf BLUE yes 65102:4002 65102:4002 Wed Oct 7 00:50:09 2020
leaf04 20 10.0.1.2 L2 Vlan 20 yes 65102:20 65102:20 Wed Oct 7 00:50:09 2020
leaf04 10 10.0.1.2 L2 Vlan 10 yes 65102:10 65102:10 Wed Oct 7 00:50:09 2020
leaf04 30 10.0.1.2 L2 Vlan 30 yes 65102:30 65102:30 Wed Oct 7 00:50:09 2020
View Devices with the Most EVPN Sessions
You can view the load from EVPN on your switches and hosts using the large Network Services|All EVPN Sessions card or the NetQ CLI. This data enables you to see which switches are handling the most EVPN traffic currently, validate that is what you expect based on your network design, and compare that with data from an earlier time to look for any differences.
To view switches and hosts with the most EVPN sessions:
Open the large Network Services|All EVPN Sessions card.
Select Top Switches with Most Sessions from the filter above the table.
The table content sorts by this characteristic, listing nodes running the most EVPN sessions at the top. Scroll down to view those with the fewest sessions.
To compare this data with the same data at a previous time:
Open another large Network Services|All EVPN Sessions card.
Move the new card next to the original card if needed.
Change the time period for the data on the new card by hovering over the card and clicking .
Select the time period that you want to compare with the current time.
You can now see whether there are significant differences between this time period and the previous time period.
You can now see whether there are significant differences between this time and the original time. If the changes are unexpected, you can investigate further by looking at another timeframe, determining if more nodes are now running EVPN than previously, looking for changes in the topology, and so forth.
To determine the devices with the most sessions, run netq show evpn. Then count the sessions on each device.
In this example, border01 and border02 each have 2 sessions. The leaf01-04 switches each have 5 sessions. Therefore the leaf switches have the most sessions.
cumulus@switch:~$ netq show evpn
Matching evpn records:
Hostname VNI VTEP IP Type Mapping In Kernel Export RT Import RT Last Changed
----------------- ---------- ---------------- ---------------- -------------- --------- ---------------- ---------------- -------------------------
border01 4002 10.0.1.254 L3 Vrf BLUE yes 65132:4002 65132:4002 Wed Oct 7 00:49:27 2020
border01 4001 10.0.1.254 L3 Vrf RED yes 65132:4001 65132:4001 Wed Oct 7 00:49:27 2020
border02 4002 10.0.1.254 L3 Vrf BLUE yes 65132:4002 65132:4002 Wed Oct 7 00:48:47 2020
border02 4001 10.0.1.254 L3 Vrf RED yes 65132:4001 65132:4001 Wed Oct 7 00:48:47 2020
leaf01 10 10.0.1.1 L2 Vlan 10 yes 65101:10 65101:10 Wed Oct 7 00:49:30 2020
leaf01 30 10.0.1.1 L2 Vlan 30 yes 65101:30 65101:30 Wed Oct 7 00:49:30 2020
leaf01 4002 10.0.1.1 L3 Vrf BLUE yes 65101:4002 65101:4002 Wed Oct 7 00:49:30 2020
leaf01 4001 10.0.1.1 L3 Vrf RED yes 65101:4001 65101:4001 Wed Oct 7 00:49:30 2020
leaf01 20 10.0.1.1 L2 Vlan 20 yes 65101:20 65101:20 Wed Oct 7 00:49:30 2020
leaf02 10 10.0.1.1 L2 Vlan 10 yes 65101:10 65101:10 Wed Oct 7 00:48:25 2020
leaf02 20 10.0.1.1 L2 Vlan 20 yes 65101:20 65101:20 Wed Oct 7 00:48:25 2020
leaf02 4001 10.0.1.1 L3 Vrf RED yes 65101:4001 65101:4001 Wed Oct 7 00:48:25 2020
leaf02 4002 10.0.1.1 L3 Vrf BLUE yes 65101:4002 65101:4002 Wed Oct 7 00:48:25 2020
leaf02 30 10.0.1.1 L2 Vlan 30 yes 65101:30 65101:30 Wed Oct 7 00:48:25 2020
leaf03 4002 10.0.1.2 L3 Vrf BLUE yes 65102:4002 65102:4002 Wed Oct 7 00:50:13 2020
leaf03 10 10.0.1.2 L2 Vlan 10 yes 65102:10 65102:10 Wed Oct 7 00:50:13 2020
leaf03 30 10.0.1.2 L2 Vlan 30 yes 65102:30 65102:30 Wed Oct 7 00:50:13 2020
leaf03 20 10.0.1.2 L2 Vlan 20 yes 65102:20 65102:20 Wed Oct 7 00:50:13 2020
leaf03 4001 10.0.1.2 L3 Vrf RED yes 65102:4001 65102:4001 Wed Oct 7 00:50:13 2020
leaf04 4001 10.0.1.2 L3 Vrf RED yes 65102:4001 65102:4001 Wed Oct 7 00:50:09 2020
leaf04 4002 10.0.1.2 L3 Vrf BLUE yes 65102:4002 65102:4002 Wed Oct 7 00:50:09 2020
leaf04 20 10.0.1.2 L2 Vlan 20 yes 65102:20 65102:20 Wed Oct 7 00:50:09 2020
leaf04 10 10.0.1.2 L2 Vlan 10 yes 65102:10 65102:10 Wed Oct 7 00:50:09 2020
leaf04 30 10.0.1.2 L2 Vlan 30 yes 65102:30 65102:30 Wed Oct 7 00:50:09 2020
To compare this with a time in the past, run netq show evpn .
In this example, there are significant changes from the output above, indicating a significant reconfiguration.
You can view the number layer 2 EVPN sessions on your switches and hosts using the large Network Services|All EVPN Sessions card and the NetQ CLI. This data enables you to see which switches are handling the most EVPN traffic currently, validate that is what you expect based on your network design, and compare that with data from an earlier time to look for any differences.
To view switches and hosts with the most layer 2 EVPN sessions:
Open the large Network Services|All EVPN Sessions card.
Select Switches with Most L2 EVPN from the filter above the table.
The table content is sorted by this characteristic, listing nodes running the most layer 2 EVPN sessions at the top. Scroll down to view those with the fewest sessions.
To compare this data with the same data at a previous time:
Open another large Network Services|All EVPN Sessions card.
Move the new card next to the original card if needed.
Change the time period for the data on the new card by hovering over the card and clicking .
Select the time period that you want to compare with the current time.
You can now see whether there are significant differences between this time period and the previous time period.
If the changes are unexpected, you can investigate further by looking at another timeframe, determining if more nodes are now running EVPN than previously, looking for changes in the topology, and so forth.
To determine the devices with the most layer 2 EVPN sessions, run netq show evpn, then count the layer 2 sessions.
In this example, border01 and border02 have no layer 2 sessions. The leaf01-04 switches each have three layer 2 sessions. Therefore the leaf switches have the most layer 2 sessions.
cumulus@switch:~$ netq show evpn
Matching evpn records:
Hostname VNI VTEP IP Type Mapping In Kernel Export RT Import RT Last Changed
----------------- ---------- ---------------- ---------------- -------------- --------- ---------------- ---------------- -------------------------
border01 4002 10.0.1.254 L3 Vrf BLUE yes 65132:4002 65132:4002 Wed Oct 7 00:49:27 2020
border01 4001 10.0.1.254 L3 Vrf RED yes 65132:4001 65132:4001 Wed Oct 7 00:49:27 2020
border02 4002 10.0.1.254 L3 Vrf BLUE yes 65132:4002 65132:4002 Wed Oct 7 00:48:47 2020
border02 4001 10.0.1.254 L3 Vrf RED yes 65132:4001 65132:4001 Wed Oct 7 00:48:47 2020
leaf01 10 10.0.1.1 L2 Vlan 10 yes 65101:10 65101:10 Wed Oct 7 00:49:30 2020
leaf01 30 10.0.1.1 L2 Vlan 30 yes 65101:30 65101:30 Wed Oct 7 00:49:30 2020
leaf01 4002 10.0.1.1 L3 Vrf BLUE yes 65101:4002 65101:4002 Wed Oct 7 00:49:30 2020
leaf01 4001 10.0.1.1 L3 Vrf RED yes 65101:4001 65101:4001 Wed Oct 7 00:49:30 2020
leaf01 20 10.0.1.1 L2 Vlan 20 yes 65101:20 65101:20 Wed Oct 7 00:49:30 2020
leaf02 10 10.0.1.1 L2 Vlan 10 yes 65101:10 65101:10 Wed Oct 7 00:48:25 2020
leaf02 20 10.0.1.1 L2 Vlan 20 yes 65101:20 65101:20 Wed Oct 7 00:48:25 2020
leaf02 4001 10.0.1.1 L3 Vrf RED yes 65101:4001 65101:4001 Wed Oct 7 00:48:25 2020
leaf02 4002 10.0.1.1 L3 Vrf BLUE yes 65101:4002 65101:4002 Wed Oct 7 00:48:25 2020
leaf02 30 10.0.1.1 L2 Vlan 30 yes 65101:30 65101:30 Wed Oct 7 00:48:25 2020
leaf03 4002 10.0.1.2 L3 Vrf BLUE yes 65102:4002 65102:4002 Wed Oct 7 00:50:13 2020
leaf03 10 10.0.1.2 L2 Vlan 10 yes 65102:10 65102:10 Wed Oct 7 00:50:13 2020
leaf03 30 10.0.1.2 L2 Vlan 30 yes 65102:30 65102:30 Wed Oct 7 00:50:13 2020
leaf03 20 10.0.1.2 L2 Vlan 20 yes 65102:20 65102:20 Wed Oct 7 00:50:13 2020
leaf03 4001 10.0.1.2 L3 Vrf RED yes 65102:4001 65102:4001 Wed Oct 7 00:50:13 2020
leaf04 4001 10.0.1.2 L3 Vrf RED yes 65102:4001 65102:4001 Wed Oct 7 00:50:09 2020
leaf04 4002 10.0.1.2 L3 Vrf BLUE yes 65102:4002 65102:4002 Wed Oct 7 00:50:09 2020
leaf04 20 10.0.1.2 L2 Vlan 20 yes 65102:20 65102:20 Wed Oct 7 00:50:09 2020
leaf04 10 10.0.1.2 L2 Vlan 10 yes 65102:10 65102:10 Wed Oct 7 00:50:09 2020
leaf04 30 10.0.1.2 L2 Vlan 30 yes 65102:30 65102:30 Wed Oct 7 00:50:09 2020
To compare this with a time in the past, run netq show evpn around.
In this example, border01 and border02 each have three layer 2 sessions. Leaf01-04 also have three layer 2 sessions. Therefore no switch has any more layer 2 sessions than any other running the EVPN service 14 days ago.
You can view the number layer 3 EVPN sessions on your switches and hosts using the large Network Services|All EVPN Sessions card and the NetQ CLI. This data enables you to see which switches are handling the most EVPN traffic currently, validate that is what you expect based on your network design, and compare that with data from an earlier time to look for any differences.
To view switches and hosts with the most layer 3 EVPN sessions:
Open the large Network Services|All EVPN Sessions card.
Select Switches with Most L3 EVPN from the filter above the table.
The table content is sorted by this characteristic, listing nodes running the most layer 3 EVPN sessions at the top. Scroll down to view those with the fewest sessions.
To compare this data with the same data at a previous time:
Open another large Network Services|All EVPN Sessions card.
Move the new card next to the original card if needed.
Change the time period for the data on the new card by hovering over the card and clicking .
Select the time period that you want to compare with the current time.
You can now see whether there are significant differences between this time period and the previous time period.
If the changes are unexpected, you can investigate further by looking at another timeframe, determining if more nodes are now running EVPN than previously, looking for changes in the topology, and so forth.
To determine the devices with the most layer 3 EVPN sessions, run netq show evpn, then count the layer 3 sessions.
In this example, border01 and border02 each have two layer 3 sessions. The leaf01-04 switches also each have two layer 3 sessions. Therefore there is no particular switch that has the most layer 3 sessions.
cumulus@switch:~$ netq show evpn
Matching evpn records:
Hostname VNI VTEP IP Type Mapping In Kernel Export RT Import RT Last Changed
----------------- ---------- ---------------- ---------------- -------------- --------- ---------------- ---------------- -------------------------
border01 4002 10.0.1.254 L3 Vrf BLUE yes 65132:4002 65132:4002 Wed Oct 7 00:49:27 2020
border01 4001 10.0.1.254 L3 Vrf RED yes 65132:4001 65132:4001 Wed Oct 7 00:49:27 2020
border02 4002 10.0.1.254 L3 Vrf BLUE yes 65132:4002 65132:4002 Wed Oct 7 00:48:47 2020
border02 4001 10.0.1.254 L3 Vrf RED yes 65132:4001 65132:4001 Wed Oct 7 00:48:47 2020
leaf01 10 10.0.1.1 L2 Vlan 10 yes 65101:10 65101:10 Wed Oct 7 00:49:30 2020
leaf01 30 10.0.1.1 L2 Vlan 30 yes 65101:30 65101:30 Wed Oct 7 00:49:30 2020
leaf01 4002 10.0.1.1 L3 Vrf BLUE yes 65101:4002 65101:4002 Wed Oct 7 00:49:30 2020
leaf01 4001 10.0.1.1 L3 Vrf RED yes 65101:4001 65101:4001 Wed Oct 7 00:49:30 2020
leaf01 20 10.0.1.1 L2 Vlan 20 yes 65101:20 65101:20 Wed Oct 7 00:49:30 2020
leaf02 10 10.0.1.1 L2 Vlan 10 yes 65101:10 65101:10 Wed Oct 7 00:48:25 2020
leaf02 20 10.0.1.1 L2 Vlan 20 yes 65101:20 65101:20 Wed Oct 7 00:48:25 2020
leaf02 4001 10.0.1.1 L3 Vrf RED yes 65101:4001 65101:4001 Wed Oct 7 00:48:25 2020
leaf02 4002 10.0.1.1 L3 Vrf BLUE yes 65101:4002 65101:4002 Wed Oct 7 00:48:25 2020
leaf02 30 10.0.1.1 L2 Vlan 30 yes 65101:30 65101:30 Wed Oct 7 00:48:25 2020
leaf03 4002 10.0.1.2 L3 Vrf BLUE yes 65102:4002 65102:4002 Wed Oct 7 00:50:13 2020
leaf03 10 10.0.1.2 L2 Vlan 10 yes 65102:10 65102:10 Wed Oct 7 00:50:13 2020
leaf03 30 10.0.1.2 L2 Vlan 30 yes 65102:30 65102:30 Wed Oct 7 00:50:13 2020
leaf03 20 10.0.1.2 L2 Vlan 20 yes 65102:20 65102:20 Wed Oct 7 00:50:13 2020
leaf03 4001 10.0.1.2 L3 Vrf RED yes 65102:4001 65102:4001 Wed Oct 7 00:50:13 2020
leaf04 4001 10.0.1.2 L3 Vrf RED yes 65102:4001 65102:4001 Wed Oct 7 00:50:09 2020
leaf04 4002 10.0.1.2 L3 Vrf BLUE yes 65102:4002 65102:4002 Wed Oct 7 00:50:09 2020
leaf04 20 10.0.1.2 L2 Vlan 20 yes 65102:20 65102:20 Wed Oct 7 00:50:09 2020
leaf04 10 10.0.1.2 L2 Vlan 10 yes 65102:10 65102:10 Wed Oct 7 00:50:09 2020
leaf04 30 10.0.1.2 L2 Vlan 30 yes 65102:30 65102:30 Wed Oct 7 00:50:09 2020
To compare this with a time in the past, run netq show evpn around.
In this example, border01 and border02 each have two layer 3 sessions. Leaf01-04 also have two layer 3 sessions. Therefore no switch has any more layer 3 sessions than any other running the EVPN service 14 days ago.
You can view the status of the EVPN service on a single VNI using the full-screen Network Services|All Sessions card or the NetQ CLI.
Open the full-screen Network Services|All Sessions card.
Sort the table based on the VNI column.
Page forward and backward to find the VNI of interest and then view the status of the service for that VNI.
Use the vni option with the netq show evpn command to filter the result for a specific VNI.
This example only shows the EVPN configuration and status for VNI 4001.
cumulus@switch:~$ netq show evpn vni 4001
Matching evpn records:
Hostname VNI VTEP IP Type Mapping In Kernel Export RT Import RT Last Changed
----------------- ---------- ---------------- ---------------- -------------- --------- ---------------- ---------------- -------------------------
border01 4001 10.0.1.254 L3 Vrf RED yes 65132:4001 65132:4001 Mon Oct 12 03:45:45 2020
border02 4001 10.0.1.254 L3 Vrf RED yes 65132:4001 65132:4001 Mon Oct 12 03:45:11 2020
leaf01 4001 10.0.1.1 L3 Vrf RED yes 65101:4001 65101:4001 Mon Oct 12 03:46:15 2020
leaf02 4001 10.0.1.1 L3 Vrf RED yes 65101:4001 65101:4001 Mon Oct 12 03:44:18 2020
leaf03 4001 10.0.1.2 L3 Vrf RED yes 65102:4001 65102:4001 Mon Oct 12 03:48:22 2020
leaf04 4001 10.0.1.2 L3 Vrf RED yes 65102:4001 65102:4001 Mon Oct 12 03:47:47 2020
View Devices with the Most EVPN-related Alarms
Switches experiencing a large number of EVPN alarms can indicate a configuration or performance issue that needs further investigation. You can view the switches sorted by the number of EVPN alarms and then use the Switches card workflow or the Events|Alarms card workflow to gather more information about possible causes for the alarms.
You can view the switches sorted by the number of EVPN alarms and then use the Switches card workflow or the Events|Alarms card workflow to gather more information about possible causes for the alarms.
To view switches with the most EVPN alarms:
Open the large Network Services|All EVPN Sessions card.
Hover over the header and click .
Select Events by Most Active Device from the filter above the table.
The table content sorts by this characteristic, listing nodes with the most EVPN alarms at the top. Scroll down to view those with the fewest alarms.
Where to go next depends on what data you see, but a few options include:
Hover over the Total Alarms chart to focus on the switches exhibiting alarms during that smaller time slice. The table content changes to match the hovered content. Click on the chart to persist the table changes.
Change the time period for the data to compare with a prior time. If the same switches are consistently indicating the most alarms, you might want to look more carefully at those switches using the Switches card workflow.
Click Show All Sessions to investigate all EVPN sessions networkwide in the full screen card.
To view the switches with the most EVPN alarms and informational events, run the netq show events command with the type option set to evpn, and optionally the between option set to display the events within a given time range. Count the events associated with each switch.
This example shows the events that have occurred in the last 48 hours.
cumulus@switch:/$ netq show events type evpn between now and 48h
Matching events records:
Hostname Message Type Severity Message Timestamp
----------------- ------------ -------- ----------------------------------- -------------------------
torc-21 evpn info VNI 33 state changed from down to u 1d:8h:16m:29s
p
torc-12 evpn info VNI 41 state changed from down to u 1d:8h:16m:35s
p
torc-11 evpn info VNI 39 state changed from down to u 1d:8h:16m:41s
p
tor-1 evpn info VNI 37 state changed from down to u 1d:8h:16m:47s
p
tor-2 evpn info VNI 42 state changed from down to u 1d:8h:16m:51s
p
torc-22 evpn info VNI 39 state changed from down to u 1d:8h:17m:40s
p
...
View All EVPN Events
The Network Services|All EVPN Sessions card workflow and the netq show events type evpn command enable you to view all EVPN events in a designated time period.
To view all EVPN events:
Open the full screen Network Services|All EVPN Sessions card.
Click All Alarms tab in the navigation panel. By default, events sort by time, with most recent events listed first.
Where to go next depends on what data you see, but a few options include:
Open one of the other full screen tabs in this flow to focus on devices or sessions.
Sort by the Message or Severity to narrow your focus.
Export the data for use in another analytics tool, by selecting all or some of the events and clicking .
Click at the top right to return to your workbench.
To view all EVPN alarms, run:
netq show events [level info | level error | level warning | level critical | level debug] type evpn [between <text-time> and <text-endtime>] [json]
Use the level option to set the severity of the events to show. Use the between option to show events within a given time range.
This example shows critical EVPN events in the past three days.
cumulus@switch:~$ netq show events level critical type evpn between now and 3d
View Details for All Devices Running EVPN
You can view all stored attributes of all switches running EVPN in your network in the full screen card.
To view all switch and host details, open the full screen EVPN Service card, and click the All Switches tab.
To return to your workbench, click at the top right.
View Details for All EVPN Sessions
You can view attributes of all EVPN sessions in your network with the NetQ UI or NetQ CLI.
To view all session details, open the full screen EVPN Service card, and click the All Sessions tab.
To return to your workbench, click at the top right.
Use the icons above the table to select/deselect, filter, and export items in the list. Refer to Table Settings for more detail.
To view session details, run netq show evpn.
This example shows all current sessions and the attributes associated with them.
cumulus@switch:~$ netq show evpn
Matching evpn records:
Hostname VNI VTEP IP Type Mapping In Kernel Export RT Import RT Last Changed
----------------- ---------- ---------------- ---------------- -------------- --------- ---------------- ---------------- -------------------------
border01 4002 10.0.1.254 L3 Vrf BLUE yes 65132:4002 65132:4002 Wed Oct 7 00:49:27 2020
border01 4001 10.0.1.254 L3 Vrf RED yes 65132:4001 65132:4001 Wed Oct 7 00:49:27 2020
border02 4002 10.0.1.254 L3 Vrf BLUE yes 65132:4002 65132:4002 Wed Oct 7 00:48:47 2020
border02 4001 10.0.1.254 L3 Vrf RED yes 65132:4001 65132:4001 Wed Oct 7 00:48:47 2020
leaf01 10 10.0.1.1 L2 Vlan 10 yes 65101:10 65101:10 Wed Oct 7 00:49:30 2020
leaf01 30 10.0.1.1 L2 Vlan 30 yes 65101:30 65101:30 Wed Oct 7 00:49:30 2020
leaf01 4002 10.0.1.1 L3 Vrf BLUE yes 65101:4002 65101:4002 Wed Oct 7 00:49:30 2020
leaf01 4001 10.0.1.1 L3 Vrf RED yes 65101:4001 65101:4001 Wed Oct 7 00:49:30 2020
leaf01 20 10.0.1.1 L2 Vlan 20 yes 65101:20 65101:20 Wed Oct 7 00:49:30 2020
leaf02 10 10.0.1.1 L2 Vlan 10 yes 65101:10 65101:10 Wed Oct 7 00:48:25 2020
leaf02 20 10.0.1.1 L2 Vlan 20 yes 65101:20 65101:20 Wed Oct 7 00:48:25 2020
leaf02 4001 10.0.1.1 L3 Vrf RED yes 65101:4001 65101:4001 Wed Oct 7 00:48:25 2020
leaf02 4002 10.0.1.1 L3 Vrf BLUE yes 65101:4002 65101:4002 Wed Oct 7 00:48:25 2020
leaf02 30 10.0.1.1 L2 Vlan 30 yes 65101:30 65101:30 Wed Oct 7 00:48:25 2020
leaf03 4002 10.0.1.2 L3 Vrf BLUE yes 65102:4002 65102:4002 Wed Oct 7 00:50:13 2020
leaf03 10 10.0.1.2 L2 Vlan 10 yes 65102:10 65102:10 Wed Oct 7 00:50:13 2020
leaf03 30 10.0.1.2 L2 Vlan 30 yes 65102:30 65102:30 Wed Oct 7 00:50:13 2020
leaf03 20 10.0.1.2 L2 Vlan 20 yes 65102:20 65102:20 Wed Oct 7 00:50:13 2020
leaf03 4001 10.0.1.2 L3 Vrf RED yes 65102:4001 65102:4001 Wed Oct 7 00:50:13 2020
leaf04 4001 10.0.1.2 L3 Vrf RED yes 65102:4001 65102:4001 Wed Oct 7 00:50:09 2020
leaf04 4002 10.0.1.2 L3 Vrf BLUE yes 65102:4002 65102:4002 Wed Oct 7 00:50:09 2020
leaf04 20 10.0.1.2 L2 Vlan 20 yes 65102:20 65102:20 Wed Oct 7 00:50:09 2020
leaf04 10 10.0.1.2 L2 Vlan 10 yes 65102:10 65102:10 Wed Oct 7 00:50:09 2020
leaf04 30 10.0.1.2 L2 Vlan 30 yes 65102:30 65102:30 Wed Oct 7 00:50:09 2020
Monitor a Single EVPN Session
With NetQ, you can monitor the performance of a single EVPN session using the NetQ UI or NetQ CLI.
Network Services|EVPN Session
Small: view associated VNI name and total number of nodes with VNIs configured
Medium: view associated VNI name and type, total number and distribution of nodes with VNIs configured
Large: view total number and distribution of nodes with VNIs configured, total alarm and informational events, and associated VRF/VLAN
Full-screen: view details of sessions-import/export route, type, origin IP address, VNI, VNI/gateway advertisement, and so forth
netq <hostname> show evpn vni command: view configuration and status for session (hostname, VNI), VTEP address, import and export route, and last time a change occurred
To access the single session cards, you must open the full-screen Network Services|All EVPN Sessions card, click the All Sessions tab, select the desired session, then click (Open Card).
View Session Status Summary
You can view a summary of a given EVPN session from the NetQ UI or NetQ CLI.
To view the summary:
Open the Network Services|All EVPN Sessions card.
Change to the full-screen card using the card size picker.
Click the All Sessions tab.
Select the session of interest, then click (Open Card).
To view a session summary, run:
netq <hostname> show evpn vni <text-vni> [around <text-time>] [json]
Use the around option to show status at a time in the past. Output the results in JSON format using the json option.
This example shows the summary information for the session on leaf01 for VNI 4001.
cumulus@switch:~$ netq leaf01 show evpn vni 4001
Matching evpn records:
Hostname VNI VTEP IP Type Mapping In Kernel Export RT Import RT Last Changed
----------------- ---------- ---------------- ---------------- -------------- --------- ---------------- ---------------- -------------------------
leaf01 4001 10.0.1.1 L3 Vrf RED yes 65101:4001 65101:4001 Tue Oct 13 04:21:15 2020
View VTEP Count
You can view the number of VTEPs (VXLAN Tunnel Endpoints) for a given EVPN session from the medium and large Network Services|EVPN Session cards.
To view the count for a given EVPN session, on the medium EVPN Session
card:
Open the Network Services|All EVPN Sessions card.
Change to the full-screen card using the card size picker.
Click the All Sessions tab.
Select the session of interest, then click (Open Card).
The same information is available on the large size card. Use the card size picker to open the large card.
This card also shows the associated VRF (layer 3) or VLAN (layer 2) on each device participating in this session.
View VTEP IP Address
You can view the IP address of the VTEP used in a given session using the netq show evpn command.
This example shows a VTEP address of 10.0.1.1 for the leaf01:VNI 4001 EVPN session.
cumulus@switch:~$ netq leaf01 show evpn vni 4001
Matching evpn records:
Hostname VNI VTEP IP Type Mapping In Kernel Export RT Import RT Last Changed
----------------- ---------- ---------------- ---------------- -------------- --------- ---------------- ---------------- -------------------------
leaf01 4001 10.0.1.1 L3 Vrf RED yes 65101:4001 65101:4001 Tue Oct 13 04:21:15 2020
View All EVPN Sessions on a VNI
You can view the attributes of all EVPN sessions for a given VNI using the NetQ UI or NetQ CLI.
You can view all stored attributes of all EVPN sessions running networkwide.
To view all session details, open the full screen EVPN Session card and click the All EVPN Sessions tab.
To return to your workbench, click in the top right of the card.
To view the sessions, run netq show evpn with the vni option.
This example shows all sessions for VNI 20.
cumulus@switch:~$ netq show evpn vni 20
Matching evpn records:
Hostname VNI VTEP IP Type Mapping In Kernel Export RT Import RT Last Changed
----------------- ---------- ---------------- ---------------- -------------- --------- ---------------- ---------------- -------------------------
leaf01 20 10.0.1.1 L2 Vlan 20 yes 65101:20 65101:20 Wed Oct 14 04:56:31 2020
leaf02 20 10.0.1.1 L2 Vlan 20 yes 65101:20 65101:20 Wed Oct 14 04:54:29 2020
leaf03 20 10.0.1.2 L2 Vlan 20 yes 65102:20 65102:20 Wed Oct 14 04:58:57 2020
leaf04 20 10.0.1.2 L2 Vlan 20 yes 65102:20 65102:20 Wed Oct 14 04:58:46 2020
View All Session Events
You can view all alarm and info events for a given session with the NetQ UI.
To view all events, open the full-screen Network Services|EVPN Session card and click the All Events tab.
Where to go next depends on what data you see, but a few options include:
Open one of the other full screen tabs in this flow to focus on sessions.
Sort by the Message or Severity to narrow your focus.
Export the data for use in another analytics tool, by selecting all or some of the events and clicking .
Click at the top right to return to your workbench.
Monitor the RoCE Service
RDMA over Converged Ethernet (RoCE) provides the ability to write to compute or storage elements using remote direct memory access (RDMA) over an Ethernet network instead of using host CPUs. RoCE relies on congestion control and lossless Ethernet to operate. Cumulus Linux and SONiC both support features that can enable lossless Ethernet for RoCE environments.
RoCE helps you obtain a converged network, where all services run over the Ethernet infrastructure, including Infiniband apps.
You monitor RoCE in your network with the UI and with the following CLI commands:
netq [<hostname>] show roce-counters [<text-port>] tx | rx [roce | general] [around <text-time>] [json]
netq [<hostname>] show roce-config [<text-port>] [around <text-time>] [json]
netq [<hostname>] show roce-counters pool [json]
netq [<hostname>] show events tca_roce
netq [<hostname>] show events roceconfig
View the RoCE Configuration
To view the RoCE configuration, run netq show roce-config:
To view RoCE counter pools, open the large switch card, then click the RoCE icon ().
Switch to the full-screen card, then click RoCE Counters. Look for these columns: Lossy Default Ingress Size, RoCE Reserved Ingress Size, Lossy Default Egress Size, and RoCE Reserved Egress Size.
To view the RoCE counter pools, run netq show roce-counters pool:
cumulus@switch:~$ netq show roce-counters pool
Matching roce records:
Hostname Lossy Default Ingress Size Roce Reserved Ingress Size Lossy Default Egress Size Roce Reserved Egress Size
----------------- ------------------------------ ------------------------------ ------------------------------ ------------------------------
switch 104823 104823 104823 104823
View Counters for a Specific Switch Port
To view counters for a specific port:
Open the large switch card, then click the RoCE icon ().
Select a port on the left.
To view counters for a specific switch port, include the switch name with the command.
cumulus@switch:~$ netq show roce-counters swp1s1 rx general
Matching roce records:
Hostname Interface PG packets PG bytes no buffer discard buffer usage buffer max usage PG usage PG max usage
----------------- -------------------- -------------------- -------------------- -------------------- -------------------- -------------------- -------------------- --------------------
switch swp1s1 1643392 154094520 0 0 1 0 1
View Results from a Time in the Past
To view counters for a different time period in the past:
Open the large switch card, then click the RoCE icon ().
Click in the header and select a different time period.
You can use the around keyword with any RoCE-related command to go back in time to view counters.
cumulus@switch:~$ netq show roce-counters swp1s1 rx general around 1h
Matching roce records:
Hostname Interface PG packets PG bytes no buffer discard buffer usage buffer max usage PG usage PG max usage
----------------- -------------------- -------------------- -------------------- -------------------- -------------------- -------------------- -------------------- --------------------
switch swp1s1 661 61856 0 0 1 0 1
Disable RoCE Monitoring
If you need to disable RoCE monitoring, do the following:
Edit /etc/netq/commands/cl4-netq-commands.yml and comment out the following lines:
VXLANs provide a way to create a virtual network on top of layer 2 and layer 3 technologies. Organizations, such as data centers, use them because they require larger scale without additional infrastructure and more flexibility than is available with existing infrastructure equipment.
With NetQ, a network administrator can monitor VXLANs in the data center. NetQ provides the ability to:
Manage virtual constructs: view the performance and status of VXLANs
Validate overlay communication paths
It helps answer questions such as:
Is my overlay configured and operating correctly?
Is my control plane configured correctly?
Can device A reach device B?
You can monitor your VXLANs using the following commands:
netq [<hostname>] show vxlan [vni <text-vni>] [around <text-time>] [json]
netq show interfaces type vxlan [state <remote-interface-state>] [around <text-time>] [json]
netq <hostname> show interfaces type vxlan [state <remote-interface-state>] [around <text-time>] [count] [json]
netq [<hostname>] show events [level info|level error|level warning|level critical|level debug] type vxlan [between <text-time> and <text-endtime>] [json]
When entering a time value, you must include a numeric value and the unit of measure:
w: weeks
d: days
h: hours
m: minutes
s: seconds
now
For the between option, you can enter the start (<text-time>) and end time (text-endtime>) values as most recent first and least recent second, or vice versa. The values do not have to have the same unit of measure.
View All VXLANs in Your Network
You can view a list of configured VXLANs for all devices, including the VNI (VXLAN network identifier), protocol, address of associated VTEPs (VXLAN tunnel endpoint), replication list, and the last time it changed. You can also view VXLAN information for a given device by adding a hostname to the show command. You can filter the results by VNI.
This example shows all configured VXLANs across the network. In this network, there are three VNIs (13, 24, and 104001) associated with three VLANs (13, 24, 4001), EVPN is the virtual protocol deployed, and the configuration was last changed around 23 hours ago.
cumulus@switch:~$ netq show vxlan
Matching vxlan records:
Hostname VNI Protoc VTEP IP VLAN Replication List Last Changed
ol
----------------- ---------- ------ ---------------- ------ ----------------------------------- -------------------------
exit01 104001 EVPN 10.0.0.41 4001 Fri Feb 8 01:35:49 2019
exit02 104001 EVPN 10.0.0.42 4001 Fri Feb 8 01:35:49 2019
leaf01 13 EVPN 10.0.0.112 13 10.0.0.134(leaf04, leaf03) Fri Feb 8 01:35:49 2019
leaf01 24 EVPN 10.0.0.112 24 10.0.0.134(leaf04, leaf03) Fri Feb 8 01:35:49 2019
leaf01 104001 EVPN 10.0.0.112 4001 Fri Feb 8 01:35:49 2019
leaf02 13 EVPN 10.0.0.112 13 10.0.0.134(leaf04, leaf03) Fri Feb 8 01:35:49 2019
leaf02 24 EVPN 10.0.0.112 24 10.0.0.134(leaf04, leaf03) Fri Feb 8 01:35:49 2019
leaf02 104001 EVPN 10.0.0.112 4001 Fri Feb 8 01:35:49 2019
leaf03 13 EVPN 10.0.0.134 13 10.0.0.112(leaf02, leaf01) Fri Feb 8 01:35:49 2019
leaf03 24 EVPN 10.0.0.134 24 10.0.0.112(leaf02, leaf01) Fri Feb 8 01:35:49 2019
leaf03 104001 EVPN 10.0.0.134 4001 Fri Feb 8 01:35:49 2019
leaf04 13 EVPN 10.0.0.134 13 10.0.0.112(leaf02, leaf01) Fri Feb 8 01:35:49 2019
leaf04 24 EVPN 10.0.0.134 24 10.0.0.112(leaf02, leaf01) Fri Feb 8 01:35:49 2019
leaf04 104001 EVPN 10.0.0.134 4001 Fri Feb 8 01:35:49 2019
This example shows the events and configuration changes that occurred on the VXLANs in your network in the last 24 hours. In this case, the change involved adding the EVPN configuration to each of the devices in the last 24 hours.
cumulus@switch:~$ netq show events type vxlan between now and 24h
Matching vxlan records:
Hostname VNI Protoc VTEP IP VLAN Replication List DB State Last Changed
ol
----------------- ---------- ------ ---------------- ------ ----------------------------------- ---------- -------------------------
exit02 104001 EVPN 10.0.0.42 4001 Add Fri Feb 8 01:35:49 2019
exit02 104001 EVPN 10.0.0.42 4001 Add Fri Feb 8 01:35:49 2019
exit02 104001 EVPN 10.0.0.42 4001 Add Fri Feb 8 01:35:49 2019
exit02 104001 EVPN 10.0.0.42 4001 Add Fri Feb 8 01:35:49 2019
exit02 104001 EVPN 10.0.0.42 4001 Add Fri Feb 8 01:35:49 2019
exit02 104001 EVPN 10.0.0.42 4001 Add Fri Feb 8 01:35:49 2019
exit02 104001 EVPN 10.0.0.42 4001 Add Fri Feb 8 01:35:49 2019
exit01 104001 EVPN 10.0.0.41 4001 Add Fri Feb 8 01:35:49 2019
exit01 104001 EVPN 10.0.0.41 4001 Add Fri Feb 8 01:35:49 2019
exit01 104001 EVPN 10.0.0.41 4001 Add Fri Feb 8 01:35:49 2019
exit01 104001 EVPN 10.0.0.41 4001 Add Fri Feb 8 01:35:49 2019
exit01 104001 EVPN 10.0.0.41 4001 Add Fri Feb 8 01:35:49 2019
exit01 104001 EVPN 10.0.0.41 4001 Add Fri Feb 8 01:35:49 2019
exit01 104001 EVPN 10.0.0.41 4001 Add Fri Feb 8 01:35:49 2019
exit01 104001 EVPN 10.0.0.41 4001 Add Fri Feb 8 01:35:49 2019
leaf04 104001 EVPN 10.0.0.134 4001 Add Fri Feb 8 01:35:49 2019
leaf04 104001 EVPN 10.0.0.134 4001 Add Fri Feb 8 01:35:49 2019
leaf04 104001 EVPN 10.0.0.134 4001 Add Fri Feb 8 01:35:49 2019
leaf04 104001 EVPN 10.0.0.134 4001 Add Fri Feb 8 01:35:49 2019
leaf04 104001 EVPN 10.0.0.134 4001 Add Fri Feb 8 01:35:49 2019
leaf04 104001 EVPN 10.0.0.134 4001 Add Fri Feb 8 01:35:49 2019
leaf04 104001 EVPN 10.0.0.134 4001 Add Fri Feb 8 01:35:49 2019
leaf04 13 EVPN 10.0.0.134 13 10.0.0.112() Add Fri Feb 8 01:35:49 2019
leaf04 13 EVPN 10.0.0.134 13 10.0.0.112() Add Fri Feb 8 01:35:49 2019
leaf04 13 EVPN 10.0.0.134 13 10.0.0.112() Add Fri Feb 8 01:35:49 2019
leaf04 13 EVPN 10.0.0.134 13 10.0.0.112() Add Fri Feb 8 01:35:49 2019
leaf04 13 EVPN 10.0.0.134 13 10.0.0.112() Add Fri Feb 8 01:35:49 2019
leaf04 13 EVPN 10.0.0.134 13 10.0.0.112() Add Fri Feb 8 01:35:49 2019
leaf04 13 EVPN 10.0.0.134 13 10.0.0.112() Add Fri Feb 8 01:35:49 2019
...
Therefore, if you looked for the VXLAN configuration and status for last week, you would find either another configuration or no configuration. This example shows that no VXLAN configuration was present.
cumulus@switch:~$ netq show vxlan around 7d
No matching vxlan records found
You can filter the list of VXLANs to view only those associated with a particular VNI. The VNI option lets you specify single VNI (100), a range of VNIs (10-100), or provide a comma-separated list (10,11,12). This example shows the configured VXLANs for VNI 24.
cumulus@switch:~$ netq show vxlan vni 24
Matching vxlan records:
Hostname VNI Protoc VTEP IP VLAN Replication List Last Changed
ol
----------------- ---------- ------ ---------------- ------ ----------------------------------- -------------------------
leaf01 24 EVPN 10.0.0.112 24 10.0.0.134(leaf04, leaf03) Fri Feb 8 01:35:49 2019
leaf02 24 EVPN 10.0.0.112 24 10.0.0.134(leaf04, leaf03) Fri Feb 8 01:35:49 2019
leaf03 24 EVPN 10.0.0.134 24 10.0.0.112(leaf02, leaf01) Fri Feb 8 01:35:49 2019
leaf04 24 EVPN 10.0.0.134 24 10.0.0.112(leaf02, leaf01) Fri Feb 8 01:35:49 2019
View the Interfaces Associated with VXLANs
You can view detailed information about the VXLAN interfaces using the netq show interface command. You can also view this information for a given device by adding a hostname to the show command. This example shows the detailed VXLAN interface information for the leaf02 switch.
cumulus@switch:~$ netq leaf02 show interfaces type vxlan
Matching link records:
Hostname Interface Type State VRF Details Last Changed
----------------- ------------------------- ---------------- ---------- --------------- ----------------------------------- -------------------------
leaf02 vni13 vxlan up default VNI: 13, PVID: 13, Master: bridge, Fri Feb 8 01:35:49 2019
VTEP: 10.0.0.112, MTU: 9000
leaf02 vni24 vxlan up default VNI: 24, PVID: 24, Master: bridge, Fri Feb 8 01:35:49 2019
VTEP: 10.0.0.112, MTU: 9000
leaf02 vxlan4001 vxlan up default VNI: 104001, PVID: 4001, Fri Feb 8 01:35:49 2019
Master: bridge, VTEP: 10.0.0.112,
MTU: 1500
Monitor Application Layer Protocols
The only application layer protocol monitored by NetQ is NTP, the Network Time Protocol.
It is important that the switches and hosts remain in time synchronization with the NetQ appliance or virtual machine to ensure collected data is properly captured and processed. You can use the netq show ntp command to view the time synchronization status for all devices or filter for devices that are either in synchronization or out of synchronization, currently or at a time in the past.
The syntax for the show commands is:
netq [<hostname>] show ntp [out-of-sync|in-sync] [around <text-time>] [json]
netq [<hostname>] show events [level info|level error|level warning|level critical|level debug] type ntp [between <text-time> and <text-endtime>] [json]
View Current Time Synchronization Status
You can view the current status of all devices regarding their time synchronization with a given NTP server, stratum, and application.
This example shows the time synchronization status for all devices in the NVIDIA reference architecture. You can see that all border, leaf, and spine switches rely on the out-of-band management server running ntpq to provide their time and that they are all in time synchronization. The out-of-band management server uses the titan.crash-ove server running ntpq to obtain and maintain time synchronization. And the NetQ server uses the eterna.binary.net server running chronyc to obtain and maintain time synchronization. The firewall switches are not time synchronized, which is appropriate. The Stratum value indicates the number of hierarchical levels the switch or host is from reference clock.
When a device is out of time synchronization with the NetQ server, the collected data might be improperly processed. For example, the wrong timestamp could be applied to a piece of data, or that data might be included in an aggregated metric when is should have been included in the next bucket of the aggregated metric. This could make the presented data slightly off or give an incorrect impression.
This example shows all devices in the network that are out of time synchronization, and therefore need further investigation.
cumulus@switch:~$ netq show ntp out-of-sync
Matching ntp records:
Hostname NTP Sync Current Server Stratum NTP App
----------------- -------- ----------------- ------- ---------------------
internet no - 16 ntpq
View Time Synchronization for a Given Device
You might have a concern only with the behavior of a particular device. Checking for time synchronization is a common troubleshooting step to take.
This example shows the time synchronization status for the leaf01 switch.
cumulus@switch:~$ netq leaf01 show ntp
Matching ntp records:
Hostname NTP Sync Current Server Stratum NTP App
----------------- -------- ----------------- ------- ---------------------
leaf01 yes kilimanjaro 2 ntpq
View NTP Status for a Time in the Past
If you find a device that is out of time synchronization, you can use the around option to get an idea when the synchronization broke.
This example shows the time synchronization status for all devices one week ago. Note that there are no errant devices in this example. You might try looking at the data for a few days ago. If there was an errant device a week ago, you might try looking farther back in time.
If a device has difficulty remaining in time synchronization, you might want to look to see if there are any related events.
This example shows there have been no events in the last 24 hours.
cumulus@switch:~$ netq show events type ntp
No matching event records found
This example shows there have been no critical NTP events in the last seven days.
cumulus@switch:~$ netq show events type ntp between now and 7d
No matching event records found
Validate Operations
When you discover operational anomalies, you can validate that the devices, hosts, network protocols and services are operating as expected. You can also compare the current operation with past operation. With NetQ, you can view the overall health of your network at a glance and then delve deeper for periodic checks or as conditions arise that require attention. When issues are present, NetQ makes it easy to identify and resolve them. You can also see when changes have occurred to the network, devices, and interfaces by viewing their operation, configuration, and status at an earlier point in time.
NetQ enables you to validate the:
Overall health of the network
Operation of the network protocols and services running in your network (either on demand or on a scheduled basis)
Configuration of physical layer protocols and services
Validation support is available in the NetQ UI and the NetQ CLI as shown here.
Item
NetQ UI
NetQ CLI
Agents
Yes
Yes
BGP
Yes
Yes
Cumulus Linux version
No
Yes
EVPN
Yes
Yes
Interfaces
Yes
Yes
MLAG (CLAG)
Yes
Yes
MTU
Yes
Yes
NTP
Yes
Yes
OSPF
Yes
Yes
Sensors
Yes
Yes
VLAN
Yes
Yes
VXLAN
Yes
Yes
Addresses
Yes
Yes
Validation with the NetQ UI
The NetQ UI uses the following cards to create validations and view results for these protocols and services:
Network Health
Validation Request
On-demand and Scheduled Validation Results
For a general understanding of how well your network is operating, the Network Health card workflow is the best place to start as it contains the highest-level view and performance roll-ups. Refer to the NetQ UI Card Reference for details about the components on these cards.
Validation with the NetQ CLI
The NetQ CLI uses the netq check commands to validate the various elements of your network fabric, looking for inconsistencies in configuration across your fabric, connectivity faults, missing configuration, and so forth, and then display the results for your assessment. You can run them from any node in the network.
The NetQ CLI has many other validation features and considerations.
Set a Time Period
You can run validations for a time in the past and output the results in JSON format if desired. The around option enables users to view the network state at an earlier time. The around option value requires an integer plus a unit of measure (UOM), with no space between them. The following are valid UOMs:
UOM
Command Value
Example
days
<#>d
3d
hours
<#>h
6h
minutes
<#>m
30m
seconds
<#>s
20s
If you want to go back in time by months or years, use the equivalent number of days.
Improve Output Readability
You can the readability of the validation outputs using color. Green output indicates successful results and red output indicates results with failures, warnings, and errors. Use the netq config add color command to enable the use of color.
View Default Validation Tests
To view the list of tests run for a given protocol or service by default, use either netq show unit-tests <protocol/service> or perform a tab completion on netq check <protocol/service> [include|exclude]. Refer to Validation Checks for a description of the individual tests.
Select the Tests to Run
You can include or exclude one or more of the various tests performed during the validation. Each test is assigned a number, which is used to identify which tests to run. Refer to Validation Checks for a description of the individual tests. By default, all tests are run. The <protocol-number-range-list> value is used with the include and exclude options to indicate which tests to include. It is a number list separated by commas, or a range using a dash, or a combination of these. Do not use spaces after commas. For example:
include 1,3,5
include 1-5
include 1,3-5
exclude 6,7
exclude 6-7
exclude 3,4-7,9
The output indicates whether a given test passed, failed, or was skipped.
Validation Check Result Filtering
You can create filters to suppress false alarms or uninteresting errors and warnings that can be a nuisance in CI workflows. For example, certain configurations permit a singly connected MLAG bond, which generates a standard error that is not useful.
Filtered errors and warnings related to validation checks do NOT generate notifications and do not get counted in the alarm and info event totals. They do get counted as part of suppressed notifications instead.
You define these filters in the /etc/netq/check-filter.yml file. You can create a rule for individual check commands or you can create a global rule that applies to all tests run by the check command. Additionally, you can create a rule specific to a particular test run by the check command.
Each rule must contain at least one match criteria and an action response. The only action currently available is filter. The match can comprise multiple criteria, one per line, creating a logical AND. You can match against any column in the validation check output. The match criteria values must match the case and spacing of the column names in the corresponding netq check output and are parsed as regular expressions.
This example shows a global rule for the BGP checks that suppresses any events generated by the DataVrf virtual route forwarding interface coming from swp3 or swp7.. It also shows a test-specific rule to filter all Address Families events from devices with hostnames starting with exit-1 or firewall.
You can configure filters to change validation errors to warnings that would normally occur due to the default expectations of the netq check commands. This applies to all protocols and services, except for Agents. For example, if you provision BGP with configurations where a BGP peer is not expected or desired, then errors that a BGP peer is missing occur. By creating a filter, you can remove the error in favor of a warning.
To create a validation filter:
Navigate to the /etc/netq directory.
Create or open the check_filter.yml file using your text editor of choice.
This file contains the syntax to follow to create one or more rules for one or more protocols or services. Create your own rules, and/or edit and un-comment any example rules you would like to use.
# Netq check result filter rule definition file. This is for filtering
# results based on regex match on one or more columns of each test result.
# Currently, only action 'filter' is supported. Each test can have one or
# more rules, and each rule can match on one or more columns. In addition,
# rules can also be optionally defined under the 'global' section and will
# apply to all tests of a check.
#
# syntax:
#
# <check name>:
# tests:
# <test name, as shown in test list when using the include/exclude and tab>:
# - rule:
# match:
# <column name>: regex
# <more columns and regex.., result is AND>
# action:
# filter
# - <more rules..>
# global:
# - rule:
# . . .
# - rule:
# . . .
#
# <another check name>:
# . . .
#
# e.g.
#
# bgp:
# tests:
# Address Families:
# - rule:
# match:
# Hostname: (^exit*|^firewall)
# VRF: DataVrf1080
# Reason: AFI/SAFI evpn not activated on peer
# action:
# filter
# - rule:
# match:
# Hostname: exit-2
# Reason: SAFI evpn not activated on peer
# action:
# filter
# Router ID:
# - rule:
# match:
# Hostname: exit-2
# action:
# filter
#
# evpn:
# tests:
# EVPN Type 2:
# - rule:
# match:
# Hostname: exit-1
# action:
# filter
#
Use Validation Commands in Scripts
If you are running scripts based on the older version of the netq check commands and want to stay with the old output, edit the netq.yml file to include old-check: true in the netq-cli section of the file. For example:
Then run netq config restart cli to apply the change.
If you update your scripts to work with the new version of the commands, just change the old-check value to false or remove it. Then restart the CLI.
Use netq check mlag in place of netq check clag from NetQ 2.4 onward. netq check clag remains available for automation scripts, but you should begin migrating to netq check mlag to maintain compatibility with future NetQ releases.
NetQ provides the information you need to validate the health of your network fabric, devices, and interfaces. Whether you use the NetQ UI or the NetQ CLI to create and run validations, the underlying checks are the same. The number of checks and the type of checks are tailored to the particular protocol or element being validated.
Use the value in the Test Number column in the tables below with the NetQ CLI when you want to include or exclude specific tests with the netq check command. You can get the test numbers when you run the netq show unit-tests command.
NetQ Agent Validation Tests
NetQ Agent validation looks for an agent status of Rotten for each node in the network. A Fresh status indicates the Agent is running as expected. The Agent sends a heartbeat every 30 seconds, and if it does not send three consecutive heartbeats, its status changes to Rotten. You can accomplish this with the following test:
Test Number
Test Name
Description
0
Agent Health
Checks for nodes that have failed or lost communication
BGP Validation Tests
The BGP validation tests look for indications of the session sanity (status and configuration). You can accomplish this with the following tests:
Test Number
Test Name
Description
0
Session Establishment
Checks that BGP sessions are in an established state
1
Address Families
Checks if transmit and receive address family advertisement is consistent between peers of a BGP session
2
Router ID
Checks for BGP router ID conflict in the network
3
Hold Time
Checks for mismatch of hold time between peers of a BGP session
4
Keep Alive Interval
Checks for mismatch of keep alive interval between peers of a BGP session
5
Ipv4 Stale Path Time
Checks for mismatch of IPv4 stale path timer between peers of a BGP session
6
IPv6 Stale Path Time
Checks for mismatch of IPv6 stale path timer between peers of a BGP session
7
Interface MTU
Checks for consistency of interface MTU for BGP peers
Cumulus Linux Version Tests
The Cumulus Linux version tests looks for version consistency. You can accomplish this with the following tests:
Test Number
Test Name
Description
0
Cumulus Linux Image Version
Checks the following:
No version specified, checks that all switches in the network have consistent version
match-version specified, checks that a switch’s OS version is equals the specified version
min-version specified, checks that a switch’s OS version is equal to or greater than the specified version
EVPN Validation Tests
The EVPN validation tests look for indications of the session sanity and configuration consistency. You can accomplish this with the following tests:
Test Number
Test Name
Description
0
EVPN BGP Session
Checks if:
BGP EVPN sessions are established
The EVPN address family advertisement is consistent
1
EVPN VNI Type Consistency
Because a VNI can be of type L2 or L3, checks that for a given VNI, its type is consistent across the network
2
EVPN Type 2
Checks for consistency of IP-MAC binding and the location of a given IP-MAC across all VTEPs
3
EVPN Type 3
Checks for consistency of replication group across all VTEPs
4
EVPN Session
For each EVPN session, checks if:
adv_all_vni is enabled
FDB learning is disabled on tunnel interface
5
VLAN Consistency
Checks for consistency of VLAN to VNI mapping across the network
6
VRF Consistency
Checks for consistency of VRF to L3 VNI mapping across the network
7
L3 VNI RMAC
Checks L3 VNI router MAC and SVI
Interface Validation Tests
The interface validation tests look for consistent configuration between two nodes. You can accomplish this with the following tests:
Test Number
Test Name
Description
0
Admin State
Checks for consistency of administrative state on two sides of a physical interface
1
Oper State
Checks for consistency of operational state on two sides of a physical interface
2
Speed
Checks for consistency of the speed setting on two sides of a physical interface
3
Autoneg
Checks for consistency of the auto-negotiation setting on two sides of a physical interface
Link MTU Validation Tests
The link MTU validation tests look for consistency across an interface and appropriate size MTU for VLAN and bridge interfaces. You can accomplish this with the following tests:
Test Number
Test Name
Description
0
Link MTU Consistency
Checks for consistency of MTU setting on two sides of a physical interface
1
VLAN interface
Checks if the MTU of an SVI is no smaller than the parent interface, subtracting the VLAN tag size
2
Bridge interface
Checks if the MTU on a bridge is not arbitrarily smaller than the smallest MTU among its members
MLAG Validation Tests
The MLAG validation tests look for misconfigurations, peering status, and bond error states. You can accomplish this with the following tests:
Test Number
Test Name
Description
0
Peering
Checks if:
MLAG peerlink is up
MLAG peerlink bond slaves are down (not in full capacity and redundancy)
Peering is established between two nodes in a MLAG pair
1
Backup IP
Checks if:
MLAG backup IP configuration is missing on a MLAG node
MLAG backup IP is correctly pointing to the MLAG peer and its connectivity is available
2
CLAG Sysmac
Checks if:
MLAG Sysmac is consistently configured on both nodes in a MLAG pair
Any duplication of a MLAG sysmac exists within a bridge domain
3
VXLAN Anycast IP
Checks if the VXLAN anycast IP address is consistently configured on both nodes in an MLAG pair
4
Bridge Membership
Checks if the MLAG peerlink is part of bridge
5
Spanning Tree
Checks if:
STP is enabled and running on the MLAG nodes
MLAG peerlink role is correct from STP perspective
The bridge ID is consistent between two nodes of a MLAG pair
The VNI in the bridge has BPDU guard and BPDU filter enabled
6
Dual Home
Checks for:
MLAG bonds that are not in dually connected state
Dually connected bonds have consistent VLAN and MTU configuration on both sides
STP has consistent view of bonds' dual connectedness
7
Single Home
Checks for:
Singly connected bonds
STP has consistent view of bond’s single connectedness
8
Conflicted Bonds
Checks for bonds in MLAG conflicted state and shows the reason
9
ProtoDown Bonds
Checks for bonds in protodown state and shows the reason
10
SVI
Checks if:
Both sides of a MLAG pair have an SVI configured
SVI on both sides have consistent MTU setting
NTP Validation Tests
The NTP validation test looks for poor operational status of the NTP service. You can accomplish this with the following test:
Test Number
Test Name
Description
0
NTP Sync
Checks if the NTP service is running and in sync state
OSPF Validation Tests
The OSPF validation tests look for indications of the service health and configuration consistency. You can accomplish this with the following tests:
Test Number
Test Name
Description
0
Router ID
Checks for OSPF router ID conflicts in the network
1
Adjacency
Checks or OSPF adjacencies in a down or unknown state
2
Timers
Checks for consistency of OSPF timer values in an OSPF adjacency
3
Network Type
Checks for consistency of network type configuration in an OSPF adjacency
4
Area ID
Checks for consistency of area ID configuration in an OSPF adjacency
5
Interface MTU
Checks for MTU consistency in an OSPF adjacency
6
Service Status
Checks for OSPF service health in an OSPF adjacency
Sensor Validation Tests
The sensor validation tests looks for chassis power supply, fan, and temperature sensors that are in a bad state. You can accomplish this with the following tests:
Test Number
Test Name
Description
0
PSU sensors
Checks for power supply unit sensors that are not in ok state
1
Fan sensors
Checks for fan sensors that are not in ok state
2
Temperature sensors
Checks for temperature sensors that are not in ok state
VLAN Validation Tests
The VLAN validation tests look for configuration consistency between two nodes. You can accomplish this with the following tests:
Test Number
Test Name
Description
0
Link Neighbor VLAN Consistency
Checks for consistency of VLAN configuration on two sides of a port or a bond
1
CLAG Bond VLAN Consistency
Checks for consistent VLAN membership of a CLAG (MLAG) bond on each side of the CLAG (MLAG) pair
VXLAN Validation Tests
The VXLAN validation tests look for configuration consistency across all VTEPs. You can accomplish this with the following tests:
Test Number
Test Name
Description
0
VLAN Consistency
Checks for consistent VLAN to VXLAN mapping across all VTEPs
1
BUM replication
Checks for consistent replication group membership across all VTEPs
Addresses Validation Tests
The duplicate address detection validation tests look for duplicate IPv4 and IPv6 addresses assigned to interfaces across devices in the inventory, and check for duplicate /32 host routes in each VRF. You can accomplish this with the following tests:
Test Number
Test Name
Description
0
IPv4 Duplicate Addresses
Checks for duplicate IPv4 addresses
1
IPv6 Duplicate Addresses
Checks for duplicate IPv6 addresses
The duplicate address detection validation is only supported using `netq check addresses` on the CLI.
Disabling Validation Checks in the NetQ UI
You can disable validation checks to suppress known events from affecting the reported network health. You can disable one or more validation checks from the validation dashboard:
Open the validation dashboard by selecting Validations and Show all scheduled validations:
Select the icon on the card for the desired validation and select disable. Validation checks can be enabled from the same menu:
Flow Analysis
NetQ provides the ability to analyze active traffic flows in your network. Use the Flow Analysis tool to sample data from TCP and UDP flows in your environment and review latency and buffer utilization statistics across network paths.
Flow Analysis is supported on NVIDIA Spectrum 2 and 3 platforms, and requires a switch fabric running Cumulus Linux version 5.0 or above.
Create New Flow Analysis
To start a new flow analysis, click the Flow Analysis menu and select Create New Flow Analysis:
Flow Analysis requires Lifecycle Management (LCM) to be enabled. The Flow Analysis menu on the workbench will not be visisble when LCM is disabled. LCM is enabled for on-premises deployments by default and disabled for cloud deployments by default. Contact your local NVIDIA sales representative or submit a support ticket to activate LCM on cloud deployments.
Flow Analysis Settings
The Flow Analysis wizard will prompt you to enter the source IP address, destination IP address, source port, VRF, destination port, and protocol of the flow you wish to analyze. The only optional parameter is the source port, for when the ephemeral source port of a flow may be unknown:
Flow Monitor Settings
The monitor settings will determine how long to sample a flow, when the sampling should be scheduled, whether the sampling should be bidirectional across the network path(s), and the sampling rate for the flow:
Flow Analysis is impactful to switch CPU during the flow monitor liftime. For high volume flows, it is recommended to set a lower sampling rate for flow analysis to limit switch CPU impact.
View Flow Analysis Data
After starting the flow analysis, a flow analysis card will appear on the NetQ Workbench.
Collected flow analysis data can also be viewed by selecting Flow Analysis and View Previous Flow Analysis
You can select View details next to the name of the flow analysis to bring up the analysis dashboard. You can use this dashboard to view latency and buffer statistics for the monitored flow. If bidirectional monitoring for the flow was enabled, you can view the reverse direction of the flow by using the icon. The following example shows flow data across a single path:
The dashboard header shows the monitored flow settings:
Flow Settings
Description
Lifetime
The lifetime of the flow analysis. This example completed in 11 minutes.
Source IP
The source IP address of the flow. In this example it is 10.1.100.125.
Destination IP
The destination IP address of the flow. In this example it is 10.1.10.105.
Source Port
The source port of the flow. In this example it displays N/A because it was not set.
Destination Port
The destination port of the flow. In this example it is 2222.
Protocol
The protocol of the monitored flow. In this example it is UDP.
Sampling Rate
The sampling rate of the flow. In this example it is low.
VRF
The VRF the flow is present in. In this example it is the default VRF.
Bi-directional Monitoring
This determines if the flow is monitored in both directions between the source IP address and the destination IP address. In this example it is enabled. Click to change the direction that is displayed.
Understanding the Flow Analysis Graph
The flow analysis graph is color coded relative to the values measured across devices. Lower values are displayed in green, and higher values are displayed in orange. The color gradient is displayed below the graph along with the low and high values from the collected flow data. Each hop in the path is represented in the graph with a vertical grey-striped line labeled by hostname. The following example shows a single path:
The Flow Graph panel on the right side of the dashboard will display the devices along the selected path:
View Flow Latency
The latency measured by Flow Analysis is the total transit time of sampled packets through individual devices. A summary of measured latency for each device is displayed above the main Flow Analysis graph:
The average latency for packets in the flow is displayed under the hostname of each device, along with the minimum and maximum latencies observed during the analysis lifetime. The 95th percentile (P95) latency value for sampled packets is also displayed. The P95 calculation represents the latency value that 95 percent of the sampled packets is lower than for the analysed flow.
You can also use your cursor to hover over sections of the main analysis graph to view average latency values for each device in a path:
The left panel of the Flow Analysis dashboard also displays a timeline of measured latency for each device on that path. You can use your cursor to hover over the plotted data points on the timeline for each device to view the latency measured at each time interval:
View Buffer Occupancy
The main Flow Analysis dashboard also displays the buffer occupancy of each device along the path. To change the graph view to display buffer occupancy for the flow, click next to Avg. flow latency and select Avg. buffer occupancy. You can hover over each section to see the average buffer utilization for each device:
View Multiple Paths
When packets matching the flow settings traverse multiple paths in the topology, the flow graph will display latency and buffer occupancy for each path:
You can switch between paths by clicking on an alternate path in the Flow Graph panel, or by clicking on an unselected path on the main analysis graph:
You can also select the desired path and view the amount of packets distributed over each path on the detail panel on the left side of the dashboard:
View Device Statistics
You can view interface statistics, resource utilization, and alarms for each device by clicking on a device in the Flow Graph panel, or by clicking on the striped grey line associated with a device in the main flow analysis graph. This will change the left panel details to show statistics for that device:
The Flow Graph panel also presents the option to bring up the topology view where you can also click the paths and devices to view statistics. Click to bring up the topology view:
Validate Overall Network Health
The Network Health card in the NetQ UI lets you view the overall health of your network at a glance, giving you a high-level understanding of how well your network is operating. Successful validation results determine overall network health shown in this card.
View Network Health Summary
You can view a very simple summary of your network health, including the percentage of successful validation results, a trend indicator, and a distribution of the validation results.
To view this summary:
Open or locate the Network Health card on your workbench.
Change to the small card using the card size picker.
In this example, the overall health is relatively good, but improving compared to recent status. Refer to the next section for viewing the key health metrics.
View Key Metrics of Network Health
Overall network health in the NetQ UI is a calculated average of several key health metrics: System, Network Services, and Interface health.
To view these key metrics:
Open or locate the Network Health card on your workbench.
Change to the medium card if needed.
Each metric is shown with percentage of successful validations, a trend indicator, and a distribution of the validation results.
In this example, the health of each of the system and network services are good, but interface health is on the lower side. While it is improving, you might choose to dig further if it does not continue to improve. Refer to the following section for additional details.
View Network Health
Network health is divided into three categories:
System health
Network service health
Interface health
System health is a calculated average of the NetQ Agent and sensor health metrics. In all cases, validation is performed on the agents. If you are monitoring platform sensors, the calculation includes these as well.
Network services health is a calculated average of the individual network protocol and services health metrics. In all cases, validation is performed on NTP. If you are running BGP, EVPN, MLAG, OSPF, or VXLAN protocols the calculation includes these as well. You can view the overall health of network services from the medium Network Health card and information about individual services from the Network Service Health tab on the large Network Health card.
Interface health is a calculated average of the interfaces, VLAN, and link MTU health metrics. You can view the overall health of interfaces from the medium Interface Health card and information about each component from the Interface Health tab on the large Interface Health card.
To view details about your network’s health:
Open or locate the Network Health card on your workbench.
Change to the large card using the card size picker.
By default, the System Health tab is displayed. If it is not, hover over the card and click .
The health of each system protocol or service is represented on the left side of the card by a distribution of the health score, a trend indicator, and a percentage of successful results. The right side of the card provides a listing of devices with failures related to agents and sensors.
Hover over the card and click .
The health of each network protocol or service is represented on the left side of the card by a distribution of the health score, a trend indicator, and a percentage of successful results. The right side of the card provides a listing of devices with failures related to these protocols and services.
Hover over the card and click .
The health of each interface protocol or service is represented on the left side of the card by a distribution of the health score, a trend indicator, and a percentage of successful results. The right side of the card provides a listing of devices with failures related to interfaces, VLANs, and link MTUs.
View Devices with the Most Issues
It is useful to know which devices are experiencing the most issues with their system services, network services, or interfaces in general, as this can help focus troubleshooting efforts toward selected devices versus the service itself.
To view devices with the most issues, select Most Failures from the filter above the table on the right.
Devices with the highest number of issues are listed at the top. Scroll down to view those with fewer issues. To further investigate the critical devices, open the Switch card or the Events|Alarms and Events|Info cards and filter on the indicated switches.
View Devices with Recent Issues
It is useful to know which devices are experiencing the most issues with their with their system services, network services, or interfaces right now, as this can help focus troubleshooting efforts toward devices current issues.
To view devices with recent issues, select Recent Failures from the filter above the table on the right. Devices with the highest number of issues are listed at the top. Scroll down to view those with fewer issues. To further investigate the critical devices, open the Switch card or the Event cards and filter on the indicated switches.
Filter Results by Service
You can focus the data in the table on the right, by unselecting one or more services. Click the checkbox next to the service you want to remove from the data. In this example, we have unchecked MTU.
This removes the checkbox next to the associated chart and grays out the title of the chart, temporarily removing the data related to that service from the table. Add it back by hovering over the chart and clicking the checkbox that appears.
View Details of a Particular Service
From the relevant tab (System Health, Network Service Health, or Interface Health) on the large Network Health card, you can click on a chart to take you to the full-screen card pre-focused on that service data.
This example shows the results of clicking on the Agent chart.
View All Network Protocol and Service Validation Results
The Network Health card workflow enables you to view all of the results
of all validations run on the network protocols and services during the
designated time period.
To view all the validation results:
Open or locate the Network Health card on your workbench.
Change to the large card using the card size picker.
Click <network protocol or service name> tab in the navigation panel.
Look for patterns in the data. For example, when did nodes, sessions, links, ports, or devices start failing validation? Was it at a specific time? Was it when you starting running the service on more nodes? Did sessions fail, but nodes were fine?
Where to go next depends on what data you see, but a few options include:
Look for matching event information for the failure points in a given protocol or service.
When you find failures in one protocol, compare with higher level protocols to see if they fail at a similar time (or vice versa with supporting services).
Export the data for use in another analytics tool, by clicking and providing a name for the data file.
Validate Network Protocol and Service Operations
NetQ lets you validate the operation of the network protocols and services running in your network either on demand or on a scheduled basis. NetQ provides three NetQ UI card workflows and several NetQ CLI validation commands to accomplish these checks on protocol and service operations:
Validate Network card
Create a new on-demand or scheduled validation request or run a scheduled validation on demand
View a preview of all scheduled validations
On-demand Validation Result card
View the number of devices and sessions tested and their status
View job configuration
Scheduled Validation Result card
View the number and status of runs, filter by failures, paths, and warnings
View job configuration
netq check command
Create and run an on-demand validation
View summary results, individual test status, and protocol or service specific info in the terminal window
When you want to validate the operation of one or more network protocols and services right now, you can create and run on-demand validations using the NetQ UI or the NetQ CLI.
Create an On-demand Validation
You can create on-demand validations that contain checks for protocols or services that you suspect might have issues.
Using the NetQ UI, you can create an on-demand validation for multiple protocols or services at the same time. This is handy when the protocols are strongly related regarding a possible issue or if you only want to create one validation request.
To create and run a request containing checks on one or more protocols or services within the NetQ UI:
Open the Validate Network card.
Click (Validation), then click Create a validation. Choose whether the on-demand validation should run on all devices or on specific device groups.
On the left side of the card, select the protocols or services you want to validate by clicking on their names, then click Next.
This example shows BGP.
Specify which workbench you want to run the check on. To run the check in the past, click Past and choose the time from when you want the check to start.
Click Run to start the check.
The associated On-demand Validation Result card opens on your workbench. If you selected more than one protocol or service, a card opens for each selection. Refer to View On-demand Validation Results.
To create and run a request containing checks on a single protocol or service all within the NetQ CLI, run the relevant netq check command:
All netq check commands have a summary and test results section. Some have additional summary information.
This example shows a validation of the EVPN protocol.
cumulus@switch:~$ netq check evpn
evpn check result summary:
Total nodes : 6
Checked nodes : 6
Failed nodes : 0
Rotten nodes : 0
Warning nodes : 0
Additional summary:
Total VNIs : 5
Failed BGP Sessions : 0
Total Sessions : 30
EVPN BGP Session Test : passed
EVPN VNI Type Consistency Test : passed
EVPN Type 2 Test : skipped
EVPN Type 3 Test : passed
EVPN Session Test : passed
Vlan Consistency Test : passed
Vrf Consistency Test : passed
L3 VNI RMAC Test : skipped
Validations that support the streaming keyword can query real time streaming information to return results faster compared to traditional on-demand checks. The following netq checks support a streaming query:
netq check agents
netq check bgp
netq check evpn
netq check interfaces
netq check mlag
netq check mtu
netq check ntp
netq check sensors
netq check vlan
netq check vxlan
To create a request containing checks on a single protocol or service in the NetQ CLI, run:
This example shows the creation of an on-demand BGP validation.
cumulus@switch:~$ netq add validation type bgp
Running job 7958faef-29e0-432f-8d1e-08a0bb270c91 type bgp
The associated Validation Result card is accessible from the full-screen Validate Network card. Refer to View On-demand Validation Results.
Create an On-demand Validation with Selected Tests
You can include or exclude one or more of the various checks performed during a validation. Refer to Validation Checks for a description of the tests for each protocol or service.
To create and run a request containing checks on one or more protocols or services within the NetQ UI:
Open the Validate Network card.
Click (Validation), then click Create a validation.
On the left side of the card, select the protocols or services you want to validate by clicking on their names. For each protocol or service, select or deselect the tests you want to include or exclude.
This example shows BGP.
After you’ve made your selection, click Next.
Specify which workbench you want to run the check on. To run the check in the past, click Past and choose the time from when you want the check to start.
Click Run to start the check.
The associated On-demand Validation Result card opens on your workbench. If you selected more than one protocol or service, a card opens for each selection. Refer to View On-demand Validation Results.
Using the include <bgp-number-range-list> and exclude <bgp-number-range-list> options of the netq check command, you can include or exclude one or more of the various checks performed during the validation.
First determine the number of the tests you want to include or exclude. Refer to Validation Checks for a description of these tests and to get the test numbers for the tests to include or exclude. You can also get the test numbers and descriptions when you run the netq show unit-tests command.
Then run the netq check command.
The following example shows a BGP validation that includes only the session establishment and router ID tests. Note that you can obtain the same results using either of the include or exclude options and that the test that is not run is marked as skipped.
cumulus@switch:~$ netq show unit-tests bgp
0 : Session Establishment - check if BGP session is in established state
1 : Address Families - check if tx and rx address family advertisement is consistent between peers of a BGP session
2 : Router ID - check for BGP router id conflict in the network
Configured global result filters:
Configured per test result filters:
cumulus@switch:~$ netq check bgp include 0,2
bgp check result summary:
Total nodes : 10
Checked nodes : 10
Failed nodes : 0
Rotten nodes : 0
Warning nodes : 0
Additional summary:
Total Sessions : 54
Failed Sessions : 0
Session Establishment Test : passed
Address Families Test : skipped
Router ID Test : passed
cumulus@switch:~$ netq check bgp exclude 1
bgp check result summary:
Total nodes : 10
Checked nodes : 10
Failed nodes : 0
Rotten nodes : 0
Warning nodes : 0
Additional summary:
Total Sessions : 54
Failed Sessions : 0
Session Establishment Test : passed
Address Families Test : skipped
Router ID Test : passed
Run an Existing Scheduled Validation On Demand
Sometimes you have a validation scheduled to run at a later time, but you need to run it now.
To run a scheduled validation now:
Open the Validate Network card.
Click (Validation), then click Run an existing validation.
Select one or more validations you want to run by clicking their names, then click View.
After you have started an on-demand validation, the results are displayed based on how you created the validation request.
The On-demand Validation Result card workflow enables you to view the results of on-demand validation requests. When a request has started processing, the associated large Validation Result card is displayed on your workbench with an indicator that it is running. When multiple network protocols or services are included in a validation, a validation result card is opened for each protocol and service. After an on-demand validation request has completed, the results are available in the same Validation Result cards.
It might take a few minutes for results to appear if the load on the NetQ system is heavy at the time of the run.
To view the results:
Locate the large On-demand Validation Result card on your workbench for the protocol or service check that was run.
You can identify it by the on-demand result icon, , protocol or service name, and the date and time that it was run.
You can have more than one card open for a given protocol or service, so be sure to use the date and time on the card to ensure you are viewing the correct card.
Note the total number and distribution of results for the tested devices and sessions (when appropriate). Are there many failures?
Hover over the charts to view the total number of warnings or failures and what percentage of the total results that represents for both devices and sessions.
To get more information about the errors reported, hover over the right side of the test and click More Details.
To view all data available for all on-demand validation results for a given protocol, click Show All Results to switch to the full screen card.
Comparing various results can give you a clue as to why certain devices are experiencing more warnings or failures. For example, more failures occurred between certain times or on a particular device.
The results of the netq check command are displayed in the terminal window where you ran the command. See On-demand CLI Validation Examples below.
The results of the netq add validation command are displayed in the terminal window where you ran the command. See On-demand CLI Validation Examples below.
On-Demand CLI Validation Examples
This section provides CLI validation examples for a variety of protocols and elements.
Validations that support the streaming keyword can query real time streaming information to return results faster compared to traditional on-demand checks. The following netq checks support a streaming query:
netq check agents
netq check bgp
netq check evpn
netq check interfaces
netq check mlag
netq check mtu
netq check ntp
netq check sensors
netq check vlan
netq check vxlan
The duplicate address detection validation tests look for duplicate IPv4 and IPv6 addresses assigned to interfaces across devices in the inventory, and check for duplicate /32 host routes in each VRF.
The default validation confirms that the NetQ Agent is running on all monitored nodes and provides a summary of the validation results. This example shows the results of a fully successful validation.
cumulus@switch:~$ netq check agents streaming
agent check result summary:
Checked nodes : 13
Total nodes : 13
Rotten nodes : 0
Failed nodes : 0
Warning nodes : 0
Agent Health Test : passed
The default validation runs a networkwide BGP connectivity and configuration check on all nodes running the BGP service:
cumulus@switch:~$ netq check bgp streaming
bgp check result summary:
Checked nodes : 8
Total nodes : 8
Rotten nodes : 0
Failed nodes : 0
Warning nodes : 0
Additional summary:
Total Sessions : 30
Failed Sessions : 0
Session Establishment Test : passed
Address Families Test : passed
Router ID Test : passed
This example indicates that all nodes running BGP and all BGP sessions are running properly. If there were issues with any of the nodes, NetQ would provide information about each node to aid in resolving the issues.
Perform a BGP Validation for a Particular VRF
Using the vrf <vrf> option of the netq check bgp command, you can validate the BGP service where communication is occurring through a particular virtual route. In this example, the name of the VRF of interest is vrf1.
cumulus@switch:~$ netq check bgp vrf vrf1
bgp check result summary:
Checked nodes : 2
Total nodes : 2
Rotten nodes : 0
Failed nodes : 0
Warning nodes : 0
Additional summary:
Total Sessions : 2
Failed Sessions : 0
Session Establishment Test : passed
Address Families Test : passed
Router ID Test : passed
Perform a BGP Validation with Selected Tests
Using the include <bgp-number-range-list> and exclude <bgp-number-range-list> options, you can include or exclude one or more of the various checks performed during the validation. You can select from the following BGP validation tests:
The default validation runs a networkwide EVPN connectivity and configuration check on all nodes running the EVPN service. This example shows results for a fully successful validation.
cumulus@switch:~$ netq check evpn streaming
evpn check result summary:
Checked nodes : 6
Total nodes : 6
Rotten nodes : 0
Failed nodes : 0
Warning nodes : 0
Additional summary:
Failed BGP Sessions : 0
Total Sessions : 16
Total VNIs : 3
EVPN BGP Session Test : passed,
EVPN VNI Type Consistency Test : passed,
EVPN Type 2 Test : passed,
EVPN Type 3 Test : passed,
EVPN Session Test : passed,
Vlan Consistency Test : passed,
Vrf Consistency Test : passed,
Perform an EVPN Validation for a Time in the Past
Using the around option, you can view the state of the EVPN service at a time in the past. Be sure to include the UOM.
cumulus@switch:~$ netq check evpn around 4d
evpn check result summary:
Checked nodes : 6
Total nodes : 6
Rotten nodes : 0
Failed nodes : 0
Warning nodes : 0
Additional summary:
Failed BGP Sessions : 0
Total Sessions : 16
Total VNIs : 3
EVPN BGP Session Test : passed,
EVPN VNI Type Consistency Test : passed,
EVPN Type 2 Test : passed,
EVPN Type 3 Test : passed,
EVPN Session Test : passed,
Vlan Consistency Test : passed,
Vrf Consistency Test : passed,
Perform an EVPN Validation with Selected Tests
Using the include <evpn-number-range-list> and exclude <evpn-number-range-list> options, you can include or exclude one or more of the various checks performed during the validation. You can select from the following EVPN validation tests:
cumulus@switch:~$ netq check evpn include 2
evpn check result summary:
Checked nodes : 6
Total nodes : 6
Rotten nodes : 0
Failed nodes : 0
Warning nodes : 0
Additional summary:
Failed BGP Sessions : 0
Total Sessions : 0
Total VNIs : 3
EVPN BGP Session Test : skipped
EVPN VNI Type Consistency Test : skipped
EVPN Type 2 Test : passed,
EVPN Type 3 Test : skipped
EVPN Session Test : skipped
Vlan Consistency Test : skipped
Vrf Consistency Test : skipped
To exclude the BGP session and VRF consistency tests:
cumulus@switch:~$ netq check evpn exclude 0,6
evpn check result summary:
Checked nodes : 6
Total nodes : 6
Rotten nodes : 0
Failed nodes : 0
Warning nodes : 0
Additional summary:
Failed BGP Sessions : 0
Total Sessions : 0
Total VNIs : 3
EVPN BGP Session Test : skipped
EVPN VNI Type Consistency Test : passed,
EVPN Type 2 Test : passed,
EVPN Type 3 Test : passed,
EVPN Session Test : passed,
Vlan Consistency Test : passed,
Vrf Consistency Test : skipped
To run only the first five tests:
cumulus@switch:~$ netq check evpn include 0-4
evpn check result summary:
Checked nodes : 6
Total nodes : 6
Rotten nodes : 0
Failed nodes : 0
Warning nodes : 0
Additional summary:
Failed BGP Sessions : 0
Total Sessions : 16
Total VNIs : 3
EVPN BGP Session Test : passed,
EVPN VNI Type Consistency Test : passed,
EVPN Type 2 Test : passed,
EVPN Type 3 Test : passed,
EVPN Session Test : passed,
Vlan Consistency Test : skipped
Vrf Consistency Test : skipped
The default validation runs a networkwide connectivity and configuration check on all interfaces. This example shows results for a fully successful validation.
cumulus@switch:~$ netq check interfaces streaming
interface check result summary:
Checked nodes : 12
Total nodes : 12
Rotten nodes : 0
Failed nodes : 0
Warning nodes : 0
Additional summary:
Unverified Ports : 56
Checked Ports : 108
Failed Ports : 0
Admin State Test : passed,
Oper State Test : passed,
Speed Test : passed,
Autoneg Test : passed,
Perform an Interfaces Validation for a Time in the Past
Using the around option, you can view the state of the interfaces at a time in the past. Be sure to include the UOM.
cumulus@switch:~$ netq check interfaces around 6h
interface check result summary:
Checked nodes : 12
Total nodes : 12
Rotten nodes : 0
Failed nodes : 0
Warning nodes : 0
Additional summary:
Unverified Ports : 56
Checked Ports : 108
Failed Ports : 0
Admin State Test : passed,
Oper State Test : passed,
Speed Test : passed,
Autoneg Test : passed,
Perform an Interfaces Validation with Selected Tests
Using the include <interface-number-range-list> and exclude <interface-number-range-list> options, you can include or exclude one or more of the various checks performed during the validation. You can select from the following interface validation tests:
The default validation runs a networkwide MLAG connectivity and configuration check on all nodes running the MLAG service. This example shows results for a fully successful validation.
cumulus@switch:~$ netq check mlag streaming
mlag check result summary:
Checked nodes : 4
Total nodes : 4
Rotten nodes : 0
Failed nodes : 0
Warning nodes : 0
Peering Test : passed,
Backup IP Test : passed,
Clag SysMac Test : passed,
VXLAN Anycast IP Test : passed,
Bridge Membership Test : passed,
Spanning Tree Test : passed,
Dual Home Test : passed,
Single Home Test : passed,
Conflicted Bonds Test : passed,
ProtoDown Bonds Test : passed,
SVI Test : passed,
You can also run this check using netq check clag and get the same results.
This example shows representative results for one or more failures, warnings, or errors. In particular, you can see that you have duplicate system MAC addresses.
cumulus@switch:~$ netq check mlag
mlag check result summary:
Checked nodes : 4
Total nodes : 4
Rotten nodes : 0
Failed nodes : 2
Warning nodes : 0
Peering Test : passed,
Backup IP Test : passed,
Clag SysMac Test : 0 warnings, 2 errors,
VXLAN Anycast IP Test : passed,
Bridge Membership Test : passed,
Spanning Tree Test : passed,
Dual Home Test : passed,
Single Home Test : passed,
Conflicted Bonds Test : passed,
ProtoDown Bonds Test : passed,
SVI Test : passed,
Clag SysMac Test details:
Hostname Reason
----------------- ---------------------------------------------
leaf01 Duplicate sysmac with leaf02/None
leaf03 Duplicate sysmac with leaf04/None
Perform an MLAG Validation with Selected Tests
Using the include <mlag-number-range-list> and exclude <mlag-number-range-list> options, you can include or exclude one or more of the various checks performed during the validation. You can select from the following MLAG validation tests:
To include only the CLAG SysMAC test during a validation:
cumulus@switch:~$ netq check mlag include 2
mlag check result summary:
Checked nodes : 4
Total nodes : 4
Rotten nodes : 0
Failed nodes : 2
Warning nodes : 0
Peering Test : skipped
Backup IP Test : skipped
Clag SysMac Test : 0 warnings, 2 errors,
VXLAN Anycast IP Test : skipped
Bridge Membership Test : skipped
Spanning Tree Test : skipped
Dual Home Test : skipped
Single Home Test : skipped
Conflicted Bonds Test : skipped
ProtoDown Bonds Test : skipped
SVI Test : skipped
Clag SysMac Test details:
Hostname Reason
----------------- ---------------------------------------------
leaf01 Duplicate sysmac with leaf02/None
leaf03 Duplicate sysmac with leaf04/None
To exclude the backup IP, CLAG SysMAC, and VXLAN anycast IP tests during a validation:
cumulus@switch:~$ netq check mlag exclude 1-3
mlag check result summary:
Checked nodes : 4
Total nodes : 4
Rotten nodes : 0
Failed nodes : 0
Warning nodes : 0
Peering Test : passed,
Backup IP Test : skipped
Clag SysMac Test : skipped
VXLAN Anycast IP Test : skipped
Bridge Membership Test : passed,
Spanning Tree Test : passed,
Dual Home Test : passed,
Single Home Test : passed,
Conflicted Bonds Test : passed,
ProtoDown Bonds Test : passed,
SVI Test : passed,
The default validation checks for synchronization of the NTP server with all nodes in the network. It is always important to have your devices in time synchronization to ensure that you can track configuration and management events and can make correlations between events.
The default validation runs a networkwide OSPF connectivity and configuration check on all nodes running the OSPF service. This example shows results several errors in the Timers and Interface MTU tests.
cumulus@switch:~# netq check ospf
Checked nodes: 8, Total nodes: 8, Rotten nodes: 0, Failed nodes: 4, Warning nodes: 0, Failed Adjacencies: 4, Total Adjacencies: 24
Router ID Test : passed
Adjacency Test : passed
Timers Test : 0 warnings, 4 errors
Network Type Test : passed
Area ID Test : passed
Interface Mtu Test : 0 warnings, 2 errors
Service Status Test : passed
Timers Test details:
Hostname Interface PeerID Peer IP Reason Last Changed
----------------- ------------------------- ------------------------- ------------------------- --------------------------------------------- -------------------------
spine-1 downlink-4 torc-22 uplink-1 dead time mismatch Mon Jul 1 16:18:33 2019
spine-1 downlink-4 torc-22 uplink-1 hello time mismatch Mon Jul 1 16:18:33 2019
torc-22 uplink-1 spine-1 downlink-4 dead time mismatch Mon Jul 1 16:19:21 2019
torc-22 uplink-1 spine-1 downlink-4 hello time mismatch Mon Jul 1 16:19:21 2019
Interface Mtu Test details:
Hostname Interface PeerID Peer IP Reason Last Changed
----------------- ------------------------- ------------------------- ------------------------- --------------------------------------------- -------------------------
spine-2 downlink-6 0.0.0.22 27.0.0.22 mtu mismatch Mon Jul 1 16:19:02 2019
tor-2 uplink-2 0.0.0.20 27.0.0.20 mtu mismatch Mon Jul 1 16:19:37 2019
Hardware platforms have a number sensors to provide environmental data about the switches. Knowing these are all within range is a good check point for maintenance.
For example, if you had a temporary HVAC failure and you have concerns that some of your nodes are beginning to overheat, you can run this validation to determine if any switches have already reached the maximum temperature threshold.
cumulus@switch:~$ netq check sensors
sensors check result summary:
Checked nodes : 8
Total nodes : 8
Rotten nodes : 0
Failed nodes : 0
Warning nodes : 0
Additional summary:
Checked Sensors : 136
Failed Sensors : 0
PSU sensors Test : passed,
Fan sensors Test : passed,
Temperature sensors Test : passed,
When you want to see validation results on a regular basis, it is useful to configure a scheduled validation request to avoid re-creating the request each time. You can create up to 15 scheduled validations for a given NetQ system.
By default, a scheduled validation for each protocol and service runs every hour. You do not need to create a scheduled validation for these unless you want it to run at a different interval. You cannot remove the default validations, but they do not count as part of the 15-validation limit.
Create a Scheduled Validation
You can create scheduled validations using the NetQ UI and the NetQ CLI.
You might want to create a scheduled validation that runs more often than the default validation if you are investigating an issue with a protocol or service. You might also want to create a scheduled validation that runs less often than the default validation if you prefer a longer term performance trend. Use the following instructions based on how you want to create the validation.
Sometimes it is useful to run validations on more than one protocol simultaneously. This gives a view into any potential relationship between the protocols or services status. For example, you might want to compare NTP with Agent validations if NetQ Agents are losing connectivity or the data appears to be collected at the wrong time. It would help determine if loss of time synchronization is causing the issue. You create simultaneous validations using the NetQ UI only.
Open the Validate Network card.
Click (Validation), then click Create a validation. Choose whether the scheduled validation should run on all devices or on specific device groups.
On the left side of the card, select the protocols or services you want to validate by clicking on their names, then click Next.
Select whether you want to run the check now or later, and on which workbench.
To run the check now, select how frequently it repeats and on which workbench to run the check.
To run the check later, click Later then choose when to start the check, how frequently to repeat the check (every 30 minutes, 1 hour, 3 hours, 6 hours, 12 hours, or 1 day), and on which workbench to run the check.
Click Schedule to schedule the check.
To see the card with the other network validations, click View. If you selected more than one protocol or service, a card opens for each selection.
To view the card on your workbench, click Open card. If you selected more than one protocol or service, a card opens for each selection.
To create a scheduled request containing checks on a single protocol or service in the NetQ CLI, run:
netq add validation name <text-new-validation-name> type (agents | bgp | evpn | interfaces | mlag | mtu | ntp | ospf | sensors | vlan | vxlan) interval <text-time-min>
This example shows the creation of a BGP validation run every 15 minutes for debugging.
cumulus@switch:~$ netq add validation name Bgp15m type bgp interval 15m
Successfully added Bgp15m running every 15m
The associated Validation Result card is accessible from the full-screen Scheduled Validation Result card. Refer to View Scheduled Validation Results.
After creating scheduled validations with either the NetQ UI or the NetQ CLI, the results appear in the Scheduled Validation Result card. When a request has completed processing, you can access the Validation Result card from the full-screen Validations card. Each protocol and service has its own validation result card, but the content is similar on each.
Granularity of Data Shown Based on Time Period
On the medium and large Validation Result cards, vertically stacked heat maps represent the status of the runs; one for passing runs, one for runs with warnings, and one for runs with failures. Depending on the time period of data on the card, the number of smaller time blocks indicate that the status varies. A vertical stack of time blocks, one from each map, includes the results from all checks during that time. The results appear by how saturated the color is for each block. If all validations during that time period pass, then the middle block is 100% saturated (white) and the warning and failure blocks are zero % saturated (gray). As warnings and errors increase in saturation, the passing block is proportionally reduced in saturation. The example heat map for a time period of 24 hours shown here uses the most common time periods from the table showing the resulting time blocks and regions.
Time Period
Number of Runs
Number Time Blocks
Amount of Time in Each Block
6 hours
18
6
1 hour
12 hours
36
12
1 hour
24 hours
72
24
1 hour
1 week
504
7
1 day
1 month
2,086
30
1 day
1 quarter
7,000
13
1 week
Access and Analyze the Scheduled Validation Results
Once a scheduled validation request has completed, the results are available in the corresponding Validation Result card.
To access the results:
Open the Validate Network card.
Click (Validation), then click Open an existing validation.
Select the validation results you want to view, then click View results.
The medium Scheduled Validation Result card(s) for the selected items open.
To analyze the results:
Note the distribution of results. Are there many failures? Are they concentrated together in time? Has the protocol or service recovered after the failures?
Hover over the heat maps to view the status numbers and what percentage of the total results that represents for a given region. The tooltip also shows the number of devices included in the validation and the number with warnings and/or failures. This is useful when you see the failures occurring on a small set of devices, as it might point to an issue with the devices rather than the network service.
Optionally, click Open <network service> Card link to open the medium individual Network Services card. Your current card does not close.
Switch to the large Scheduled Validation card using the card size picker.
Click to expand the chart.
Collapse the heat map by clicking .
If there are a large number of warnings or failures, view the devices with the most issues by clicking Most Active in the filter above the table. This might help narrow the failures down to a particular device or small set of devices that you can investigate further.
Select the Most Recent filter above the table to see the events that have occurred in the near past at the top of the list.
Optionally, view the health of the protocol or service as a whole by clicking Open <network service> Card (when available).
You can view the configuration of the request that produced the results shown on this card workflow, by hovering over the card and clicking . If you want to change the configuration, click Edit Config to open the large Validate Network card, pre-populated with the current configuration. Follow the instructions in Modify a Scheduled Validation to make your changes.
To view all data available for all scheduled validation results for the given protocol or service, click Show All Results or switch to the full screen card.
Look for changes and patterns in the results. Scroll to the right. Are there more failed sessions or nodes during one or more validations?
Double-click in a given result row to open details about the validation.
From this view you can:
See a summary of the validation results by clicking in the banner under the title. Toggle the arrow to close the summary.
See detailed results of each test run to validate the protocol or service. When errors or warnings are present, the nodes and relevant detail is provided.
Export the data by clicking Export.
Return to the validation jobs list by clicking .
Comparing various results can give you a clue as to why certain devices are experiencing more warnings or failures. For example, more failures occurred between certain times or on a particular device.
Manage Scheduled Validations
You can modify any scheduled validation that you created or remove it altogether at any time. Default validations cannot be removed or modified, but can be disabled.
Modify a Scheduled Validation
At some point you might want to change the schedule or validation types that are specified in a scheduled validation request. This creates a new validation request and the original validation has the (old) label applied to the name. The old validation can no longer be edited.
When you update a scheduled request, the results for all future runs of the validation will be different than the results of previous runs of the validation.
To modify a scheduled validation:
Open the Validate Network card.
Click (Validation), then click Show all scheduled validations.
Hover over the validation then click to edit it.
Select which checks to add or remove from the validation request.
Click Update.
Change the schedule for the validation, then click Update.
The validation can now be selected from the Validation list (on the small, medium or large size card) and run immediately using Open an existing validation, or you can wait for it to run the first time according to the schedule you specified. Refer to View Scheduled Validation Results.
Delete a Scheduled Validation
You can remove a user-defined scheduled validation at any time using the NetQ UI or the NetQ CLI. Default validations cannot be removed.
Open the Validate Network card.
Click (Validation), then click Show all scheduled validations.
Hover over the validation you want to remove.
Click , then click Yes to confirm.
Determine the name of the scheduled validation you want to remove. Run:
This example shows all scheduled validations for BGP.
cumulus@switch:~$ netq show validation summary type bgp
Name Type Job ID Checked Nodes Failed Nodes Total Nodes Timestamp
--------------- ---------------- ------------ -------------------------- ------------------------ ---------------------- -------------------------
Bgp30m scheduled 4c78cdf3-24a 0 0 0 Thu Nov 12 20:38:20 2020
6-4ecb-a39d-
0c2ec265505f
Bgp15m scheduled 2e891464-637 10 0 10 Thu Nov 12 20:28:58 2020
a-4e89-a692-
3bf5f7c8fd2a
Bgp30m scheduled 4c78cdf3-24a 0 0 0 Thu Nov 12 20:24:14 2020
6-4ecb-a39d-
0c2ec265505f
Bgp30m scheduled 4c78cdf3-24a 0 0 0 Thu Nov 12 20:15:20 2020
6-4ecb-a39d-
0c2ec265505f
Bgp15m scheduled 2e891464-637 10 0 10 Thu Nov 12 20:13:57 2020
a-4e89-a692-
3bf5f7c8fd2a
...
Remove the validation. Run:
netq del validation <text-validation-name>
This example removes the scheduled validation named Bgp15m.
cumulus@switch:~$ netq del validation Bgp15m
Successfully deleted validation Bgp15m
Repeat these steps for additional scheduled validations you want to remove.
Validate Device Groups
Both on-demand and scheduled validations can run on specific device groups. To create a validation for a device group rather than all devices:
Click (Validation), then click Create a validation. Choose Run on group of switches:
Select which group to run the validation on:
Select the protocols or services you want to validate by clicking on their names, then click Next.
Select which individual validations to run for each service. Individual checks can be disabled by clicking :
Choose whether to run an on-demand validation now, or to schedule it for another time and click Run:
Verify Network Connectivity
It is helpful to verify that communications are freely flowing between the various devices in your network. You can verify the connectivity between two devices in both an ad-hoc fashion and by defining connectivity checks to occur on a scheduled basis. NetQ provides three NetQ UI card workflows and several NetQ CLI trace commands to view connectivity:
Trace Request card
Run a scheduled trace on demand or create new on-demand or scheduled trace request
View a preview of all scheduled traces
On-demand Trace Results card
View source and destination devices, status, paths found, and number/distribution of MTU and hops
View job configuration
Scheduled Trace Results card
View source and destination devices, status, distribution of paths, bad nodes, MTU and hops
View job configuration
netq trace command
Create and run a trace on demand
View source and destination devices, status, paths found, MTU, and hops in terminal window
netq add trace command
Create an on-demand or scheduled trace
View results on On-demand and Scheduled Trace Results cards
Specifying Source and Destination Values
When specifying traces, the following options are available for the source and destination values.
Trace Type
Source
Destination
Layer 2
Hostname
MAC address plus VLAN
Layer 2
IPv4/IPv6 address plus VRF (if not default)
MAC address plus VLAN
Layer 2
MAC Address
MAC address plus VLAN
Layer 3
Hostname
IPv4/IPv6 address
Layer 3
IPv4/IPv6 address plus VRF (if not default)
IPv4/IPv6 address
If you use an IPv6 address, you must enter the complete, non-truncated address.
Additional NetQ CLI Considerations
When creating and running traces using the NetQ CLI, consider the following items.
Time Values
When entering a time value, you must include a numeric value and the unit of measure:
w: weeks
d: days
h: hours
m: minutes
s: seconds
now
Result Display Options
Three output formats are available for the on-demand trace with results in a terminal window.
JSON: Lists results in a JSON file, good for exporting to other applications or software.
Pretty: Lines up results by paths in a pseudo-graphical manner to help visualize the multiple paths.
Detail: Displays results in a tabular format with a row per hop and a set of rows per path, useful for traces with higher hop counts where the pretty output wraps lines, making it harder to interpret the results. This is the default output when not specified.
You can improve the readability of the output using color as well. Run netq config add color to turn color on. Run netq config del color to turn color off.
Known Addresses
The tracing function only knows about already learned addresses. If you find that a path is invalid or incomplete, you might need to ping the identified device so that its address becomes known.
Create On-demand Traces
You can view the current connectivity between two devices in your network by creating an on-demand trace. You can perform these traces at layer 2 or layer 3 using the NetQ UI or the NetQ CLI.
Create a Layer 3 On-demand Trace Request
It is helpful to verify the connectivity between two devices when you suspect an issue is preventing proper communication between them. If you cannot find a layer 3 path, you might also try checking connectivity through a layer 2 path.
Determine the IP addresses of the two devices you want to trace.
Click (main menu), then IP Addresses under the Network section.
Click and enter a hostname.
Make note of the relevant address.
Filter the list again for the other hostname, and make note of its address.
Open the Trace Request card.
On new workbench: Click in the Global Search field. Type trace. Click the card name.
On current workbench: Click . Click Trace. Click the card. Click Open Cards.
In the Source field, enter the hostname or IP address of the device where you want to start the trace.
In the Destination field, enter the IP address of the device where you want to end the trace.
In this example, we are starting our trace at *leaf01* which has an IPv4 address of 10.10.10.1 and ending it at border01 which has an IPv4 address of *10.10.10.63*. You could have used *leaf01* as the source instead of its IP address.
If you mistype an address, you must double-click it, or backspace over the error, and retype the address. You cannot select the address by dragging over it as this action attempts to move the card to another location.
Use the netq trace command to view the results in the terminal window. Use the netq add trace command to view the results in the NetQ UI.
To create a layer 3 on-demand trace and see the results in the terminal window, run:
netq trace <ip> from (<src-hostname>|<ip-src>) [json|detail|pretty]
Note the syntax requires the destination device address first and then the source device address or hostname.
This example shows a trace from 10.10.10.1 (source, leaf01) to 10.10.10.63 (destination, border01) on the underlay in pretty output. You could have used leaf01 as the source instead of its IP address. The example first identifies the addresses for the source and destination devices using netq show ip addresses then runs the trace.
cumulus@switch:~$ netq border01 show ip addresses
Matching address records:
Address Hostname Interface VRF Last Changed
------------------------- ----------------- ------------------------- --------------- -------------------------
192.168.200.63/24 border01 eth0 Tue Nov 3 15:45:31 2020
10.0.1.254/32 border01 lo default Mon Nov 2 22:28:54 2020
10.10.10.63/32 border01 lo default Mon Nov 2 22:28:54 2020
cumulus@switch:~$ netq trace 10.10.10.63 from 10.10.10.1 pretty
Number of Paths: 12
Number of Paths with Errors: 0
Number of Paths with Warnings: 0
Path MTU: 9216
leaf01 swp54 -- swp1 spine04 swp6 -- swp54 border02 peerlink.4094 -- peerlink.4094 border01 lo
peerlink.4094 -- peerlink.4094 border01 lo
leaf01 swp53 -- swp1 spine03 swp6 -- swp53 border02 peerlink.4094 -- peerlink.4094 border01 lo
peerlink.4094 -- peerlink.4094 border01 lo
leaf01 swp52 -- swp1 spine02 swp6 -- swp52 border02 peerlink.4094 -- peerlink.4094 border01 lo
peerlink.4094 -- peerlink.4094 border01 lo
leaf01 swp51 -- swp1 spine01 swp6 -- swp51 border02 peerlink.4094 -- peerlink.4094 border01 lo
peerlink.4094 -- peerlink.4094 border01 lo
leaf01 swp54 -- swp1 spine04 swp5 -- swp54 border01 lo
leaf01 swp53 -- swp1 spine03 swp5 -- swp53 border01 lo
leaf01 swp52 -- swp1 spine02 swp5 -- swp52 border01 lo
leaf01 swp51 -- swp1 spine01 swp5 -- swp51 border01 lo
Each row of the pretty output shows one of the 12 available paths, with each path described by hops using the following format:
source hostname and source egress port – ingress port of first hop and device hostname and egress port – n*(ingress port of next hop and device hostname and egress port) – ingress port of destination device hostname
In this example, eight of 12 paths use four hops to get to the destination and four use three hops. The overall MTU for all paths is 9216. No errors or warnings are present on any of the paths.
Alternately, you can choose to view the same results in detail (default output) or JSON format. This example shows the default detail output.
Create a Layer 3 On-demand Trace Through a Given VRF
You can guide a layer 3 trace through a particular VRF interface using the NetQ UI or the NetQ CLI.
To create the trace request:
Determine the IP addresses of the two devices you want to trace.
Click (main menu), then IP Addresses under the Network section.
Click and enter a hostname.
Make note of the relevant address and VRF.
Filter the list again for the other hostname, and make note of its address.
Open the Trace Request card.
On new workbench: Click the Global Search entry field. Type trace. Click the card name.
On current workbench: Click . Click Trace. Click the card. Click Open Cards.
In the Source field, enter the hostname or IP address of the device where you want to start the trace.
In the Destination field, enter the IP address of the device where you want to end the trace.
In the VRF field, enter the identifier for the VRF associated with these devices.
In this example, we are starting our trace at server01 using its IPv4 address 10.1.10.101 and ending it at server04 whose IPv4 address is 10.1.10.104. Because this trace is between two servers, a VRF is needed, in this case the RED VRF.
Use the netq trace command to view the results in the terminal window. Use the netq add trace command to view the results in the NetQ UI.
To create a layer 3 on-demand trace through a given VRF and see the results in the terminal window, run:
netq trace <ip> from (<src-hostname>|<ip-src>) vrf <vrf> [json|detail|pretty]
Note the syntax requires the destination device address first and then the source device address or hostname.
This example shows a trace from 10.1.10.101 (source, server01) to 10.1.10.104 (destination, server04) through VRF RED in detail output. It first identifies the addresses for the source and destination devices and a VRF between them using netq show ip addresses then runs the trace. Note that the VRF name is case sensitive. The trace job might take some time to compile all the available paths, especially if there are many of them.
It is helpful to verify the connectivity between two devices when you suspect an issue is preventing proper communication between them. If you cannot find a path through a layer 2 path, you might also try checking connectivity through a layer 3 path.
To create a layer 2 trace request:
Determine the IP or MAC address of the source device and the MAC address of the destination device.
Click (main menu), then IP Neighbors under the Network section.
Click and enter destination hostname.
Make note of the MAC address and VLAN ID.
Filter the list again for the source hostname, and make note of its IP address.
Open the Trace Request card.
On new workbench: Click in the Global Search field. Type trace. Click the card name.
On current workbench: Click . Click Trace. Click the card. Click Open Cards.
In the Source field, enter the hostname or IP address of the device where you want to start the trace.
In the Destination field, enter the MAC address for where you want to end the trace.
In the VLAN ID field, enter the identifier for the VLAN associated with the destination.
In this example, we are starting our trace at server01 with IPv4 address of 10.1.10.101 and ending it at 44:38:39:00:00:3e (server04) using VLAN 10 and VRF RED. Note: If you do not have VRFs beyond the default, you do not need to enter a VRF.
Use the netq trace command to view on-demand trace results in the terminal window.
To create a layer 2 on-demand trace and see the results in the terminal window, run:
netq trace (<mac> vlan <1-4096>) from <mac-src> [json|detail|pretty]
Note the syntax requires the destination device address first and then the source device address or hostname.
This example shows a trace from 44:38:39:00:00:32 (source, server01) to 44:38:39:00:00:3e (destination, server04) through VLAN 10 in detail output. It first identifies the MAC addresses for the two devices using netq show ip neighbors. Then it determines the VLAN using netq show macs. Then it runs the trace.
After you have started an on-demand trace, the results appear either in the NetQ UI On-demand Trace Result card or by running the netq show trace results command.
View Layer 3 On-demand Trace Results
View the results for a layer 3 trace based on how you created the request.
After you click Run Now, the corresponding results card opens on your workbench. While it is working on the trace, a notice appears on the card indicating it is running.
Once results are obtained, it displays them. Using our example from earlier, the following results are shown:
In this example, we see that the trace was successful. 12 paths were found between the devices, some with three hops and some four hops and with an overall MTU of 9216. Because there is a difference between the minimum and maximum number of hops (as seen in this example) or if the trace failed, you could view the large results card for additional information.
In our example, we can see that paths 9-12 had three hops by scrolling through the path listing in the table. To view the hop details, refer to the next section. If there were errors or warnings, that caused the trace failure, a count would be visible in this table. To view more details for this and other traces, refer to Detailed On-demand Trace Results.
The results of the netq trace command are displayed in the terminal window where you ran the command. Refer to Create On-demand Traces.
After you have run the netq add trace command, you are able to view the results in the NetQ UI.
Open the NetQ UI and log in.
Open the workbench where the associated On-demand Trace Result card has been placed.
View the results for a layer 2 trace based on how you created the request.
After clicking Run Now on the Trace Request card, the corresponding On-demand Trace Result card is opened on your workbench. While it is working on the trace, a notice is shown on the card indicating it is running.
Once the job is completed, the results are displayed.
In the example on the left, we see that the trace was successful. 16 paths were found between the devices, each with five hops and with an overall MTU of 9,000. In the example on the right, we see that the trace failed. Two of the available paths were unsuccessful and a single device might be the problem.
If there was a difference between the minimum and maximum number of hops or other failures, viewing the results on the large card might provide additional information.
In the example on top, we can verify that every path option had five hops since the distribution chart only shows one hop count and the table indicates each path had a value of five hops. Similarly, you can view the MTU data. In the example on the bottom, is an error (scroll to the right in the table to see the count). To view more details for this and other traces, refer to Detailed On-demand Trace Results.
The results of the netq trace command are displayed in the terminal window where you ran the command. Refer to Create On-demand Traces.
After you have run the netq add trace command, you are able to view the results in the NetQ UI.
Open the NetQ UI and log in.
Open the workbench where the associated On-demand Trace Result card has been placed.
You can dig deeper into the results of a trace in the NetQ UI, viewing the interfaces, ports, tunnels, VLANs, etc. for each available path.
To view the more detail:
Locate the On-demand Trace Results card for the trace of interest.
Change to the full-screen card using the card size picker.
Double-click on the trace of interest to open the detail view.
This view provides:
Configuration details for the trace: click the trace above the table
Errors and warnings for all paths: click Errors or Warnings above the table
If the trace was run on a Mellanox switch and drops were detected by the What Just Happened feature, they are also included here.
Path details: walk through the path, host by host, viewing the interfaces, ports, tunnels, VLANs, and so forth used to traverse the network from the source to the destination. Scroll down to view all paths.
If you have a large number of paths, click Load More at the bottom of the details page to view additional path data.
Note that in our example, paths 9-12 have only three hops because they do not traverse through the border02 switch, but go directly from spine04 to border01. Routing would likely choose these paths over the four-hop paths.
Create Scheduled Traces
There might be paths through your network that you consider critical or particularly important to your everyday operations. In these cases, it might be useful to create one or more traces to periodically confirm that at least one path is available between the relevant two devices. You can create scheduled traces at layer 2 or layer 3 in your network, from the NetQ UI and the NetQ CLI.
Create a Layer 3 Scheduled Trace
Use the instructions here, based on how you want to create the trace using the NetQ UI or NetQ CLI.
To schedule a trace:
Determine the IP addresses of the two devices to be traced.
Click (main menu), then IP Addresses under the Network section.
Click and enter a hostname.
Make note of the relevant address.
Filter the list again for the other hostname, and make note of its address.
Open the Trace Request card.
On new workbench: Click in the Global Search box. Type trace. Click on card name.
On current workbench: Click . Click Trace. Click on card. Click Open Cards.
In the Source field, enter the hostname or IP address of the device where you want to start the trace.
In the Destination field, enter IP address of the device where you want to end the trace.
Select a timeframe under Schedule to specify how often you want to run the trace.
Accept the default starting time, or click in the Starting field to specify the day you want the trace to run for the first time.
Click Next.
Click the time you want the trace to run for the first time.
Click OK.
Verify your entries are correct, then click Save As New.
This example shows the creation of a scheduled trace between leaf01 (source, 10.10.10.1) and border01 (destination, 10.10.10.63) at 5:00 am each day with the first run occurring on November 5, 2020.
Provide a name for the trace. Note: This name must be unique for a given user.
Click Save.
You can now run this trace on demand by selecting it from the dropdown list, or wait for it to run on its defined schedule. To view the scheduled trace results after its normal run, refer to View Scheduled Trace Results.
To create a layer 3 scheduled trace and see the results in the Scheduled Trace Results card, run:
netq add trace name <text-new-trace-name> <ip> from (<src-hostname>|<ip-src>) interval <text-time-min>
This example shows the creation of a scheduled trace between leaf01 (source, 10.10.10.1) and border01 (destination, 10.10.10.63) with a name of L01toB01Daily that runs on an daily basis. The interval option value is 1440 minutes, as denoted by the units indicator (m).
cumulus@switch:~$ netq add trace name Lf01toBor01Daily 10.10.10.63 from 10.10.10.1 interval 1440m
Successfully added/updated Lf01toBor01Daily running every 1440m
Create a Layer 3 Scheduled Trace through a Given VRF
Use the instructions here, based on how you want to create the trace using the NetQ UI or NetQ CLI.
To schedule a trace from the NetQ UI:
Determine the IP addresses of the two devices you want to trace.
Click (main menu), then IP Addresses under the Network section.
Click and enter a hostname.
Make note of the relevant address.
Filter the list again for the other hostname, and make note of its address.
Open the Trace Request card.
Click . Click Trace. Click the card. Click Open Cards.
In the Source field, enter the hostname or IP address of the device where you want to start the trace.
In the Destination field, enter IP address of the device where you want to end the trace.
Enter a VRF interface if you are using anything other than the default VRF.
Select a timeframe under Schedule to specify how often you want to run the trace.
Accept the default starting time, or click in the Starting field to specify the day you want the trace to run for the first time.
Click Next.
Click the time you want the trace to run for the first time.
Click OK.
This example shows the creation of a scheduled trace between server01 (source, 10.1.10.101) and server02 (destination, 10.1.10.104) that is run on an hourly basis as of November 5, 2020.
Verify your entries are correct, then click Save As New.
Provide a name for the trace. Note: This name must be unique for a given user.
Click Save.
You can now run this trace on demand by selecting it from the dropdown list, or wait for it to run on its defined schedule. To view the scheduled trace results after its normal run, refer to View Scheduled Trace Results.
To create a layer 3 scheduled trace that uses a VRF other than default and then see the results in the Scheduled Trace Results card, run:
netq add trace name <text-new-trace-name> <ip> from (<src-hostname>|<ip-src>) vrf <vrf> interval <text-time-min>
This example shows the creation of a scheduled trace between server01 (source, 10.1.10.101) and server04 (destination, 10.1.10.104) with a name of Svr01toSvr04Hrly that runs on an hourly basis. The interval option value is 60 minutes, as denoted by the units indicator (m).
cumulus@switch:~$ netq add trace name Svr01toSvr04Hrly 10.1.10.104 from 10.10.10.1 interval 60m
Successfully added/updated Svr01toSvr04Hrly running every 60m
Use the instructions here, based on how you want to create the trace using the NetQ UI or NetQ CLI.
To schedule a layer 2 trace:
Determine the IP or MAC address of the source device and the MAC address of the destination device.
Click (main menu), then IP Neighbors under the Network section.
Click and enter destination hostname.
Make note of the MAC address and VLAN ID.
Filter the list again for the source hostname, and make note of its IP or MAC address.
Open the Trace Request card.
On new workbench: Click in the Global Search field. Type trace. Click the card name.
On current workbench: Click . Click Trace. Click the card. Click Open Cards.
In the Source field, enter the hostname, IP or MAC address of the device where you want to start the trace.
In the Destination field, enter the MAC address of the device where you want to end the trace.
In the VLAN field, enter the VLAN ID associated with the destination device.
Select a timeframe under Schedule to specify how often you want to run the trace.
Accept the default starting time, or click in the Starting field to specify the day you want the trace to run for the first time.
Click Next.
Click the time you want the trace to run for the first time.
Click OK.
This example shows the creation of a scheduled trace between server01 (source, 44:38:39:00:00:32) and server04 (destination, 44:38:39:00:00:3e) on VLAN 10 that is run every three hours as of November 5, 2020 at 11 p.m.
Verify your entries are correct, then click Save As New.
Provide a name for the trace. Note: This name must be unique for a given user.
Click Save.
You can now run this trace on demand by selecting it from the dropdown list, or wait for it to run on its defined schedule. To view the scheduled trace results after its normal run, refer to View Scheduled Trace Results.
To create a layer 2 scheduled trace and then see the results in the Scheduled Trace Result card, run:
netq add trace name <text-new-trace-name> <mac> vlan <1-4096> from (<src-hostname> | <ip-src>) [vrf <vrf>] interval <text-time-min>
This example shows the creation of a scheduled trace between server01 (source, 10.1.10.101) and server04 (destination, 44:38:39:00:00:3e) on VLAN 10 with a name of Svr01toSvr04x3Hrs that runs every three hours. The interval option value is 180 minutes, as denoted by the units indicator (m).
cumulus@switch:~$ netq add trace name Svr01toSvr04x3Hrs 44:38:39:00:00:3e vlan 10 from 10.1.10.101 interval 180m
Successfully added/updated Svr01toSvr04x3Hrs running every 180m
You might find that, although you have a schedule for a particular trace, you want to have visibility into the connectivity data now. You can run a scheduled trace on demand from the small, medium and large Trace Request cards.
To run a scheduled trace now:
Open the small or medium or large Trace Request card.
Select the scheduled trace from the Select Trace or New Trace Request list. Note: In the medium and large cards, the trace details are filled in on selection of the scheduled trace.
Click Go or Run Now. A corresponding Trace Results card is opened on your workbench.
View Scheduled Trace Results
You can view the results of scheduled traces at any time. Results can be displayed in the NetQ UI or in the NetQ CLI.
The results of scheduled traces are displayed on the Scheduled Trace Result card.
Granularity of Data Shown Based on Time Period
On the medium and large Trace Result cards, the status of the runs is represented in heat maps stacked vertically; one for runs with warnings and one for runs with failures. Depending on the time period of data on the card, the number of smaller time blocks used to indicate the status varies. A vertical stack of time blocks, one from each map, includes the results from all checks during that time. The results are shown by how saturated the color is for each block. If all traces run during that time period pass, then both blocks are 100% gray. If there are only failures, the associated lower blocks are 100% saturated white and the warning blocks are 100% saturated gray. As warnings and failures increase, the blocks increase their white saturation. As warnings or failures decrease, the blocks increase their gray saturation. An example heat map for a time period of 24 hours is shown here with the most common time periods in the table showing the resulting time blocks.
Time Period
Number of Runs
Number Time Blocks
Amount of Time in Each Block
6 hours
18
6
1 hour
12 hours
36
12
1 hour
24 hours
72
24
1 hour
1 week
504
7
1 day
1 month
2,086
30
1 day
1 quarter
7,000
13
1 week
View Detailed Scheduled Trace Results
Once a scheduled trace request has completed, the results are available in the corresponding Trace Result card.
To view the results:
Open the Trace Request card.
Click . Click Trace. Click on card. Click Open Cards.
Change to the full-screen card using the card size picker to view all scheduled traces.
Select the scheduled trace results you want to view.
Click (Open Card). This opens the medium Scheduled Trace Results card(s) for the selected items.
Note the distribution of results. Are there many failures? Are they concentrated together in time? Has the trace begun passing again?
Hover over the heat maps to view the status numbers and what percentage of the total results that represents for a given region.
Switch to the large Scheduled Trace Result card.
If there are a large number of warnings or failures, view the associated messages by selecting Failures or Warning in the filter above the table. This might help narrow the failures down to a particular device or small set of devices that you can investigate further.
Look for a consistent number of paths, MTU, hops in the small charts under the heat map. Changes over time here might correlate with the messages and give you a clue to any specific issues. Note if the number of bad nodes changes over time. Devices that become unreachable are often the cause of trace failures.
View the available paths for each run, by selecting Paths in the filter above the table.
You can view the configuration of the request that produced the results shown on this card workflow, by hovering over the card and clicking . If you want to change the configuration, click Edit to open the large Trace Request card, pre-populated with the current configuration. Follow the instructions in Create a Scheduled Trace Request to make your changes in the same way you created a new scheduled trace.
To view a summary of all scheduled trace results, switch to the full screen card.
Look for changes and patterns in the results for additional clues to isolate root causes of trace failures. Select and view related traces using the Edit menu.
View the details of any specific trace result by clicking on the trace. A new window opens similar to the following:
Scroll to the right to view the information for a given hop. Scroll down to view additional paths. This display shows each of the hosts and detailed steps the trace takes to validate a given path between two devices. Using Path 1 as an example, each path can be interpreted as follows:
Hop 1 is from the source device, server02 in this case.
It exits this device at switch port bond0 with an MTU of 9000 and over the default VRF to get to leaf02.
The trace goes in to swp2 with an MTU of 9216 over the vrf1 interface.
It exits leaf02 through switch port 52 and so on.
Export this data by clicking Export or click to return to the results list to view another trace in detail.
View a Summary of All Scheduled Traces
You can view a summary of all scheduled traces using the netq show trace summary command. The summary displays the name of the trace, a job ID, status, and timestamps for when was run and when it completed.
This example shows all scheduled traces run in the last 24 hours.
cumulus@switch:~$ netq show trace summary
Name Job ID Status Status Details Start Time End Time
--------------- ------------ ---------------- ---------------------------- -------------------- ----------------
leaf01toborder0 f8d6a2c5-54d Complete 0 Fri Nov 6 15:04:54 Fri Nov 6 15:05
1 b-44a8-9a5d- 2020 :21 2020
9d31f4e4701d
New Trace 0e65e196-ac0 Complete 1 Fri Nov 6 15:04:48 Fri Nov 6 15:05
5-49d7-8c81- 2020 :03 2020
6e6691e191ae
Svr01toSvr04Hrl 4c580c97-8af Complete 0 Fri Nov 6 15:01:16 Fri Nov 6 15:01
y 8-4ea2-8c09- 2020 :44 2020
038cde9e196c
Abc c7174fad-71c Complete 1 Fri Nov 6 14:57:18 Fri Nov 6 14:58
a-49d3-8c1d- 2020 :11 2020
67962039ebf9
Lf01toBor01Dail f501f9b0-cca Complete 0 Fri Nov 6 14:52:35 Fri Nov 6 14:57
y 3-4fa1-a60d- 2020 :55 2020
fb6f495b7a0e
L01toB01Daily 38a75e0e-7f9 Complete 0 Fri Nov 6 14:50:23 Fri Nov 6 14:57
9-4e0c-8449- 2020 :38 2020
f63def1ab726
leaf01toborder0 f8d6a2c5-54d Complete 0 Fri Nov 6 14:34:54 Fri Nov 6 14:57
1 b-44a8-9a5d- 2020 :20 2020
9d31f4e4701d
leaf01toborder0 f8d6a2c5-54d Complete 0 Fri Nov 6 14:04:54 Fri Nov 6 14:05
1 b-44a8-9a5d- 2020 :20 2020
9d31f4e4701d
New Trace 0e65e196-ac0 Complete 1 Fri Nov 6 14:04:48 Fri Nov 6 14:05
5-49d7-8c81- 2020 :02 2020
6e6691e191ae
Svr01toSvr04Hrl 4c580c97-8af Complete 0 Fri Nov 6 14:01:16 Fri Nov 6 14:01
y 8-4ea2-8c09- 2020 :43 2020
038cde9e196c
...
L01toB01Daily 38a75e0e-7f9 Complete 0 Thu Nov 5 15:50:23 Thu Nov 5 15:58
9-4e0c-8449- 2020 :22 2020
f63def1ab726
leaf01toborder0 f8d6a2c5-54d Complete 0 Thu Nov 5 15:34:54 Thu Nov 5 15:58
1 b-44a8-9a5d- 2020 :03 2020
9d31f4e4701d
View Scheduled Trace Settings for a Given Trace
You can view the configuration settings used by a give scheduled trace using the netq show trace settings command.
This example shows the settings for the scheduled trace named Lf01toBor01Daily.
cumulus@switch:~$ netq show trace settings name Lf01toBor01Daily
View Scheduled Trace Results for a Given Trace
You can view the results for a give scheduled trace using the netq show trace results command.
This example obtains the job ID for the trace named Lf01toBor01Daily, then shows the results.
cumulus@switch:~$ netq show trace summary name Lf01toBor01Daily json
cumulus@switch:~$ netq show trace results f501f9b0-cca3-4fa1-a60d-fb6f495b7a0e
Manage Scheduled Traces
You can modify and remove scheduled traces at any time as described here. An administrator can also manage scheduled traces through the NetQ Management dashboard. Refer to Delete a Scheduled Trace for details.
Modify a Scheduled Trace
After reviewing the results of a scheduled trace for a period of time, you might want to modify how often you run it or use the VRF or VLAN. You can do this using the NetQ UI.
Be aware that changing the configuration of a trace can cause the results to be inconsistent with prior runs of the trace. If this is an unacceptable result, create a new scheduled trace. Optionally you can remove the original trace.
To modify a scheduled trace:
Open the Trace Request card.
Click . Click Trace. Click the card. Click Open Cards.
Select the trace from the New Trace Request dropdown.
Edit the schedule, VLAN or VRF as needed.
Click Update.
Click Yes to complete the changes, or change the name of the previous version of this scheduled trace.
Click the change name link.
Edit the name.
Click Update.
Click Yes to complete the changes, or repeat these steps until you have the name you want.
The validation can now be selected from the New Trace listing (on the small, medium or large size card) and run immediately using Go or Run Now, or you can wait for it to run the first time according to the schedule you specified. Refer to View Scheduled Trace Results.
Remove Scheduled Traces
If you have reached the maximum of 15 scheduled traces for your premises, you might need to remove one trace in favor of another. You can remove a scheduled trace at any time using the NetQ UI or NetQ CLI.
Both a standard user and an administrative user can remove scheduled traces. No notification is generated on removal. Be sure to communicate with other users before removing a scheduled trace to avoid confusion and support issues.
Open the Trace Request card.
Click . Click Trace. Click on card. Click Open Cards.
Change to the full-screen card using the card size picker.
Select one or more traces to remove.
Click .
Determine the name of the scheduled trace you want to remove. Run:
netq show trace summary [name <text-trace-name>] [around <text-time-hr>] [json]
This example shows all scheduled traces in JSON format. Alternately, drop the json option and obtain the name for the standard output.
cumulus@switch:~$ netq del trace leaf01toborder01
Successfully deleted schedule trace leaf01toborder01
Repeat these steps for additional traces you want to remove.
Monitor Using Topology View
The core capabilities of NetQ enable you to monitor your network by viewing performance and configuration data about your individual network devices and the entire fabric networkwide. The topics contained in this section describe monitoring tasks you can perform from a topology view rather than through the NetQ UI card workflows or the NetQ CLI.
Access the Topology View
To open the topology view, click in any workbench header.
This opens the full screen view of your network topology.
This document uses the Cumulus Networks reference topology for all examples.
To close the view, click in the top right corner.
Topology Overview
The topology view provides a visual representation of your Linux network, showing the connections and device information for all monitored nodes, for an alternate monitoring and troubleshooting perspective. The topology view uses a number of icons and elements to represent the nodes and their connections as follows:
Symbol
Usage
Switch running Cumulus Linux OS
Switch running RedHat, Ubuntu, or CentOS
Host with unknown operating system
Host running Ubuntu
Red
Alarm (critical) event is present on the node
Yellow
Info event is present
Lines
Physical links or connections
Interact with the Topology
There are a number of ways in which you can interact with the topology.
Move the Topology Focus
You can move the focus on the topology closer to view a smaller number of nodes, or further out to view a larger number of nodes. As with mapping applications, the node labels appear and disappear as you move in and out on the diagram for better readability. To zoom, you can use:
The zoom controls, , in the bottom right corner of the screen; the ‘+’ zooms you in closer, the ‘-’ moves you further out, and the ‘o’ resets to the default size.
A scrolling motion on your mouse.
Your trackpad.
You can also click anywhere on the topology, and drag it left, right, up, or down to view a different portion of the network diagram. This is especially helpful with larger topologies.
View Data About the Network
You can hover over the various elements to view data about them. Hovering over a node highlights its connections to other nodes, temporarily de-emphasizing all other connections.
Hovering over a line highlights the connection and displays the interface ports used on each end of the connection. All other connections are temporarily de-emphasized.
You can also click on the nodes and links to open the Configuration Panel with additional data about them.
From the Configuration Panel, you can view the following data about nodes and links:
Node Data
Description
ASIC
Name of the ASIC used in the switch. A value of Cumulus Networks VX indicates a virtual machine.
NetQ Agent Status
Operational status of the NetQ Agent on the switch; Fresh, Rotten.
NetQ Agent Version
Version ID of the NetQ Agent on the switch.
OS Name
Operating system running on the switch.
Platform
Vendor and name of the switch hardware.
Open Card/s
Opens the Event
Number of alarm events present on the switch.
Number of info events present on the switch.
Link Data
Description
Source
Switch where the connection originates
Source Interface
Port on the source switch used by the connection
Target
Switch where the connection ends
Target Interface
Port on the destination switch used by the connection
After reviewing the provided information, click to close the panel, or to view data for another node or link without closing the panel, simply click on that element. The panel is hidden by default.
When no devices or links are selected, you can view the unique count of items in the network by clicking on the on the upper left to open the count summary. Click to close the panel.
You can change the time period for the data as well. This enables you to view the state of the network in the past and compare it with the current state. Click in the timestamp box in the topology header to select an alternate time period.
Hide Events on Topology Diagram
You can hide the event symbols on the topology diagram. Simple move the Events toggle in the header to the left. Move the toggle to the right to show them again.
Export Your NetQ Topology Data
The topology view provides the option to export your topology information as a JSON file. Click Export in the header.
NetQ automatically generates the network topology and positions the nodes automatically. In large topologies, the position of the nodes might not be suitable for easy viewing. You can move the components of the topology around on screen to suit your needs. You can save the new layout so other users can see it.
Consider the following topology:
Click the Move icon.
In the example below, we switch the positions of the two border switches (border01 and border02):
Click the Save icon.
Troubleshoot Issues
When you discover that devices, hosts, protocols, and services are not operating correctly and validation shows errors, then troubleshooting the issues is the next step. The sections in this topic provide instructions for resolving common issues found when operating Cumulus Linux and NetQ in your network.
Investigate NetQ Issues
Monitoring of systems inevitably leads to the need to troubleshoot and resolve the issues found. In fact network management follows a common pattern as shown in this diagram.
This topic describes some of the tools and commands you can use to troubleshoot issues with the network and NetQ itself. Some example scenarios are included here:
Try looking at the specific protocol or service, or particular devices as well. If none of these produce a resolution, you can capture a log to use in discussion with the Cumulus Networks support team.
Browse Configuration and Log Files
To aid in troubleshooting issues with NetQ, there are the following configuration and log files that can provide insight into the root cause of the issue:
File
Description
/etc/netq/netq.yml
The NetQ configuration file. This file appears only if you installed either the netq-apps package or the NetQ Agent on the system.
/var/log/netqd.log
The NetQ daemon log file for the NetQ CLI. This log file appears only if you installed the netq-apps package on the system.
/var/log/netq-agent.log
The NetQ Agent log file. This log file appears only if you installed the NetQ Agent on the system.
Check NetQ Agent Health
Checking the health of the NetQ Agents is a good way to start troubleshooting NetQ on your network. If any agents are rotten, meaning three heartbeats in a row were not sent, then you can investigate the rotten node. Different views are offered with the NetQ UI and NetQ CLI.
Open the Validation Request card.
Select Default Validation AGENTS from the Validation dropdown.
Click Run Now.
The On-demand Validation Result card for NetQ Agents is placed on your workbench.
In the example below, no NetQ Agents are rotten. If there were nodes with indications of failures, warnings, rotten state, you could use the netq show agents command to view more detail about the individual NetQ Agents:
cumulus@switch:$ netq check agents
agent check result summary:
Total nodes : 21
Checked nodes : 21
Failed nodes : 0
Rotten nodes : 0
Warning nodes : 0
Agent Health Test : passed
cumulus@switch:~$ netq show agents
Matching agents records:
Hostname Status NTP Sync Version Sys Uptime Agent Uptime Reinitialize Time Last Changed
----------------- ---------------- -------- ------------------------------------ ------------------------- ------------------------- -------------------------- -------------------------
border01 Fresh yes 3.2.0-cl4u30~1601403318.104fb9ed Fri Oct 2 20:32:59 2020 Fri Oct 2 22:24:49 2020 Fri Oct 2 22:24:49 2020 Fri Nov 13 22:46:05 2020
border02 Fresh yes 3.2.0-cl4u30~1601403318.104fb9ed Fri Oct 2 20:32:57 2020 Fri Oct 2 22:24:48 2020 Fri Oct 2 22:24:48 2020 Fri Nov 13 22:46:14 2020
fw1 Fresh no 3.2.0-cl4u30~1601403318.104fb9ed Fri Oct 2 20:36:33 2020 Mon Nov 2 19:49:21 2020 Mon Nov 2 19:49:21 2020 Fri Nov 13 22:46:17 2020
fw2 Fresh no 3.2.0-cl4u30~1601403318.104fb9ed Fri Oct 2 20:36:32 2020 Mon Nov 2 19:49:20 2020 Mon Nov 2 19:49:20 2020 Fri Nov 13 22:46:20 2020
leaf01 Fresh yes 3.2.0-cl4u30~1601403318.104fb9ed Fri Oct 2 20:32:56 2020 Fri Oct 2 22:24:45 2020 Fri Oct 2 22:24:45 2020 Fri Nov 13 22:46:01 2020
leaf02 Fresh yes 3.2.0-cl4u30~1601403318.104fb9ed Fri Oct 2 20:32:54 2020 Fri Oct 2 22:24:44 2020 Fri Oct 2 22:24:44 2020 Fri Nov 13 22:46:02 2020
leaf03 Fresh yes 3.2.0-cl4u30~1601403318.104fb9ed Fri Oct 2 20:32:59 2020 Fri Oct 2 22:24:49 2020 Fri Oct 2 22:24:49 2020 Fri Nov 13 22:46:14 2020
leaf04 Fresh yes 3.2.0-cl4u30~1601403318.104fb9ed Fri Oct 2 20:32:57 2020 Fri Oct 2 22:24:47 2020 Fri Oct 2 22:24:47 2020 Fri Nov 13 22:46:06 2020
oob-mgmt-server Fresh yes 3.2.0-ub18.04u30~1601400975.104fb9e Fri Oct 2 19:54:09 2020 Fri Oct 2 22:26:32 2020 Fri Oct 2 22:26:32 2020 Fri Nov 13 22:45:59 2020
server01 Fresh yes 3.2.0-ub18.04u30~1601400975.104fb9e Fri Oct 2 22:39:27 2020 Mon Nov 2 19:49:31 2020 Mon Nov 2 19:49:31 2020 Fri Nov 13 22:46:08 2020
server02 Fresh yes 3.2.0-ub18.04u30~1601400975.104fb9e Fri Oct 2 22:39:26 2020 Mon Nov 2 19:49:32 2020 Mon Nov 2 19:49:32 2020 Fri Nov 13 22:46:12 2020
server03 Fresh yes 3.2.0-ub18.04u30~1601400975.104fb9e Fri Oct 2 22:39:27 2020 Mon Nov 2 19:49:32 2020 Mon Nov 2 19:49:32 2020 Fri Nov 13 22:46:11 2020
server04 Fresh yes 3.2.0-ub18.04u30~1601400975.104fb9e Fri Oct 2 22:39:27 2020 Mon Nov 2 19:49:32 2020 Mon Nov 2 19:49:32 2020 Fri Nov 13 22:46:10 2020
server05 Fresh yes 3.2.0-ub18.04u30~1601400975.104fb9e Fri Oct 2 22:39:26 2020 Mon Nov 2 19:49:33 2020 Mon Nov 2 19:49:33 2020 Fri Nov 13 22:46:14 2020
server06 Fresh yes 3.2.0-ub18.04u30~1601400975.104fb9e Fri Oct 2 22:39:26 2020 Mon Nov 2 19:49:34 2020 Mon Nov 2 19:49:34 2020 Fri Nov 13 22:46:14 2020
server07 Fresh yes 3.2.0-ub18.04u30~1601400975.104fb9e Fri Oct 2 20:47:24 2020 Mon Nov 2 19:49:35 2020 Mon Nov 2 19:49:35 2020 Fri Nov 13 22:45:54 2020
server08 Fresh yes 3.2.0-ub18.04u30~1601400975.104fb9e Fri Oct 2 20:47:24 2020 Mon Nov 2 19:49:35 2020 Mon Nov 2 19:49:35 2020 Fri Nov 13 22:45:57 2020
spine01 Fresh yes 3.2.0-cl4u30~1601403318.104fb9ed Fri Oct 2 20:32:29 2020 Fri Oct 2 22:24:20 2020 Fri Oct 2 22:24:20 2020 Fri Nov 13 22:45:55 2020
spine02 Fresh yes 3.2.0-cl4u30~1601403318.104fb9ed Fri Oct 2 20:32:48 2020 Fri Oct 2 22:24:37 2020 Fri Oct 2 22:24:37 2020 Fri Nov 13 22:46:21 2020
spine03 Fresh yes 3.2.0-cl4u30~1601403318.104fb9ed Fri Oct 2 20:32:51 2020 Fri Oct 2 22:24:41 2020 Fri Oct 2 22:24:41 2020 Fri Nov 13 22:46:14 2020
spine04 Fresh yes 3.2.0-cl4u30~1601403318.104fb9ed Fri Oct 2 20:32:49 2020 Fri Oct 2 22:24:40 2020 Fri Oct 2 22:24:40 2020 Fri Nov 13 22:45:53 2020
NetQ provides users with the ability to go back in time to replay the network state, see fabric-wide event change logs and root cause state deviations. The NetQ Telemetry Server maintains data collected by NetQ agents in a time-series database, making fabric-wide events available for analysis. This enables you to replay and analyze networkwide events for better visibility and to correlate patterns. This allows for root-cause analysis and optimization of network configs for the future.
NetQ provides many commands and cards for diagnosing past events.
NetQ records network events and stores them in its database. You can:
View the events through a third-party notification application (syslog, PagerDuty, Slack, or email)
View the events using the Events|Alarms and Events|Info cards in the NetQ UI, then use the Trace Request card to track the connection between nodes
Use netq show events command to look for any changes made to the runtime configuration that could have triggered the alert, then use netq trace to track the connection between the nodes
The netq trace command traces the route of an IP or MAC address from one endpoint to another. It works across bridged, routed and VXLAN connections, computing the path using available data instead of sending real traffic — this way, you can run it from anywhere. It performs MTU and VLAN consistency checks for every link along the path.
With the NetQ UI or NetQ CLI, you can travel back to a specific point in time or a range of times to help you isolate errors and issues.
All cards have a default time period for the data shown on the card, typically the last 24 hours. You can change the time period to view the data during a different time range to aid analysis of previous or existing issues.
To change the time period for a card:
Hover over any card.
Click in the header.
Select a time period from the dropdown list.
If you think you had an issue with your sensors last night, you can check the sensors on all your nodes around the time you think the issue occurred:
cumulus@switch:~$ netq check sensors around 12h
sensors check result summary:
Total nodes : 13
Checked nodes : 13
Failed nodes : 0
Rotten nodes : 0
Warning nodes : 0
Additional summary:
Checked Sensors : 102
Failed Sensors : 0
PSU sensors Test : passed
Fan sensors Test : passed
Temperature sensors Test : passed
You can travel back in time five minutes and run a trace from spine02 to
exit01, which has the IP address 27.0.0.1:
cumulus@leaf01:~$ netq trace 27.0.0.1 from spine02 around 5m pretty
Detected Routing Loop. Node exit01 (now via Local Node exit01 and Ports swp6 <==> Remote Node/s spine01 and Ports swp3) visited twice.
Detected Routing Loop. Node spine02 (now via mac:00:02:00:00:00:15) visited twice.
spine02 -- spine02:swp3 -- exit01:swp6.4 -- exit01:swp3 -- exit01
-- spine02:swp7 -- spine02
Trace Paths in a VRF
Use the NetQ UI Trace Request card or the netq trace command to run a trace through a specified VRF as well:
cumulus@leaf01:~$ netq trace 10.1.20.252 from spine01 vrf default around 5m pretty
spine01 -- spine01:swp1 -- leaf01:vlan20
-- spine01:swp2 -- leaf02:vlan20
The opta-support command generates an archive of useful information for troubleshooting issues with NetQ. It is an extension of the cl-support command in Cumulus Linux. It provides information about the NetQ Platform configuration and runtime statistics as well as output from the docker ps command. The NVIDIA support team might request the output of this command when assisting with any issues that you could not solve with your own troubleshooting.
cumulus@server:~$ sudo opta-support
Please send /var/support/opta_support_server_2021119_165552.txz to Nvidia support.
To export network validation check data in addition to OPTA health data to the support bundle, the NetQ CLI must be activated with AuthKeys. If the CLI access key is not activated, the command output displays a notification and data collection excludes netq show output:
cumulus@server:~$ sudo opta-support
Access key is not found. Please check the access key entered or generate a fresh access_key,secret_key pair and add it to the CLI configuration
Proceeding with opta-support generation without netq show outputs
Please send /var/support/opta_support_server_20211122_22259.txz to Nvidia support.
Resolve MLAG Issues
This topic outlines a few scenarios that illustrate how you use NetQ to troubleshoot
Multi-Chassis Link Aggregation - MLAG on Cumulus Linux switches. Each starts with a log message that indicates the current MLAG state.
NetQ can monitor many aspects of an MLAG configuration, including:
Verifying the current state of all nodes
Verifying the dual connectivity state
Checking that the peer link is part of the bridge
Verifying whether MLAG bonds are not bridge members
Verifying whether the VXLAN interface is not a bridge member
Checking for remote-side service failures caused by systemctl
Checking for VLAN-VNI mapping mismatches
Checking for layer 3 MTU mismatches on peerlink subinterfaces
Checking for VXLAN active-active address inconsistencies
Verifying that STP priorities are the same across both peers
Scenario 1: All Nodes Are Up
When the MLAG configuration is running smoothly, NetQ sends out a message that all nodes are up:
2017-05-22T23:13:09.683429+00:00 noc-pr netq-notifier[5501]: INFO: CLAG: All nodes are up
Running netq show mlag confirms this:
cumulus@switch:~$ netq show mlag
Matching clag records:
Hostname Peer SysMac State Backup #Bond #Dual Last Changed
s
----------------- ----------------- ------------------ ---------- ------ ----- ----- -------------------------
spine01(P) spine02 00:01:01:10:00:01 up up 24 24 Thu Feb 7 18:30:49 2019
spine02 spine01(P) 00:01:01:10:00:01 up up 24 24 Thu Feb 7 18:30:53 2019
leaf01(P) leaf02 44:38:39:ff:ff:01 up up 12 12 Thu Feb 7 18:31:15 2019
leaf02 leaf01(P) 44:38:39:ff:ff:01 up up 12 12 Thu Feb 7 18:31:20 2019
leaf03(P) leaf04 44:38:39:ff:ff:02 up up 12 12 Thu Feb 7 18:31:26 2019
leaf04 leaf03(P) 44:38:39:ff:ff:02 up up 12 12 Thu Feb 7 18:31:30 2019
You can also verify a specific node is up:
cumulus@switch:~$ netq spine01 show mlag
Matching mlag records:
Hostname Peer SysMac State Backup #Bond #Dual Last Changed
s
----------------- ----------------- ------------------ ---------- ------ ----- ----- -------------------------
spine01(P) spine02 00:01:01:10:00:01 up up 24 24 Thu Feb 7 18:30:49 2019
Similarly, checking the MLAG state with NetQ also confirms this:
cumulus@switch:~$ netq check mlag
clag check result summary:
Total nodes : 6
Checked nodes : 6
Failed nodes : 0
Rotten nodes : 0
Warning nodes : 0
Peering Test : passed
Backup IP Test : passed
Clag SysMac Test : passed
VXLAN Anycast IP Test : passed
Bridge Membership Test : passed
Spanning Tree Test : passed
Dual Home Test : passed
Single Home Test : passed
Conflicted Bonds Test : passed
ProtoDown Bonds Test : passed
SVI Test : passed
NVIDIA deprecated the clag keyword, replacing it with the mlag keyword. The clag keyword continues to work for now, but you should start using the mlag keyword instead. Keep in mind you should also update any scripts that use the clag keyword.
When you log directly into a switch, you can run clagctl to get the state:
After you fix the issue, you can show the MLAG state to see if all the nodes are up. The notifications from NetQ indicate all nodes are UP, and the netq check flag also indicates there are no failures.
cumulus@switch:~$ netq show mlag
Matching clag records:
Hostname Peer SysMac State Backup #Bond #Dual Last Changed
s
----------------- ----------------- ------------------ ---------- ------ ----- ----- -------------------------
spine01(P) spine02 00:01:01:10:00:01 up up 24 24 Thu Feb 7 18:30:49 2019
spine02 spine01(P) 00:01:01:10:00:01 up up 24 24 Thu Feb 7 18:30:53 2019
leaf01(P) leaf02 44:38:39:ff:ff:01 up up 12 12 Thu Feb 7 18:31:15 2019
leaf02 leaf01(P) 44:38:39:ff:ff:01 up up 12 12 Thu Feb 7 18:31:20 2019
leaf03(P) leaf04 44:38:39:ff:ff:02 up up 12 12 Thu Feb 7 18:31:26 2019
leaf04 leaf03(P) 44:38:39:ff:ff:02 up up 12 12 Thu Feb 7 18:31:30 2019
When you log directly into a switch, you can run clagctl to get the state:
After you fix the issue, you can show the MLAG state to see if all the
nodes are up:
cumulus@switch:~$ netq show mlag
Matching clag session records are:
Hostname Peer SysMac State Backup #Bond #Dual Last Changed
s
----------------- ----------------- ------------------ ---------- ------ ----- ----- -------------------------
spine01(P) spine02 00:01:01:10:00:01 up up 24 24 Thu Feb 7 18:30:49 2019
spine02 spine01(P) 00:01:01:10:00:01 up up 24 24 Thu Feb 7 18:30:53 2019
leaf01(P) leaf02 44:38:39:ff:ff:01 up up 12 12 Thu Feb 7 18:31:15 2019
leaf02 leaf01(P) 44:38:39:ff:ff:01 up up 12 12 Thu Feb 7 18:31:20 2019
leaf03(P) leaf04 44:38:39:ff:ff:02 up up 12 12 Thu Feb 7 18:31:26 2019
leaf04 leaf03(P) 44:38:39:ff:ff:02 up up 12 12 Thu Feb 7 18:31:30 2019
When you log directly into a switch, you can run clagctl to get the state:
Showing the MLAG state reveals which nodes are down:
cumulus@switch:~$ netq show mlag
Matching CLAG session records are:
Node Peer SysMac State Backup #Bonds #Dual Last Changed
---------------- ---------------- ----------------- ----- ------ ------ ----- -------------------------
spine01(P) spine02 00:01:01:10:00:01 up up 9 9 Thu Feb 7 18:30:53 2019
spine02 spine01(P) 00:01:01:10:00:01 up up 9 9 Thu Feb 7 18:31:04 2019
leaf01 44:38:39:ff:ff:01 down n/a 0 0 Thu Feb 7 18:31:13 2019
leaf03(P) leaf04 44:38:39:ff:ff:02 up up 8 8 Thu Feb 7 18:31:19 2019
leaf04 leaf03(P) 44:38:39:ff:ff:02 up up 8 8 Thu Feb 7 18:31:25 2019
Checking the MLAG status provides the reason for the failure:
The following documents summarize new features in the release, bug fixes, document formatting conventions, and general terminology. You can also find a PDF of the NetQ user documentation here.
NetQ CLI Reference
This reference provides details about each of the NetQ CLI commands, starting with the 2.4.0 release. For an overview of the CLI structure and usage, read NetQ Command Line Overview.
The commands appear alphabetically by command name.
Because all commands begin with netq, the next required keyword determines the order
Punctuation and numbers appear before letters
When options are available, you should use them in the order listed.
NetQ UI Card Reference
This reference describes the cards available with the NetQ 4.1 graphical user interface (NetQ UI), including each item and field on the four sizes of cards. You can open cards using one of two methods:
Search for the card by name in the Global Search field in the application header
Click . Select a card category or scroll down. Click the desired card. Click Open Cards.
Cards opened on the default NetQ Workbench are not saved. Create a new workbench and open cards there to save and view the cards at a later time.
Cards are listed in alphabetical order by name.
Event Cards
The event cards appear on the default NetQ Workbench. You can also add them to user-created workbenches.
Events|Alarms Card
You can easily monitor critical events occurring across your network using the Alarms card. You can determine the number of events for the various system, interface, and network protocols and services components in the network.
The small Alarms card displays:
Item
Description
Indicates data is for all critical severity events in the network.
Alarm trend
Trend of alarm count, represented by an arrow:
Pointing upward and bright pink: alarm count is higher than the last two time periods, an increasing trend
Pointing downward and green: alarm count is lower than the last two time periods, a decreasing trend
No arrow: alarm count did not change over the last two time periods, trend is steady
Alarm score
Current count of alarms during the designated time period.
Alarm rating
Count of alarms relative to the average count of alarms during the designated time period:
Low: Count of alarms is below the average count; a nominal count
Med: Count of alarms is in range of the average count; some room for improvement
High: Count of alarms is above the average count; user intervention recommended
Chart
Distribution alarms received during the designated time period and a total count of all alarms present in the system.
The medium Alarms card displays:
Item
Description
Time period
Range of time in which the displayed data was collected; applies to all card sizes.
Indicates data is for all critical events in the network.
Count
Total number of alarms received during the designated time period.
Alarm score
Current count of alarms received from each category (overall, system, interface, and network services) during the designated time period.
Chart
Distribution of all alarms received from each category during the designated time period.
The large Alarms card has one tab.
The Alarm Summary tab displays:
Item
Description
Time period
Range of time in which the displayed data was collected; applies to all card sizes.
Indicates data is for all system, trace and interface critical events in the network.
Alarm Distribution
Chart: Distribution of all alarms received from each category during the designated time period:
NetQ Agent
BTRFS Information
CL Support
Config Diff
Installed Packages
Link
LLDP
MTU
Node
Port
Resource
Running Config Diff
Sensor
Services
SSD Utilization
TCA Interface Stats
TCA Resource Utilization
TCA Sensors
The categories sort in descending order based on total count of alarms, with the largest number of alarms appearing at the top, followed by the next most, down to the chart with the fewest alarms.
Count: Total number of alarms received from each category during the designated time period.
Table
Listing of items that match the filter selection for the selected alarm categories:
Events by Most Recent: Most recent event appear at the top
Devices by Event Count: Devices with the most events appear at the top
Show All Events
Opens full screen Events | Alarms card with a listing of all events.
The full screen Alarms card provides tabs for all events.
Item
Description
Title
Events | Alarms
Closes full screen card and returns to workbench.
Default Time
Range of time in which the displayed data was collected.
Displays data refresh status. Click to pause data refresh. Click to resume data refresh. Current refresh rate is visible by hovering over icon.
Results
Number of results found for the selected tab.
All Alarms
Displays all alarms received in the time period. By default, the requests list sorts by the date and time that the event occurred (Time). This tab provides the following additional data about each request:
Source: Hostname of the given event
Message: Text describing the alarm or info event that occurred
Type: Name of network protocol and/or service that triggered the given event
Severity: Importance of the event-critical, warning, info, or debug
Table Actions
Select, export, or filter the list. Refer to Table Settings.
Events|Info Card
You can easily monitor warning, info, and debug severity events occurring across your network using the Info card. You can determine the number of events for the various system, interface, and network protocols and services components in the network.
The small Info card displays:
Item
Description
Indicates data is for all warning, info, and debug severity events in the network
Info count
Number of info events received during the designated time period
Alarm count
Number of alarm events received during the designated time period
Chart
Distribution of all info events and alarms received during the designated time period
The medium Info card displays:
Item
Description
Time period
Range of time in which the displayed data was collected; applies to all card sizes.
Indicates data is for all warning, info, and debug severity events in the network.
Types of Info
Chart which displays the services that have triggered events during the designated time period. Hover over chart to view a count for each type.
Distribution of Info
Info Status
Count: Number of info events received during the designated time period.
Chart: Distribution of all info events received during the designated time period.
Alarms Status
Count: Number of alarm events received during the designated time period.
Chart: Distribution of all alarm events received during the designated time period.
The large Info card displays:
Item
Description
Time period
Range of time in which the displayed data was collected; applies to all card sizes.
Indicates data is for all warning, info, and debug severity events in the network.
Types of Info
Chart which displays the services that have triggered events during the designated time period. Hover over chart to view a count for each type.
Distribution of Info
Info Status
Count: Current number of info events received during the designated time period.
Chart: Distribution of all info events received during the designated time period.
Alarms Status
Count: Current number of alarm events received during the designated time period.
Chart: Distribution of all alarm events received during the designated time period.
Table
Listing of items that match the filter selection:
Events by Most Recent: Most recent event are listed at the top.
Devices by Event Count: Devices with the most events are listed at the top.
Show All Events
Opens full screen Events | Info card with a listing of all events.
The full screen Info card provides tabs for all events.
Item
Description
Title
Events | Info
Closes full screen card and returns to workbench.
Default Time
Range of time in which the displayed data was collected.
Displays data refresh status. Click to pause data refresh. Click to resume data refresh. Current refresh rate is visible by hovering over icon.
Results
Number of results found for the selected tab.
All Events
Displays all events (both alarms and info) received in the time period. By default, the requests list is sorted by the date and time that the event occurred (Time). This tab provides the following additional data about each request:
Source: Hostname of the given event
Message: Text describing the alarm or info event that occurred
Type: Name of network protocol and/or service that triggered the given event
Severity: Importance of the event-critical, warning, info, or debug
Table Actions
Select, export, or filter the list. Refer to Table Settings.
Inventory Cards
The inventory cards are located on the default NetQ Workbench. They can also be added to user-created workbenches.
Inventory|Devices Card
The small Devices Inventory card displays:
Item
Description
Indicates data is for device inventory
Total number of switches in inventory during the designated time period
Total number of hosts in inventory during the designated time period
The medium Devices Inventory card displays:
Item
Description
Indicates data is for device inventory
Title
Inventory | Devices
Total number of switches in inventory during the designated time period
Total number of hosts in inventory during the designated time period
Charts
Distribution of operating systems deployed on switches and hosts, respectively
The large Devices Inventory card has one tab.
The Switches tab displays:
Item
Description
Time period
Always Now for inventory by default.
Indicates data is for device inventory.
Title
Inventory | Devices.
Total number of switches in inventory during the designated time period.
Link to full screen listing of all switches.
Component
Switch components monitored-ASIC, Operating System (OS), NetQ Agent version, and Platform.
Distribution charts
Distribution of switch components across the network.
Unique
Number of unique items of each component type. For example, for OS, you might have Cumulus Linux 3.7.15, 4.3 and SONiC 202012, giving you a unique count of 3.
The full screen Devices Inventory card provides tabs for all switches and all hosts.
Item
Description
Title
Inventory | Devices | Switches.
Closes full screen card and returns to workbench.
Time period
Time period does not apply to the Inventory cards. This is always Default Time.
Displays data refresh status. Click to pause data refresh. Click to resume data refresh. Current refresh rate is visible by hovering over icon.
Results
Number of results found for the selected tab.
All Switches and All Hosts tabs
Displays all monitored switches and hosts in your network. By default, the device list is sorted by hostname. These tabs provide the following additional data about each device:
Agent
State: Indicates communication state of the NetQ Agent on a given device. Values include Fresh (heard from recently) and Rotten (not heard from recently).
Version: Software version number of the NetQ Agent on a given device. This should match the version number of the NetQ software loaded on your server or appliance; for example, 2.1.0.
ASIC
Core BW: Maximum sustained/rated bandwidth. Example values include 2.0 T and 720 G.
Model: Chip family. Example values include Tomahawk, Trident, and Spectrum.
Model Id: Identifier of networking ASIC model. Example values include BCM56960 and BCM56854.
Ports: Indicates port configuration of the switch. Example values include 32 x 100G-QSFP28, 48 x 10G-SFP+, and 6 x 40G-QSFP+.
Vendor: Manufacturer of the chip. Example values include Broadcom and Mellanox.
CPU
Arch: Microprocessor architecture type. Values include x86_64 (Intel), ARMv7 (AMD), and PowerPC.
Max Freq: Highest rated frequency for CPU. Example values include 2.40 GHz and 1.74 GHz.
Model: Chip family. Example values include Intel Atom C2538 and Intel Atom C2338.
Nos: Number of cores. Example values include 2, 4, and 8.
Disk Total Size: Total amount of storage space in physical disks (not total available). Example values: 10 GB, 20 GB, 30 GB.
Memory Size: Total amount of local RAM. Example values include 8192 MB and 2048 MB.
OS
Vendor: Operating System manufacturer. Values include Cumulus Networks, RedHat, Ubuntu, and CentOS.
Version: Software version number of the OS. Example values include 3.7.3, 2.5.x, 16.04, 7.1.
Version Id: Identifier of the OS version. For Cumulus, this is the same as the Version (3.7.x).
Platform
Date: Date and time the platform was manufactured. Example values include 7/12/18 and 10/29/2015.
MAC: System MAC address. Example value: 17:01:AB:EE:C3:F5.
Model: Manufacturer's model name. Examples values include AS7712-32X and S4048-ON.
Number: Manufacturer part number. Examples values include FP3ZZ7632014A, 0J09D3.
Revision: Release version of the platform.
Series: Manufacturer serial number. Example values include D2060B2F044919GD000060, CN046MRJCES0085E0004.
Vendor: Manufacturer of the platform. Example values include Cumulus Express, Dell, EdgeCore, Lenovo, Mellanox.
Time: Date and time the data was collected from device.
Table Actions
Select, export, or filter the list. Refer to Table Settings.
Inventory|Switch Card
Knowing what components are included on all of your switches aids in upgrade, compliance, and other planning tasks. Viewing this data is accomplished through the Switch Inventory card.
The small Switch Inventory card displays:
Item
Description
Indicates data is for switch inventory
Count
Total number of switches in the network inventory
Chart
Distribution of overall health status during the designated time period; fresh versus rotten
The medium Switch Inventory card displays:
Item
Description
Indicates data is for switch inventory.
Filter
View fresh switches (those you have heard from recently) or rotten switches (those you have not heard from recently) on this card.
Chart
Distribution of switch components (disk size, OS, ASIC, NetQ Agents, CPU, platform, and memory size) during the designated time period. Hover over chart segment to view versions of each component.
Note: You should only have one version of NetQ Agent running and it should match the NetQ Platform release number. If you have more than one, you likely need to upgrade the older agents.
Unique
Number of unique versions of the various switch components. For example, for OS, you might have CL 3.7.1 and CL 3.7.4 making the unique value two.
The large Switch Inventory card contains four tabs.
The Summary tab displays:
Item
Description
Indicates data is for switch inventory.
Filter
View fresh switches (those you have heard from recently) or rotten switches (those you have not heard from recently) on this card.
Charts
Distribution of switch components (disk size, OS, ASIC, NetQ Agents, CPU, platform, and memory size), divided into software and hardware, during the designated time period. Hover over chart segment to view versions of each component.
Note: You should only have one version of NetQ Agent running and it should match the NetQ Platform release number. If you have more than one, you likely need to upgrade the older agents.
Unique
Number of unique versions of the various switch components. For example, for OS, you might have CL 3.7.6 and CL 3.7.4 making the unique value two.
The ASIC tab displays:
Item
Description
Indicates data is for ASIC information.
Filter
View fresh switches (those you have heard from recently) or rotten switches (those you have not heard from recently) on this card.
Vendor chart
Distribution of ASIC vendors. Hover over chart segment to view the number of switches with each version.
Model chart
Distribution of ASIC models. Hover over chart segment to view the number of switches with each version.
Show All
Opens full screen card displaying all components for all switches.
The Platform tab displays:
Item
Description
Indicates data is for platform information.
Filter
View fresh switches (those you have heard from recently) or rotten switches (those you have not heard from recently) on this card.
Vendor chart
Distribution of platform vendors. Hover over chart segment to view the number of switches with each vendor.
Platform chart
Distribution of platform models. Hover over chart segment to view the number of switches with each model.
Show All
Opens full screen card displaying all components for all switches.
The Software tab displays:
Item
Description
Indicates data is for software information.
Filter
View fresh switches (those you have heard from recently) or rotten switches (those you have not heard from recently) on this card.
Operating System chart
Distribution of OS versions. Hover over chart segment to view the number of switches with each version.
Agent Version chart
Distribution of NetQ Agent versions. Hover over chart segment to view the number of switches with each version.
Note: You should only have one version of NetQ Agent running and it should match the NetQ Platform release number. If you have more than one, you likely need to upgrade the older agents.
Show All
Opens full screen card displaying all components for all switches.
The full screen Switch Inventory card provides tabs for all components, ASIC, platform, CPU, memory, disk, and OS components.
Network Health Card
As with any network, one of the challenges is keeping track of all of the moving parts. With the NetQ GUI, you can view the overall health of your network at a glance and then delve deeper for periodic checks or as conditions arise that require attention. For a general understanding of how well your network is operating, the Network Health card workflow is the best place to start as it contains the highest view and performance roll-ups.
The Network Health card is located on the default NetQ Workbench. It can also be added to user-created workbenches.
The small Network Health card displays:
Item
Description
Indicates data is for overall Network Health
Health trend
Trend of overall network health, represented by an arrow:
Pointing upward and green: Health score in the most recent window is higher than in the last two data collection windows, an increasing trend
Pointing downward and bright pink: Health score in the most recent window is lower than in the last two data collection windows, a decreasing trend
No arrow: Health score is unchanged over the last two data collection windows, trend is steady
The data collection window varies based on the time period of the card. For a 24 hour time period (default), the window is one hour. This gives you current, hourly, updates about your network health.
Health score
Average of health scores for system health, network services health, and interface health during the last data collection window. The health score for each category is calculated as the percentage of items which passed validations versus the number of items checked.
The collection window varies based on the time period of the card. For a 24 hour time period (default), the window is one hour. This gives you current, hourly, updates about your network health.
Health rating
Performance rating based on the health score during the time window:
Low: Health score is less than 40%
Med: Health score is between 40% and 70%
High: Health score is greater than 70%
Chart
Distribution of overall health status during the designated time period
The medium Network Health card displays the distribution, score, and
trend of the:
Item
Description
Time period
Range of time in which the displayed data was collected; applies to all card sizes.
Indicates data is for overall Network Health.
Health trend
Trend of system, network service, and interface health, represented by an arrow:
Pointing upward and green: Health score in the most recent window is higher than in the last two data collection windows, an increasing trend.
Pointing downward and bright pink: Health score in the most recent window is lower than in the last two data collection windows, a decreasing trend.
No arrow: Health score is unchanged over the last two data collection windows, trend is steady.
The data collection window varies based on the time period of the card. For a 24 hour time period (default), the window is one hour. This gives you current, hourly, updates about your network health.
Health score
Percentage of devices which passed validation versus the number of devices checked during the time window for:
System health: NetQ Agent health and sensors
Network services health: BGP, CLAG, EVPN, NTP, OSPF, and VXLAN health
Interface health: interfaces MTU, VLAN health.
The data collection window varies based on the time period of the card. For a 24 hour time period (default), the window is one hour. This gives you current, hourly, updates about your network health.
Chart
Distribution of overall health status during the designated time period.
The large Network Health card contains three tabs.
The System Health tab displays:
Item
Description
Time period
Range of time in which the displayed data was collected; applies to all card sizes.
Indicates data is for System Health.
Health trend
Trend of NetQ Agents and sensor health, represented by an arrow:
Pointing upward and green: Health score in the most recent window is higher than in the last two data collection windows, an increasing trend.
Pointing downward and bright pink: Health score in the most recent window is lower than in the last two data collection windows, a decreasing trend.
No arrow: Health score is unchanged over the last two data collection windows, trend is steady.
The data collection window varies based on the time period of the card. For a 24 hour time period (default), the window is one hour. This gives you current, hourly, updates about your network health.
Health score
Percentage of devices which passed validation versus the number of devices checked during the time window for NetQ Agents and platform sensors.
The data collection window varies based on the time period of the card. For a 24 hour time period (default), the window is one hour. This gives you current, hourly, updates about your network health.
Charts
Distribution of health score for NetQ Agents and platform sensors during the designated time period.
Table
Listing of items that match the filter selection:
Most Failures: Devices with the most validation failures are listed at the top.
Recent Failures: Most recent validation failures are listed at the top.
Show All Validations
Opens full screen Network Health card with a listing of validations performed by network service and protocol.
The Network Service Health tab displays:
Item
Description
Time period
Range of time in which the displayed data was collected; applies to all card sizes.
Indicates data is for Network Protocols and Services Health.
Health trend
Trend of BGP, CLAG, EVPN, NTP, OSPF, and VXLAN services health, represented by an arrow:
Pointing upward and green: Health score in the most recent window is higher than in the last two data collection windows, an increasing trend.
Pointing downward and bright pink: Health score in the most recent window is lower than in the last two data collection windows, a decreasing trend.
No arrow: Health score is unchanged over the last two data collection windows, trend is steady.
The data collection window varies based on the time period of the card. For a 24 hour time period (default), the window is one hour. This gives you current, hourly, updates about your network health.
Health score
Percentage of devices which passed validation versus the number of devices checked during the time window for BGP, CLAG, EVPN, NTP, and VXLAN protocols and services.
The data collection window varies based on the time period of the card. For a 24 hour time period (default), the window is one hour. This gives you current, hourly, updates about your network health.
Charts
Distribution of passing validations for BGP, CLAG, EVPN, NTP, and VXLAN services during the designated time period.
Table
Listing of devices that match the filter selection:
Most Failures: Devices with the most validation failures are listed at the top.
Recent Failures: Most recent validation failures are listed at the top.
Show All Validations
Opens full screen Network Health card with a listing of validations performed by network service and protocol.
The Interface Health tab displays:
Item
Description
Time period
Range of time in which the displayed data was collected; applies to all card sizes.
Indicates data is for Interface Health.
Health trend
Trend of interfaces, VLAN, and MTU health, represented by an arrow:
Pointing upward and green: Health score in the most recent window is higher than in the last two data collection windows, an increasing trend.
Pointing downward and bright pink: Health score in the most recent window is lower than in the last two data collection windows, a decreasing trend.
No arrow: Health score is unchanged over the last two data collection windows, trend is steady.
The data collection window varies based on the time period of the card. For a 24 hour time period (default), the window is one hour. This gives you current, hourly, updates about your network health.
Health score
Percentage of devices which passed validation versus the number of devices checked during the time window for interfaces, VLAN, and MTU protocols and ports.
The data collection window varies based on the time period of the card. For a 24 hour time period (default), the window is one hour. This gives you current, hourly, updates about your network health.
Charts
Distribution of passing validations for interfaces, VLAN, and MTU protocols and ports during the designated time period.
Table
Listing of devices that match the filter selection:
Most Failures: Devices with the most validation failures are listed at the top.
Recent Failures: Most recent validation failures are listed at the top.
Show All Validations
Opens full screen Network Health card with a listing of validations performed by network service and protocol.
The full screen Network Health card displays all events in the network.
Item
Description
Title
Network Health.
Closes full screen card and returns to workbench.
Default Time
Range of time in which the displayed data was collected.
Displays data refresh status. Click to pause data refresh. Click to resume data refresh. Current refresh rate is visible by hovering over icon.
Results
Number of results found for the selected tab.
Network protocol or service tab
Displays results of that network protocol or service validations that occurred during the designated time period. By default, the requests list is sorted by the date and time that the validation was completed (Time). This tab provides the following additional data about all protocols and services:
Validation Label: User-defined name of a validation or Default validation
Total Node Count: Number of nodes running the protocol or service
Checked Node Count: Number of nodes running the protocol or service included in the validation
Failed Node Count: Number of nodes that failed the validation
Rotten Node Count: Number of nodes that were unreachable during the validation run
Warning Node Count: Number of nodes that had errors during the validation run
The following protocols and services have additional data:
BGP
Total Session Count: Number of sessions running BGP included in the validation
Failed Session Count: Number of BGP sessions that failed the validation
EVPN
Total Session Count: Number of sessions running BGP included in the validation
Checked VNIs Count: Number of VNIs included in the validation
Failed BGP Session Count: Number of BGP sessions that failed the validation
Interfaces
Checked Port Count: Number of ports included in the validation
Failed Port Count: Number of ports that failed the validation.
Unverified Port Count: Number of ports where a peer could not be identified
MTU
Total Link Count: Number of links included in the validation
Failed Link Count: Number of links that failed the validation
NTP
Unknown Node Count: Number of nodes that NetQ sees but are not in its inventory an thus not included in the validation
OSPF
Total Adjacent Count: Number of adjacencies included in the validation
Failed Adjacent Count: Number of adjacencies that failed the validation
Sensors
Checked Sensor Count: Number of sensors included in the validation
Failed Sensor Count: Number of sensors that failed the validation
VLAN
Total Link Count: Number of links included in the validation
Failed Link Count: Number of links that failed the validation
Table Actions
Select, export, or filter the list. Refer to Table Settings.
Network Services Cards
There are two cards for each of the supported network protocols and services—one for the service as a whole and one for a given session. The network services cards can be added to user-created workbenches.
ALL BGP Sessions Card
This card displays performance and status information for all BGP sessions across all nodes in your network.
The small BGP Service card displays:
Item
Description
Indicates data is for all sessions of a Network Service or Protocol
Title
BGP: All BGP Sessions, or the BGP Service
Total number of switches and hosts with the BGP service enabled during the designated time period
Total number of BGP-related alarms received during the designated time period
Chart
Distribution of new BGP-related alarms received during the designated time period
The medium BGP Service card displays:
Item
Description
Time period
Range of time in which the displayed data was collected; applies to all card sizes.
Indicates data is for all sessions of a Network Service or Protocol.
Title
Network Services | All BGP Sessions
Total number of switches and hosts with the BGP service enabled during the designated time period.
Total number of BGP-related alarms received during the designated time period.
Total Nodes Running chart
Distribution of switches and hosts with the BGP service enabled during the designated time period, and a total number of nodes running the service currently.
Note: The node count here might be different than the count in the summary bar. For example, the number of nodes running BGP last week or last month might be more or less than the number of nodes running BGP currently.
Total Open Alarms chart
Distribution of BGP-related alarms received during the designated time period, and the total number of current BGP-related alarms in the network.
Note: The alarm count here might be different than the count in the summary bar. For example, the number of new alarms received in this time period does not take into account alarms that have already been received and are still active. You might have no new alarms, but still have a total number of alarms present on the network of 10.
Total Nodes Not Est. chart
Distribution of switches and hosts with unestablished BGP sessions during the designated time period, and the total number of unestablished sessions in the network currently.
Note: The node count here might be different than the count in the summary bar. For example, the number of unestablished session last week or last month might be more of less than the number of nodes with unestablished sessions currently.
The large BGP service card contains two tabs.
The Sessions Summary tab displays:
Item
Description
Time period
Range of time in which the displayed data was collected; applies to all card sizes.
Indicates data is for all sessions of a Network Service or Protocol.
Title
Sessions Summary (visible when you hover over card).
Total number of switches and hosts with the BGP service enabled during the designated time period.
Total number of BGP-related alarms received during the designated time period.
Total Nodes Running chart
Distribution of switches and hosts with the BGP service enabled during the designated time period, and a total number of nodes running the service currently.
Note: The node count here might be different than the count in the summary bar. For example, the number of nodes running BGP last week or last month might be more or less than the number of nodes running BGP currently.
Total Nodes Not Est. chart
Distribution of switches and hosts with unestablished BGP sessions during the designated time period, and the total number of unestablished sessions in the network currently.
Note: The node count here might be different than the count in the summary bar. For example, the number of unestablished session last week or last month might be more of less than the number of nodes with unestablished sessions currently.
Table/Filter options
When the Switches with Most Sessions filter option is selected, the table displays the switches and hosts running BGP sessions in decreasing order of session count-devices with the largest number of sessions are listed first.
When the Switches with Most Unestablished Sessions filter option is selected, the table switches and hosts running BGP sessions in decreasing order of unestablished sessions-devices with the largest number of unestablished sessions are listed first.
Show All Sessions
Link to view data for all BGP sessions in the full screen card.
The Alarms tab displays:
Item
Description
Time period
Range of time in which the displayed data was collected; applies to all card sizes.
(in header)
Indicates data is for all alarms for all BGP sessions.
Title
Alarms (visible when you hover over card).
Total number of switches and hosts with the BGP service enabled during the designated time period.
(in summary bar)
Total number of BGP-related alarms received during the designated time period.
Total Alarms chart
Distribution of BGP-related alarms received during the designated time period, and the total number of current BGP-related alarms in the network.
Note: The alarm count here might be different than the count in the summary bar. For example, the number of new alarms received in this time period does not take into account alarms that have already been received and are still active. You might have no new alarms, but still have a total number of alarms present on the network of 10.
Table/Filter options
When the selected filter option is Switches with Most Alarms, the table displays switches and hosts running BGP in decreasing order of the count of alarms-devices with the largest number of BGP alarms are listed first.
Show All Sessions
Link to view data for all BGP sessions in the full screen card.
The full screen BGP Service card provides tabs for all switches, all sessions, and all alarms.
Item
Description
Title
Network Services | BGP.
Closes full screen card and returns to workbench.
Time period
Range of time in which the displayed data was collected; applies to all card sizes; select an alternate time period by clicking .
Displays data refresh status. Click to pause data refresh. Click to resume data refresh. Current refresh rate is visible by hovering over icon.
Results
Number of results found for the selected tab.
All Switches tab
Displays all switches and hosts running the BGP service. By default, the device list is sorted by hostname. This tab provides the following additional data about each device:
Agent
State: Indicates communication state of the NetQ Agent on a given device. Values include Fresh (heard from recently) and Rotten (not heard from recently).
Version: Software version number of the NetQ Agent on a given device. This should match the version number of the NetQ software loaded on your server or appliance; for example, 2.2.0.
ASIC
Core BW: Maximum sustained/rated bandwidth. Example values include 2.0 T and 720 G.
Model: Chip family. Example values include Tomahawk, Trident, and Spectrum.
Model Id: Identifier of networking ASIC model. Example values include BCM56960 and BCM56854.
Ports: Indicates port configuration of the switch. Example values include 32 x 100G-QSFP28, 48 x 10G-SFP+, and 6 x 40G-QSFP+.
Vendor: Manufacturer of the chip. Example values include Broadcom and Mellanox.
CPU
Arch: Microprocessor architecture type. Values include x86_64 (Intel), ARMv7 (AMD), and PowerPC.
Max Freq: Highest rated frequency for CPU. Example values include 2.40 GHz and 1.74 GHz.
Model: Chip family. Example values include Intel Atom C2538 and Intel Atom C2338.
Nos: Number of cores. Example values include 2, 4, and 8.
Disk Total Size: Total amount of storage space in physical disks (not total available). Example values: 10 GB, 20 GB, 30 GB.
Memory Size: Total amount of local RAM. Example values include 8192 MB and 2048 MB.
OS
Vendor: Operating System manufacturer. Values include Cumulus Networks, RedHat, Ubuntu, and CentOS.
Version: Software version number of the OS. Example values include 3.7.3, 2.5.x, 16.04, 7.1.
Version Id: Identifier of the OS version. For Cumulus, this is the same as the Version (3.7.x).
Platform
Date: Date and time the platform was manufactured. Example values include 7/12/18 and 10/29/2015.
MAC: System MAC address. Example value: 17:01:AB:EE:C3:F5.
Model: Manufacturer's model name. Examples values include AS7712-32X and S4048-ON.
Number: Manufacturer part number. Examples values include FP3ZZ7632014A, 0J09D3.
Revision: Release version of the platform.
Series: Manufacturer serial number. Example values include D2060B2F044919GD000060, CN046MRJCES0085E0004.
Vendor: Manufacturer of the platform. Example values include Cumulus Express, Dell, EdgeCore, Lenovo, Mellanox.
Time: Date and time the data was collected from device.
All Sessions tab
Displays all BGP sessions networkwide. By default, the session list is sorted by hostname. This tab provides the following additional data about each session:
ASN: Autonomous System Number, identifier for a collection of IP networks and routers. Example values include 633284,655435.
Conn Dropped: Number of dropped connections for a given session.
Conn Estd: Number of connections established for a given session.
DB State: Session state of DB.
Evpn Pfx Rcvd: Address prefix received for EVPN traffic. Examples include 115, 35.
Ipv4, and Ipv6 Pfx Rcvd: Address prefix received for IPv4 or IPv6 traffic. Examples include 31, 14, 12.
Last Reset Time: Date and time at which the session was last established or reset.
Objid: Object identifier for service.
OPID: Customer identifier. This is always zero.
Peer
ASN: Autonomous System Number for peer device
Hostname: User-defined name for peer device
Name: Interface name or hostname of peer device
Router Id: IP address of router with access to the peer device
Reason: Text describing the cause of, or trigger for, an event.
Rx and Tx Families: Address families supported for the receive and transmit session channels. Values include ipv4, ipv6, and evpn.
State: Current state of the session. Values include Established and NotEstd (not established).
Timestamp: Date and time session was started, deleted, updated or marked dead (device is down).
Upd8 Rx: Count of protocol messages received.
Upd8 Tx: Count of protocol messages transmitted.
Up Time: Number of seconds the session has been established, in EPOCH notation. Example: 1550147910000.
Vrf: Name of the Virtual Route Forwarding interface. Examples: default, mgmt, DataVrf1081.
Vrfid: Integer identifier of the VRF interface when used. Examples: 14, 25, 37.
All Alarms tab
Displays all BGP events networkwide. By default, the event list is sorted by time, with the most recent events listed first. The tab provides the following additional data about each event:
Source: Hostname of network device that generated the event.
Message: Text description of a BGP-related event. Example: BGP session with peer tor-1 swp7 vrf default state changed from failed to Established.
Type: Network protocol or service generating the event. This always has a value of bgp in this card workflow.
Severity: Importance of the event. Values include critical, warning, info, and debug.
Table Actions
Select, export, or filter the list. Refer to Table Settings.
BGP Session Card
This card displays performance and status information for a single BGP session. Card is opened from the full-screen Network Services|All BGP Sessions card.
The small BGP Session card displays:
Item
Description
Indicates data is for a single session of a Network Service or Protocol.
Title
BGP Session.
Hostnames of the two devices in a session. Arrow points from the host to the peer.
,
Current status of the session, either established or not established.
The medium BGP Session card displays:
Item
Description
Time period
Range of time in which the displayed data was collected; applies to all card sizes.
Indicates data is for a single session of a Network Service or Protocol.
Title
Network Services | BGP Session.
Hostnames of the two devices in a session. Arrow points in the direction of the session.
,
Current status of the session, either established or not established.
Time period for chart
Time period for the chart data.
Session State Changes Chart
Heat map of the state of the given session over the given time period. The status is sampled at a rate consistent with the time period. For example, for a 24 hour period, a status is collected every hour. Refer to Granularity of Data Shown Based on Time Period.
Peer Name
Interface name on or hostname for peer device.
Peer ASN
Autonomous System Number for peer device.
Peer Router ID
IP address of router with access to the peer device.
Peer Hostname
User-defined name for peer device.
The large BGP Session card contains two tabs.
The Session Summary tab displays:
Item
Description
Time period
Range of time in which the displayed data was collected; applies to all card sizes.
Indicates data is for a single session of a Network Service or Protocol.
Title
Session Summary (Network Services | BGP Session).
Summary bar
Hostnames of the two devices in a session.
Current status of the session-either established , or not established .
Session State Changes Chart
Heat map of the state of the given session over the given time period. The status is sampled at a rate consistent with the time period. For example, for a 24 hour period, a status is collected every hour. Refer to Granularity of Data Shown Based on Time Period.
Alarm Count Chart
Distribution and count of BGP alarm events over the given time period.
Info Count Chart
Distribution and count of BGP info events over the given time period.
Connection Drop Count
Number of times the session entered the not established state during the time period.
ASN
Autonomous System Number for host device.
RX/TX Families
Receive and Transmit address types supported. Values include IPv4, IPv6, and EVPN.
Peer Hostname
User-defined name for peer device.
Peer Interface
Interface on which the session is connected.
Peer ASN
Autonomous System Number for peer device.
Peer Router ID
IP address of router with access to the peer device.
The Configuration File Evolution tab displays:
Item
Description
Time period
Range of time in which the displayed data was collected; applies to all card sizes.
Indicates configuration file information for a single session of a Network Service or Protocol.
Device identifiers (hostname, IP address, or MAC address) for host and peer in session. Click on to open associated device card.
,
Indication of host role, primary or secondary .
Timestamps
When changes to the configuration file have occurred, the date and time are indicated. Click the time to see the changed file.
Configuration File
When File is selected, the configuration file as it was at the selected time is shown.
When Diff is selected, the configuration file at the selected time is shown on the left and the configuration file at the previous timestamp is shown on the right. Differences are highlighted.
Note: If no configuration file changes have been made, only the original file date is shown.
The full screen BGP Session card provides tabs for all BGP sessions and all events.
Item
Description
Title
Network Services | BGP.
Closes full screen card and returns to workbench.
Time period
Range of time in which the displayed data was collected; applies to all card sizes.
Displays data refresh status. Click to pause data refresh. Click to resume data refresh. Current refresh rate is visible by hovering over icon.
Results
Number of results found for the selected tab.
All BGP Sessions tab
Displays all BGP sessions running on the host device. This tab provides the following additional data about each session:
ASN: Autonomous System Number, identifier for a collection of IP networks and routers. Example values include 633284,655435.
Conn Dropped: Number of dropped connections for a given session.
Conn Estd: Number of connections established for a given session.
DB State: Session state of DB.
Evpn Pfx Rcvd: Address prefix for EVPN traffic. Examples include 115, 35.
Ipv4, and Ipv6 Pfx Rcvd: Address prefix for IPv4 or IPv6 traffic. Examples include 31, 14, 12.
Last Reset Time: Time at which the session was last established or reset.
Objid: Object identifier for service.
OPID: Customer identifier. This is always zero.
Peer:
ASN: Autonomous System Number for peer device
Hostname: User-defined name for peer device
Name: Interface name or hostname of peer device
Router Id: IP address of router with access to the peer device
Reason: Event or cause of failure.
Rx and Tx Families: Address families supported for the receive and transmit session channels. Values include ipv4, ipv6, and evpn.
State: Current state of the session. Values include Established and NotEstd (not established).
Timestamp: Date and time session was started, deleted, updated or marked dead (device is down).
Upd8 Rx: Count of protocol messages received.
Upd8 Tx: Count of protocol messages transmitted.
Up Time: Number of seconds the session has be established, in EPOC notation. Example: 1550147910000.
Vrf: Name of the Virtual Route Forwarding interface. Examples: default, mgmt, DataVrf1081.
Vrfid: Integer identifier of the VRF interface when used. Examples: 14, 25, 37.
All Events tab
Displays all events networkwide. By default, the event list is sorted by time, with the most recent events listed first. The tab provides the following additional data about each event:
Message: Text description of a BGP-related event. Example: BGP session with peer tor-1 swp7 vrf default state changed from failed to Established.
Source: Hostname of network device that generated the event.
Severity: Importance of the event. Values include critical, warning, info, and debug.
Type: Network protocol or service generating the event. This always has a value of bgp in this card workflow.
Table Actions
Select, export, or filter the list. Refer to Table Settings.
With NetQ, you can monitor the number of nodes running the EVPN service, view switches with the sessions, total number of VNIs, and alarms triggered by the EVPN service. For an overview and how to configure EVPN in your data center network, refer to
Ethernet Virtual Private Network-EVPN.
All EVPN Sessions Card
This card displays performance and status information for all EVPN sessions across all nodes in your network.
The small EVPN Service card displays:
Item
Description
Indicates data is for all sessions of a Network Service or Protocol
Title
EVPN: All EVPN Sessions, or the EVPN Service
Total number of switches and hosts with the EVPN service enabled during the designated time period
Total number of EVPN-related alarms received during the designated time period
Chart
Distribution of EVPN-related alarms received during the designated time period
The medium EVPN Service card displays:
Item
Description
Time period
Range of time in which the displayed data was collected; applies to all card sizes.
Indicates data is for all sessions of a Network Service or Protocol.
Title
Network Services | All EVPN Sessions.
Total number of switches and hosts with the EVPN service enabled during the designated time period.
Total number of EVPN-related alarms received during the designated time period.
Total Nodes Running chart
Distribution of switches and hosts with the EVPN service enabled during the designated time period, and a total number of nodes running the service currently.
Note: The node count here might be different than the count in the summary bar. For example, the number of nodes running EVPN last week or last month might be more or less than the number of nodes running EVPN currently.
Total Open Alarms chart
Distribution of EVPN-related alarms received during the designated time period, and the total number of current EVPN-related alarms in the network.
Note: The alarm count here might be different than the count in the summary bar. For example, the number of new alarms received in this time period does not take into account alarms that have already been received and are still active. You might have no new alarms, but still have a total number of alarms present on the network of 10.
Total Sessions chart
Distribution of EVPN sessions during the designated time period, and the total number of sessions running on the network currently.
The large EVPN service card contains two tabs.
The Sessions Summary tab which displays:
Item
Description
Time period
Range of time in which the displayed data was collected; applies to all card sizes.
Indicates data is for all sessions of a Network Service or Protocol.
Title
Sessions Summary (visible when you hover over card).
Total number of switches and hosts with the EVPN service enabled during the designated time period.
Total number of EVPN-related alarms received during the designated time period.
Total Nodes Running chart
Distribution of switches and hosts with the EVPN service enabled during the designated time period, and a total number of nodes running the service currently.
Note: The node count here might be different than the count in the summary bar. For example, the number of nodes running EVPN last week or last month might be more or less than the number of nodes running EVPN currently.
Total Sessions chart
Distribution of EVPN sessions during the designated time period, and the total number of sessions running on the network currently.
Total L3 VNIs chart
Distribution of layer 3 VXLAN Network Identifiers during this time period, and the total number of VNIs in the network currently.
Table/Filter options
When the Top Switches with Most Sessions filter is selected, the table displays devices running EVPN sessions in decreasing order of session count-devices with the largest number of sessions are listed first.
When the Switches with Most L2 EVPN filter is selected, the table displays devices running layer 2 EVPN sessions in decreasing order of session count-devices with the largest number of sessions are listed first.
When the Switches withMost L3 EVPN filter is selected, the table displays devices running layer 3 EVPN sessions in decreasing order of session count-devices with the largest number of sessions are listed first.
Show All Sessions
Link to view data for all EVPN sessions network-wide in the full screen card.
The Alarms tab which displays:
Item
Description
Time period
Range of time in which the displayed data was collected; applies to all card sizes.
(in header)
Indicates data is for all alarms for all sessions of a Network Service or Protocol.
Title
Alarms (visible when you hover over card).
Total number of switches and hosts with the EVPN service enabled during the designated time period.
(in summary bar)
Total number of EVPN-related alarms received during the designated time period.
Total Alarms chart
Distribution of EVPN-related alarms received during the designated time period, and the total number of current BGP-related alarms in the network.
Note: The alarm count here might be different than the count in the summary bar. For example, the number of new alarms received in this time period does not take into account alarms that have already been received and are still active. You might have no new alarms, but still have a total number of alarms present on the network of 10.
Table/Filter options
When the Events by Most Active Device filter is selected, the table displays devices running EVPN sessions in decreasing order of alarm count-devices with the largest number of alarms are listed first.
Show All Sessions
Link to view data for all EVPN sessions in the full screen card.
The full screen EVPN Service card provides tabs for all switches, all sessions, all alarms.
Item
Description
Title
Network Services | EVPN
Closes full screen card and returns to workbench.
Time period
Range of time in which the displayed data was collected; applies to all card sizes; select an alternate time period by clicking .
Displays data refresh status. Click to pause data refresh. Click to resume data refresh. Current refresh rate is visible by hovering over icon.
Results
Number of results found for the selected tab.
All Switches tab
Displays all switches and hosts running the EVPN service. By default, the device list is sorted by hostname. This tab provides the following additional data about each device:
Agent
State: Indicates communication state of the NetQ Agent on a given device. Values include Fresh (heard from recently) and Rotten (not heard from recently).
Version: Software version number of the NetQ Agent on a given device. This should match the version number of the NetQ software loaded on your server or appliance; for example, 2.1.0.
ASIC
Core BW: Maximum sustained/rated bandwidth. Example values include 2.0 T and 720 G.
Model: Chip family. Example values include Tomahawk, Trident, and Spectrum.
Model Id: Identifier of networking ASIC model. Example values include BCM56960 and BCM56854.
Ports: Indicates port configuration of the switch. Example values include 32 x 100G-QSFP28, 48 x 10G-SFP+, and 6 x 40G-QSFP+.
Vendor: Manufacturer of the chip. Example values include Broadcom and Mellanox.
CPU
Arch: Microprocessor architecture type. Values include x86_64 (Intel), ARMv7 (AMD), and PowerPC.
Max Freq: Highest rated frequency for CPU. Example values include 2.40 GHz and 1.74 GHz.
Model: Chip family. Example values include Intel Atom C2538 and Intel Atom C2338.
Nos: Number of cores. Example values include 2, 4, and 8.
Disk Total Size: Total amount of storage space in physical disks (not total available). Example values: 10 GB, 20 GB, 30 GB.
Memory Size: Total amount of local RAM. Example values include 8192 MB and 2048 MB.
OS
Vendor: Operating System manufacturer. Values include Cumulus Networks, RedHat, Ubuntu, and CentOS.
Version: Software version number of the OS. Example values include 3.7.3, 2.5.x, 16.04, 7.1.
Version Id: Identifier of the OS version. For Cumulus, this is the same as the Version (3.7.x).
Platform
Date: Date and time the platform was manufactured. Example values include 7/12/18 and 10/29/2015.
MAC: System MAC address. Example value: 17:01:AB:EE:C3:F5.
Model: Manufacturer's model name. Examples include AS7712-32X and S4048-ON.
Number: Manufacturer part number. Examples values include FP3ZZ7632014A, 0J09D3.
Revision: Release version of the platform.
Series: Manufacturer serial number. Example values include D2060B2F044919GD000060, CN046MRJCES0085E0004.
Vendor: Manufacturer of the platform. Example values include Cumulus Express, Dell, EdgeCore, Lenovo, Mellanox.
Time: Date and time the data was collected from device.
All Sessions tab
Displays all EVPN sessions network-wide. By default, the session list is sorted by hostname. This tab provides the following additional data about each session:
Adv All Vni: Indicates whether the VNI state is advertising all VNIs (true) or not (false).
Adv Gw Ip: Indicates whether the host device is advertising the gateway IP address (true) or not (false).
DB State: Session state of the DB.
Export RT: IP address and port of the export route target used in the filtering mechanism for BGP route exchange.
Import RT: IP address and port of the import route target used in the filtering mechanism for BGP route exchange.
In Kernel: Indicates whether the associated VNI is in the kernel (in kernel) or not (not in kernel).
Is L3: Indicates whether the session is part of a layer 3 configuration (true) or not (false).
Origin Ip: Host device's local VXLAN tunnel IP address for the EVPN instance.
OPID: LLDP service identifier.
Rd: Route distinguisher used in the filtering mechanism for BGP route exchange.
Timestamp: Date and time the session was started, deleted, updated or marked as dead (device is down).
Vni: Name of the VNI where session is running.
All Alarms tab
Displays all EVPN events network-wide. By default, the event list is sorted by time, with the most recent events listed first. The tab provides the following additional data about each event:
Message: Text description of a EVPN-related event. Example: VNI 3 kernel state changed from down to up.
Source: Hostname of network device that generated the event.
Severity: Importance of the event. Values include critical, warning, info, and debug.
Type: Network protocol or service generating the event. This always has a value of evpn in this card workflow.
Table Actions
Select, export, or filter the list. Refer to Table Settings.
EVPN Session Card
This card displays performance and status information for a single EVPN session. Card is opened from the full-screen Network Services|All EVPN Sessions card.
The small EVPN Session card displays:
Item
Description
Indicates data is for an EVPN session
Title
EVPN Session
VNI Name
Name of the VNI (virtual network instance) used for this EVPN session
Current VNI Nodes
Total number of VNI nodes participating in the EVPN session currently
The medium EVPN Session card displays:
Item
Description
Time period
Range of time in which the displayed data was collected; applies to all card sizes
Indicates data is for an EVPN session
Title
Network Services|EVPN Session
Summary bar
VTEP (VXLAN Tunnel EndPoint) Count: Total number of VNI nodes participating in the EVPN session currently
VTEP Count Over Time chart
Distribution of VTEP counts during the designated time period
VNI Name
Name of the VNI used for this EVPN session
Type
Indicates whether the session is established as part of a layer 2 (L2) or layer 3 (L3) overlay network
The large EVPN Session card contains two tabs.
The Session Summary tab displays:
Item
Description
Time period
Range of time in which the displayed data was collected; applies to all card sizes
Indicates data is for an EVPN session
Title
Session Summary (Network Services | EVPN Session)
Summary bar
VTEP (VXLAN Tunnel EndPoint) Count: Total number of VNI devices participating in the EVPN session currently
VTEP Count Over Time chart
Distribution of VTEPs during the designated time period
Alarm Count chart
Distribution of alarms during the designated time period
Info Count chart
Distribution of info events during the designated time period
Table
VRF (for layer 3) or VLAN (for layer 2) identifiers by device
The Configuration File Evolution tab displays:
Item
Description
Time period
Range of time in which the displayed data was collected; applies to all card sizes.
Indicates configuration file information for a single session of a Network Service or Protocol.
When changes to the configuration file have occurred, the date and time are indicated. Click the time to see the changed file.
Configuration File
When File is selected, the configuration file as it was at the selected time is shown.
When Diff is selected, the configuration file at the selected time is shown on the left and the configuration file at the previous timestamp is shown on the right. Differences are highlighted.
Note: If no configuration file changes have been made, only the original file date is shown.
The full screen EVPN Session card provides tabs for all EVPN sessions
and all events.
Item
Description
Title
Network Services | EVPN.
Closes full screen card and returns to workbench.
Time period
Range of time in which the displayed data was collected; applies to all card sizes; select an alternate time period by clicking .
Displays data refresh status. Click to pause data refresh. Click to resume data refresh. Current refresh rate is visible by hovering over icon.
Results
Number of results found for the selected tab.
All EVPN Sessions tab
Displays all EVPN sessions network-wide. By default, the session list is sorted by hostname. This tab provides the following additional data about each session:
Adv All Vni: Indicates whether the VNI state is advertising all VNIs (true) or not (false).
Adv Gw Ip: Indicates whether the host device is advertising the gateway IP address (true) or not (false).
DB State: Session state of the DB.
Export RT: IP address and port of the export route target used in the filtering mechanism for BGP route exchange.
Import RT: IP address and port of the import route target used in the filtering mechanism for BGP route exchange.
In Kernel: Indicates whether the associated VNI is in the kernel (in kernel) or not (not in kernel).
Is L3: Indicates whether the session is part of a layer 3 configuration (true) or not (false).
Origin Ip: Host device's local VXLAN tunnel IP address for the EVPN instance.
OPID: LLDP service identifier.
Rd: Route distinguisher used in the filtering mechanism for BGP route exchange.
Timestamp: Date and time the session was started, deleted, updated or marked as dead (device is down).
Vni: Name of the VNI where session is running.
All Events tab
Displays all events network-wide. By default, the event list is sorted by time, with the most recent events listed first. The tab provides the following additional data about each event:
Message: Text description of a EVPN-related event. Example: VNI 3 kernel state changed from down to up.
Source: Hostname of network device that generated the event.
Severity: Importance of the event. Values include critical, warning, info, and debug.
Type: Network protocol or service generating the event. This always has a value of evpn in this card workflow.
Table Actions
Select, export, or filter the list. Refer to Table Settings.
ALL LLDP Sessions Card
This card displays performance and status information for all LLDP sessions across all nodes in your network.
With NetQ, you can monitor the number of nodes running the LLDP service, view nodes with the most LLDP neighbor nodes, those nodes with the least neighbor nodes, and view alarms triggered by the LLDP service. For an overview and how to configure LLDP in your data center network, refer to
Link Layer Discovery Protocol.
The small LLDP Service card displays:
Item
Description
Indicates data is for all sessions of a Network Service or Protocol.
Title
LLDP: All LLDP Sessions, or the LLDP Service.
Total number of switches with the LLDP service enabled during the designated time period.
Total number of LLDP-related alarms received during the designated time period.
Chart
Distribution of LLDP-related alarms received during the designated time period.
The medium LLDP Service card displays:
Item
Description
Time period
Range of time in which the displayed data was collected; applies to all card sizes.
Indicates data is for all sessions of a Network Service or Protocol.
Title
LLDP: All LLDP Sessions, or the LLDP Service.
Total number of switches with the LLDP service enabled during the designated time period.
Total number of LLDP-related alarms received during the designated time period.
Total Nodes Running chart
Distribution of switches and hosts with the LLDP service enabled during the designated time period, and a total number of nodes running the service currently.
Note: The node count here might be different than the count in the summary bar. For example, the number of nodes running LLDP last week or last month might be more or less than the number of nodes running LLDP currently.
Total Open Alarms chart
Distribution of LLDP-related alarms received during the designated time period, and the total number of current LLDP-related alarms in the network.
Note: The alarm count here might be different than the count in the summary bar. For example, the number of new alarms received in this time period does not take into account alarms that have already been received and are still active. You might have no new alarms, but still have a total number of alarms present on the network of 10.
Total Sessions chart
Distribution of LLDP sessions running during the designated time period, and the total number of sessions running on the network currently.
The large LLDP service card contains two tabs.
The Sessions Summary tab which displays:
Item
Description
Time period
Range of time in which the displayed data was collected; applies to all card sizes.
Indicates data is for all sessions of a Network Service or Protocol.
Title
Sessions Summary (Network Services | All LLDP Sessions).
Total number of switches with the LLDP service enabled during the designated time period.
Total number of LLDP-related alarms received during the designated time period.
Total Nodes Running chart
Distribution of switches and hosts with the LLDP service enabled during the designated time period, and a total number of nodes running the service currently.
Note: The node count here might be different than the count in the summary bar. For example, the number of nodes running LLDP last week or last month might be more or less than the number of nodes running LLDP currently.
Total Sessions chart
Distribution of LLDP sessions running during the designated time period, and the total number of sessions running on the network currently.
Total Sessions with No Nbr chart
Distribution of LLDP sessions missing neighbor information during the designated time period, and the total number of session missing neighbors in the network currently.
Table/Filter options
When the Switches with Most Sessions filter is selected, the table displays switches running LLDP sessions in decreasing order of session count-devices with the largest number of sessions are listed first.
When the Switches with Most Unestablished Sessions filter is selected, the table displays switches running LLDP sessions in decreasing order of unestablished session count-devices with the largest number of unestablished sessions are listed first.
Show All Sessions
Link to view all LLDP sessions in the full screen card.
The Alarms tab which displays:
Item
Description
Time period
Range of time in which the displayed data was collected; applies to all card sizes.
(in header)
Indicates data is all alarms for all LLDP sessions.
Title
Alarms (visible when you hover over card).
Total number of switches with the LLDP service enabled during the designated time period.
(in summary bar)
Total number of LLDP-related alarms received during the designated time period.
Total Alarms chart
Distribution of LLDP-related alarms received during the designated time period, and the total number of current LLDP-related alarms in the network.
Note: The alarm count here might be different than the count in the summary bar. For example, the number of new alarms received in this time period does not take into account alarms that have already been received and are still active. You might have no new alarms, but still have a total number of alarms present on the network of 10.
Table/Filter options
When the Events by Most Active Device filter is selected, the table displays switches running LLDP sessions in decreasing order of alarm count-devices with the largest number of sessions are listed first
Show All Sessions
Link to view all LLDP sessions in the full screen card.
The full screen LLDP Service card provides tabs for all switches, all sessions, and all alarms.
Item
Description
Title
Network Services | LLDP.
Closes full screen card and returns to workbench.
Time period
Range of time in which the displayed data was collected; applies to all card sizes; select an alternate time period by clicking .
Displays data refresh status. Click to pause data refresh. Click to resume data refresh. Current refresh rate is visible by hovering over icon.
Results
Number of results found for the selected tab.
All Switches tab
Displays all switches and hosts running the LLDP service. By default, the device list is sorted by hostname. This tab provides the following additional data about each device:
Agent
State: Indicates communication state of the NetQ Agent on a given device. Values include Fresh (heard from recently) and Rotten (not heard from recently).
Version: Software version number of the NetQ Agent on a given device. This should match the version number of the NetQ software loaded on your server or appliance; for example, 2.1.0.
ASIC
Core BW: Maximum sustained/rated bandwidth. Example values include 2.0 T and 720 G.
Model: Chip family. Example values include Tomahawk, Trident, and Spectrum.
Model Id: Identifier of networking ASIC model. Example values include BCM56960 and BCM56854.
Ports: Indicates port configuration of the switch. Example values include 32 x 100G-QSFP28, 48 x 10G-SFP+, and 6 x 40G-QSFP+.
Vendor: Manufacturer of the chip. Example values include Broadcom and Mellanox.
CPU
Arch: Microprocessor architecture type. Values include x86_64 (Intel), ARMv7 (AMD), and PowerPC.
Max Freq: Highest rated frequency for CPU. Example values include 2.40 GHz and 1.74 GHz.
Model: Chip family. Example values include Intel Atom C2538 and Intel Atom C2338.
Nos: Number of cores. Example values include 2, 4, and 8.
Disk Total Size: Total amount of storage space in physical disks (not total available). Example values: 10 GB, 20 GB, 30 GB.
Memory Size: Total amount of local RAM. Example values include 8192 MB and 2048 MB.
OS
Vendor: Operating System manufacturer. Values include Cumulus Networks, RedHat, Ubuntu, and CentOS.
Version: Software version number of the OS. Example values include 3.7.3, 2.5.x, 16.04, 7.1.
Version Id: Identifier of the OS version. For Cumulus, this is the same as the Version (3.7.x).
Platform
Date: Date and time the platform was manufactured. Example values include 7/12/18 and 10/29/2015.
MAC: System MAC address. Example value: 17:01:AB:EE:C3:F5.
Model: Manufacturer's model name. Examples include AS7712-32X and S4048-ON.
Number: Manufacturer part number. Examples values include FP3ZZ7632014A, 0J09D3.
Revision: Release version of the platform.
Series: Manufacturer serial number. Example values include D2060B2F044919GD000060, CN046MRJCES0085E0004.
Vendor: Manufacturer of the platform. Example values include Cumulus Express, Dell, EdgeCore, Lenovo, Mellanox.
Time: Date and time the data was collected from device.
All Sessions tab
Displays all LLDP sessions networkwide. By default, the session list is sorted by hostname. This tab provides the following additional data about each session:
Ifname: Name of the host interface where LLDP session is running
LLDP Peer:
Os: Operating system (OS) used by peer device. Values include Cumulus Linux, RedHat, Ubuntu, and CentOS.
Osv: Version of the OS used by peer device. Example values include 3.7.3, 2.5.x, 16.04, 7.1.
Bridge: Indicates whether the peer device is a bridge (true) or not (false)
Router: Indicates whether the peer device is a router (true) or not (false)
Station: Indicates whether the peer device is a station (true) or not (false)
Peer:
Hostname: User-defined name for the peer device
Ifname: Name of the peer interface where the session is running
Timestamp: Date and time that the session was started, deleted, updated, or marked dead (device is down)
All Alarms tab
Displays all LLDP events networkwide. By default, the event list is sorted by time, with the most recent events listed first. The tab provides the following additional data about each event:
Message: Text description of a LLDP-related event. Example: LLDP Session with host leaf02 swp6 modified fields leaf06 swp21.
Source: Hostname of network device that generated the event.
Severity: Importance of the event. Values include critical, warning, info, and debug.
Type: Network protocol or service generating the event. This always has a value of lldp in this card workflow.
Table Actions
Select, export, or filter the list. Refer to Table Settings.
LLDP Session Card
This card displays performance and status information for a single LLDP session. Card is opened from the full-screen Network Services|All LLDP Sessions card.
The small LLDP Session card displays:
Item
Description
Indicates data is for a single session of a Network Service or Protocol.
Title
LLDP Session.
Host and peer devices in session. Host is shown on top, with peer below.
,
Indicates whether the host sees the peer or not; has a peer, no peer.
The medium LLDP Session card displays:
Item
Description
Time period
Range of time in which the displayed data was collected.
Indicates data is for a single session of a Network Service or Protocol.
Title
LLDP Session.
Host and peer devices in session. Arrow points from host to peer.
,
Indicates whether the host sees the peer or not; has a peer, no peer.
Time period
Range of time for the distribution chart.
Heat map
Distribution of neighbor availability (detected or undetected) during this given time period.
Hostname
User-defined name of the host device.
Interface Name
Software interface on the host device where the session is running.
Peer Hostname
User-defined name of the peer device.
Peer Interface Name
Software interface on the peer where the session is running.
The large LLDP Session card contains two tabs.
The Session Summary tab displays:
Item
Description
Time period
Range of time in which the displayed data was collected.
Indicates data is for a single session of a Network Service or Protocol.
Device identifiers (hostname, IP address, or MAC address) for host and peer in session. Click to open associated device card.
,
Indicates whether the host sees the peer or not; has a peer, no peer.
Timestamps
When changes to the configuration file have occurred, the date and time are indicated. Click the time to see the changed file.
Configuration File
When File is selected, the configuration file as it was at the selected time is shown. When Diff is selected, the configuration file at the selected time is shown on the left and the configuration file at the previous timestamp is shown on the right. Differences are highlighted.
Note: If no configuration file changes have been made, the card shows no results.
The full screen LLDP Session card provides tabs for all LLDP sessions and all events.
Item
Description
Title
Network Services | LLDP.
Closes full screen card and returns to workbench.
Time period
Range of time in which the displayed data was collected; applies to all card sizes; select an alternate time period by clicking .
Displays data refresh status. Click to pause data refresh. Click to resume data refresh. Current refresh rate is visible by hovering over icon.
Results
Number of results found for the selected tab.
All LLDP Sessions tab
Displays all LLDP sessions on the host device. By default, the session list is sorted by hostname. This tab provides the following additional data about each session:
Ifname: Name of the host interface where LLDP session is running.
LLDPPeer:
Os: Operating system (OS) used by peer device. Values include Cumulus Linux, RedHat, Ubuntu, and CentOS.
Osv: Version of the OS used by peer device. Example values include 3.7.3, 2.5.x, 16.04, 7.1.
Bridge: Indicates whether the peer device is a bridge (true) or not (false).
Router: Indicates whether the peer device is a router (true) or not (false).
Station: Indicates whether the peer device is a station (true) or not (false).
Peer:
Hostname: User-defined name for the peer device.
Ifname: Name of the peer interface where the session is running.
Timestamp: Date and time that the session was started, deleted, updated, or marked dead (device is down).
All Events tab
Displays all events networkwide. By default, the event list is sorted by time, with the most recent events listed first. The tab provides the following additional data about each event:
Message: Text description of an event. Example: LLDP Session with host leaf02 swp6 modified fields leaf06 swp21.
Source: Hostname of network device that generated the event.
Severity: Importance of the event. Values include critical, warning, info, and debug.
Type: Network protocol or service generating the event. This always has a value of lldp in this card workflow.
Table Actions
Select, export, or filter the list. Refer to Table Settings.
All MLAG Sessions Card
This card displays performance and status information for all MLAG sessions across all nodes in your network.
The small MLAG Service card displays:
Item
Description
Indicates data is for all sessions of a Network Service or Protocol
Title
MLAG: All MLAG Sessions, or the MLAG Service
Total number of switches with the MLAG service enabled during the designated time period
Total number of MLAG-related alarms received during the designated time period
Chart
Distribution of MLAG-related alarms received during the designated time period
The medium MLAG Service card displays:
Item
Description
Time period
Range of time in which the displayed data was collected; applies to all card sizes.
Indicates data is for all sessions of a Network Service or Protocol.
Title
Network Services | All MLAG Sessions.
Total number of switches with the MLAG service enabled during the designated time period.
Total number of MLAG-related alarms received during the designated time period.
Total number of sessions with an inactive backup IP address during the designated time period.
Total number of bonds with only a single connection during the designated time period.
Total Nodes Running chart
Distribution of switches and hosts with the MLAG service enabled during the designated time period, and a total number of nodes running the service currently.
Note: The node count here might be different than the count in the summary bar. For example, the number of nodes running MLAG last week or last month might be more or less than the number of nodes running MLAG currently.
Total Open Alarms chart
Distribution of MLAG-related alarms received during the designated time period, and the total number of current MLAG-related alarms in the network.
Note: The alarm count here might be different than the count in the summary bar. For example, the number of new alarms received in this time period does not take into account alarms that have already been received and are still active. You might have no new alarms, but still have a total number of alarms present on the network of 10.
Total Sessions chart
Distribution of MLAG sessions running during the designated time period, and the total number of sessions running on the network currently.
The large MLAG service card contains two tabs.
The All MLAG Sessions summary tab which displays:
Item
Description
Time period
Range of time in which the displayed data was collected; applies to all card sizes.
Indicates data is for all sessions of a Network Service or Protocol.
Title
All MLAG Sessions Summary
Total number of switches with the MLAG service enabled during the designated time period.
Total number of MLAG-related alarms received during the designated time period.
Total Nodes Running chart
Distribution of switches and hosts with the MLAG service enabled during the designated time period, and a total number of nodes running the service currently.
Note: The node count here might be different than the count in the summary bar. For example, the number of nodes running MLAG last week or last month might be more or less than the number of nodes running MLAG currently.
Total Sessions chart
Distribution of MLAG sessions running during the designated time period, and the total number of sessions running on the network currently.
Total Sessions with Inactive-backup-ip chart
Distribution of sessions without an active backup IP defined during the designated time period, and the total number of these sessions running on the network currently.
Table/Filter options
When the Switches with Most Sessions filter is selected, the table displays switches running MLAG sessions in decreasing order of session count-devices with the largest number of sessions are listed first.
When the Switches with Most Unestablished Sessions filter is selected, the table displays switches running MLAG sessions in decreasing order of unestablished session count-devices with the largest number of unestablished sessions are listed first.
Show All Sessions
Link to view all MLAG sessions in the full screen card.
The All MLAG Alarms tab which displays:
Item
Description
Time period
Range of time in which the displayed data was collected; applies to all card sizes.
(in header)
Indicates alarm data for all MLAG sessions.
Title
Network Services | All MLAG Alarms (visible when you hover over card).
Total number of switches with the MLAG service enabled during the designated time period.
(in summary bar)
Total number of MLAG-related alarms received during the designated time period.
Total Alarms chart
Distribution of MLAG-related alarms received during the designated time period, and the total number of current MLAG-related alarms in the network.
Note: The alarm count here might be different than the count in the summary bar. For example, the number of new alarms received in this time period does not take into account alarms that have already been received and are still active. You might have no new alarms, but still have a total number of alarms present on the network of 10.
Table/Filter options
When the Events by Most Active Device filter is selected, the table displays switches running MLAG sessions in decreasing order of alarm count-devices with the largest number of sessions are listed first.
Show All Sessions
Link to view all MLAG sessions in the full screen card.
The full screen MLAG Service card provides tabs for all switches, all
sessions, and all alarms.
Item
Description
Title
Network Services | MLAG.
Closes full screen card and returns to workbench.
Time period
Range of time in which the displayed data was collected; applies to all card sizes; select an alternate time period by clicking .
Displays data refresh status. Click to pause data refresh. Click to resume data refresh. Current refresh rate is visible by hovering over icon.
Results
Number of results found for the selected tab.
All Switches tab
Displays all switches and hosts running the MLAG service. By default, the device list is sorted by hostname. This tab provides the following additional data about each device:
Agent
State: Indicates communication state of the NetQ Agent on a given device. Values include Fresh (heard from recently) and Rotten (not heard from recently).
Version: Software version number of the NetQ Agent on a given device. This should match the version number of the NetQ software loaded on your server or appliance; for example, 2.1.0.
ASIC
Core BW: Maximum sustained/rated bandwidth. Example values include 2.0 T and 720 G.
Model: Chip family. Example values include Tomahawk, Trident, and Spectrum.
Model Id: Identifier of networking ASIC model. Example values include BCM56960 and BCM56854.
Ports: Indicates port configuration of the switch. Example values include 32 x 100G-QSFP28, 48 x 10G-SFP+, and 6 x 40G-QSFP+.
Vendor: Manufacturer of the chip. Example values include Broadcom and Mellanox.
CPU
Arch: Microprocessor architecture type. Values include x86_64 (Intel), ARMv7 (AMD), and PowerPC.
Max Freq: Highest rated frequency for CPU. Example values include 2.40 GHz and 1.74 GHz.
Model: Chip family. Example values include Intel Atom C2538 and Intel Atom C2338.
Nos: Number of cores. Example values include 2, 4, and 8.
Disk Total Size: Total amount of storage space in physical disks (not total available). Example values: 10 GB, 20 GB, 30 GB.
Memory Size: Total amount of local RAM. Example values include 8192 MB and 2048 MB.
OS
Vendor: Operating System manufacturer. Values include Cumulus Networks, RedHat, Ubuntu, and CentOS.
Version: Software version number of the OS. Example values include 3.7.3, 2.5.x, 16.04, 7.1.
Version Id: Identifier of the OS version. For Cumulus, this is the same as the Version (3.7.x).
Platform
Date: Date and time the platform was manufactured. Example values include 7/12/18 and 10/29/2015.
MAC: System MAC address. Example value: 17:01:AB:EE:C3:F5.
Model: Manufacturer's model name. Examples values include AS7712-32X and S4048-ON.
Number: Manufacturer part number. Examples values include FP3ZZ7632014A, 0J09D3.
Revision: Release version of the platform.
Series: Manufacturer serial number. Example values include D2060B2F044919GD000060, CN046MRJCES0085E0004.
Vendor: Manufacturer of the platform. Example values include Cumulus Express, Dell, EdgeCore, Lenovo, Mellanox.
Time: Date and time the data was collected from device.
All Sessions tab
Displays all MLAG sessions network-wide. By default, the session list is sorted by hostname. This tab provides the following additional data about each session:
Backup Ip: IP address of the interface to use if the peerlink (or bond) goes down.
Backup Ip Active: Indicates whether the backup IP address has been specified and is active (true) or not (false).
Bonds
Conflicted: Identifies the set of interfaces in a bond that do not match on each end of the bond.
Single: Identifies a set of interfaces connecting to only one of the two switches.
Dual: Identifies a set of interfaces connecting to both switches.
Proto Down: Interface on the switch brought down by the clagd service. Value is blank if no interfaces are down due to clagd service.
Clag Sysmac: Unique MAC address for each bond interface pair. Note: Must be a value between 44:38:39:ff:00:00 and 44:38:39:ff:ff:ff.
Peer:
If: Name of the peer interface.
Role: Role of the peer device. Values include primary and secondary.
State: Indicates if peer device is up (true) or down (false).
Role: Role of the host device. Values include primary and secondary.
Timestamp: Date and time the MLAG session was started, deleted, updated, or marked dead (device went down).
Vxlan Anycast: Anycast IP address used for VXLAN termination.
All Alarms tab
Displays all MLAG events network-wide. By default, the event list is sorted by time, with the most recent events listed first. The tab provides the following additional data about each event:
Message: Text description of a MLAG-related event. Example: Clag conflicted bond changed from swp7 swp8 to swp9 swp10.
Source: Hostname of network device that generated the event.
Severity: Importance of the event. Values include critical, warning, info, and debug.
Type: Network protocol or service generating the event. This always has a value of clag in this card workflow.
Table Actions
Select, export, or filter the list. Refer to Table Settings.
MLAG Session Card
This card displays performance and status information for a single MLAG session. Card is opened from the full-screen Network Services|All MLAG Sessions card.
The small MLAG Session card displays:
Item
Description
Indicates data is for a single session of a Network Service or Protocol.
Title
CLAG Session.
Device identifiers (hostname, IP address, or MAC address) for host and peer in session.
,
Indication of host role, primary or secondary .
The medium MLAG Session card displays:
Item
Description
Time period (in header)
Range of time in which the displayed data was collected; applies to all card sizes.
Indicates data is for a single session of a Network Service or Protocol.
Title
Network Services | MLAG Session.
Device identifiers (hostname, IP address, or MAC address) for host and peer in session. Arrow points from the host to the peer. Click to open associated device card.
,
Indication of host role, primary or secondary .
Time period (above chart)
Range of time for data displayed in peer status chart.
Peer Status chart
Distribution of peer availability, alive or not alive, during the designated time period. The number of time segments in a time period varies according to the length of the time period.
Role
Role that host device is playing. Values include primary and secondary.
CLAG sysmac
System MAC address of the MLAG session.
Peer Role
Role that peer device is playing. Values include primary and secondary.
Peer State
Operational state of the peer, up (true) or down (false).
The large MLAG Session card contains two tabs.
The Session Summary tab displays:
Item
Description
Time period
Range of time in which the displayed data was collected; applies to all card sizes.
Indicates data is for a single session of a Network Service or Protocol.
Device identifiers (hostname, IP address, or MAC address) for host and peer in session. Arrow points from the host to the peer. Click to open associated device card.
,
Indication of host role, primary or secondary .
Alarm Count Chart
Distribution and count of CLAG alarm events over the given time period.
Info Count Chart
Distribution and count of CLAG info events over the given time period.
Peer Status chart
Distribution of peer availability, alive or not alive, during the designated time period. The number of time segments in a time period varies according to the length of the time period.
Backup IP
IP address of the interface to use if the peerlink (or bond) goes down.
Backup IP Active
Indicates whether the backup IP address is configured.
CLAG SysMAC
System MAC address of the MLAG session.
Peer State
Operational state of the peer, up (true) or down (false).
Count of Dual Bonds
Number of bonds connecting to both switches.
Count of Single Bonds
Number of bonds connecting to only one switch.
Count of Protocol Down Bonds
Number of bonds with interfaces that were brought down by the clagd service.
Count of Conflicted Bonds
Number of bonds which have a set of interfaces that are not the same on both switches.
The Configuration File Evolution tab displays:
Item
Description
Time period
Range of time in which the displayed data was collected; applies to all card sizes.
Indicates configuration file information for a single session of a Network Service or Protocol.
Device identifiers (hostname, IP address, or MAC address) for host and peer in session. Arrow points from the host to the peer. Click to open associated device card.
,
Indication of host role, primary or secondary .
Timestamps
When changes to the configuration file have occurred, the date and time are indicated. Click the time to see the changed file.
Configuration File
When File is selected, the configuration file as it was at the selected time is shown.
When Diff is selected, the configuration file at the selected time is shown on the left and the configuration file at the previous timestamp is shown on the right. Differences are highlighted.
The full screen MLAG Session card provides tabs for all MLAG sessions
and all events.
Item
Description
Title
Network Services | MLAG
Closes full screen card and returns to workbench
Time period
Range of time in which the displayed data was collected; applies to all card sizes; select an alternate time period by clicking
Displays data refresh status. Click to pause data refresh. Click to resume data refresh. Current refresh rate is visible by hovering over icon.
Results
Number of results found for the selected tab
All MLAG Sessions tab
Displays all MLAG sessions for the given session. By default, the session list is sorted by hostname. This tab provides the following additional data about each session:
Backup Ip: IP address of the interface to use if the peerlink (or bond) goes down.
Backup Ip Active: Indicates whether the backup IP address has been specified and is active (true) or not (false).
Bonds
Conflicted: Identifies the set of interfaces in a bond that do not match on each end of the bond.
Single: Identifies a set of interfaces connecting to only one of the two switches.
Dual: Identifies a set of interfaces connecting to both switches.
Proto Down: Interface on the switch brought down by the clagd service. Value is blank if no interfaces are down due to clagd service.
Mlag Sysmac: Unique MAC address for each bond interface pair. Note: Must be a value between 44:38:39:ff:00:00 and 44:38:39:ff:ff:ff.
Peer:
If: Name of the peer interface.
Role: Role of the peer device. Values include primary and secondary.
State: Indicates if peer device is up (true) or down (false).
Role: Role of the host device. Values include primary and secondary.
Timestamp: Date and time the MLAG session was started, deleted, updated, or marked dead (device went down).
Vxlan Anycast: Anycast IP address used for VXLAN termination.
All Events tab
Displays all events network-wide. By default, the event list is sorted by time, with the most recent events listed first. The tab provides the following additional data about each event:
Message: Text description of an event. Example: Clag conflicted bond changed from swp7 swp8 to swp9 swp10.
Source: Hostname of network device that generated the event.
Severity: Importance of the event. Values include critical, warning, info, and debug.
Type: Network protocol or service generating the event. This always has a value of clag in this card workflow.
Table Actions
Select, export, or filter the list. Refer to Table Settings.
All OSPF Sessions Card
This card displays performance and status information for all OSPF sessions across all nodes in your network.
The small OSPF Service card displays:
Item
Description
Indicates data is for all sessions of a Network Service or Protocol
Title
OSPF: All OSPF Sessions, or the OSPF Service
Total number of switches and hosts with the OSPF service enabled during the designated time period
Total number of OSPF-related alarms received during the designated time period
Chart
Distribution of OSPF-related alarms received during the designated time period
The medium OSPF Service card displays:
Item
Description
Time period
Range of time in which the displayed data was collected; applies to all card sizes.
Indicates data is for all sessions of a Network Service or Protocol.
Title
Network Services | All OSPF Sessions.
Total number of switches and hosts with the OSPF service enabled during the designated time period.
Total number of OSPF-related alarms received during the designated time period.
Total Nodes Running chart
Distribution of switches and hosts with the OSPF service enabled during the designated time period, and a total number of nodes running the service currently.
Note: The node count here might be different than the count in the summary bar. For example, the number of nodes running OSPF last week or last month might be more or less than the number of nodes running OSPF currently.
Total Sessions Not Established chart
Distribution of unestablished OSPF sessions during the designated time period, and the total number of unestablished sessions in the network currently.
Note: The node count here might be different than the count in the summary bar. For example, the number of unestablished session last week or last month might be more of less than the number of nodes with unestablished sessions currently.
Total Sessions chart
Distribution of OSPF sessions during the designated time period, and the total number of sessions running on the network currently.
The large OSPF service card contains two tabs.
The Sessions Summary tab displays:
Item
Description
Time period
Range of time in which the displayed data was collected; applies to all card sizes.
Indicates data is for all sessions of a Network Service or Protocol.
Title
Sessions Summary (visible when you hover over card).
Total number of switches and hosts with the OSPF service enabled during the designated time period.
Total number of OSPF-related alarms received during the designated time period.
Total Nodes Running chart
Distribution of switches and hosts with the OSPF service enabled during the designated time period, and a total number of nodes running the service currently.
Note: The node count here might be different than the count in the summary bar. For example, the number of nodes running OSPF last week or last month might be more or less than the number of nodes running OSPF currently.
Total Sessions chart
Distribution of OSPF sessions during the designated time period, and the total number of sessions running on the network currently.
Total Sessions Not Established chart
Distribution of unestablished OSPF sessions during the designated time period, and the total number of unestablished sessions in the network currently.
Note: The node count here might be different than the count in the summary bar. For example, the number of unestablished session last week or last month might be more of less than the number of nodes with unestablished sessions currently.
Table/Filter options
When the Switches with Most Sessions filter option is selected, the table displays the switches and hosts running OSPF sessions in decreasing order of session count-devices with the largest number of sessions are listed first
When the Switches with Most Unestablished Sessions filter option is selected, the table switches and hosts running OSPF sessions in decreasing order of unestablished sessions-devices with the largest number of unestablished sessions are listed first
Show All Sessions
Link to view data for all OSPF sessions in the full screen card.
The Alarms tab displays:
Item
Description
Time period
Range of time in which the displayed data was collected; applies to all card sizes.
(in header)
Indicates data is all alarms for all OSPF sessions.
Title
Alarms (visible when you hover over card).
Total number of switches and hosts with the OSPF service enabled during the designated time period.
(in summary bar)
Total number of OSPF-related alarms received during the designated time period.
Total Alarms chart
Distribution of OSPF-related alarms received during the designated time period, and the total number of current OSPF-related alarms in the network.
Note: The alarm count here might be different than the count in the summary bar. For example, the number of new alarms received in this time period does not take into account alarms that have already been received and are still active. You might have no new alarms, but still have a total number of alarms present on the network of 10.
Table/Filter options
When the selected filter option is Switches with Most Alarms, the table displays switches and hosts running OSPF in decreasing order of the count of alarms-devices with the largest number of OSPF alarms are listed first
Show All Sessions
Link to view data for all OSPF sessions in the full screen card.
The full screen OSPF Service card provides tabs for all switches, all sessions, and all alarms.
Item
Description
Title
Network Services | OSPF.
Closes full screen card and returns to workbench.
Time period
Range of time in which the displayed data was collected; applies to all card sizes; select an alternate time period by clicking .
Displays data refresh status. Click to pause data refresh. Click to resume data refresh. Current refresh rate is visible by hovering over icon.
Results
Number of results found for the selected tab
All Switches tab
Displays all switches and hosts running the OSPF service. By default, the device list is sorted by hostname. This tab provides the following additional data about each device:
Agent
State: Indicates communication state of the NetQ Agent on a given device. Values include Fresh (heard from recently) and Rotten (not heard from recently).
Version: Software version number of the NetQ Agent on a given device. This should match the version number of the NetQ software loaded on your server or appliance; for example, 2.1.0.
ASIC
Core BW: Maximum sustained/rated bandwidth. Example values include 2.0 T and 720 G.
Model: Chip family. Example values include Tomahawk, Trident, and Spectrum.
Model Id: Identifier of networking ASIC model. Example values include BCM56960 and BCM56854.
Ports: Indicates port configuration of the switch. Example values include 32 x 100G-QSFP28, 48 x 10G-SFP+, and 6 x 40G-QSFP+.
Vendor: Manufacturer of the chip. Example values include Broadcom and Mellanox.
CPU
Arch: Microprocessor architecture type. Values include x86_64 (Intel), ARMv7 (AMD), and PowerPC.
Max Freq: Highest rated frequency for CPU. Example values include 2.40 GHz and 1.74 GHz.
Model: Chip family. Example values include Intel Atom C2538 and Intel Atom C2338.
Nos: Number of cores. Example values include 2, 4, and 8.
Disk Total Size: Total amount of storage space in physical disks (not total available). Example values: 10 GB, 20 GB, 30 GB.
Memory Size: Total amount of local RAM. Example values include 8192 MB and 2048 MB.
OS
Vendor: Operating System manufacturer. Values include Cumulus Networks, RedHat, Ubuntu, and CentOS.
Version: Software version number of the OS. Example values include 3.7.3, 2.5.x, 16.04, 7.1.
Version Id: Identifier of the OS version. For Cumulus, this is the same as the Version (3.7.x).
Platform
Date: Date and time the platform was manufactured. Example values include 7/12/18 and 10/29/2015.
MAC: System MAC address. Example value: 17:01:AB:EE:C3:F5.
Model: Manufacturer's model name. Examples values include AS7712-32X and S4048-ON.
Number: Manufacturer part number. Examples values include FP3ZZ7632014A, 0J09D3.
Revision: Release version of the platform.
Series: Manufacturer serial number. Example values include D2060B2F044919GD000060, CN046MRJCES0085E0004.
Vendor: Manufacturer of the platform. Example values include Cumulus Express, Dell, EdgeCore, Lenovo, Mellanox.
Time: Date and time the data was collected from device.
All Sessions tab
Displays all OSPF sessions networkwide. By default, the session list is sorted by hostname. This tab provides the following additional data about each session:
Area: Routing domain for this host device. Example values include 0.0.0.1, 0.0.0.23.
Ifname: Name of the interface on host device where session resides. Example values include swp5, peerlink-1.
Is IPv6: Indicates whether the address of the host device is IPv6 (true) or IPv4 (false).
Peer
Address: IPv4 or IPv6 address of the peer device.
Hostname: User-defined name for peer device.
ID: Network subnet address of router with access to the peer device.
State: Current state of OSPF. Values include Full, 2-way, Attempt, Down, Exchange, Exstart, Init, and Loading.
Timestamp: Date and time session was started, deleted, updated or marked dead (device is down)
All Alarms tab
Displays all OSPF events networkwide. By default, the event list is sorted by time, with the most recent events listed first. The tab provides the following additional data about each event:
Message: Text description of a OSPF-related event. Example: swp4 area ID mismatch with peer leaf02
Source: Hostname of network device that generated the event
Severity: Importance of the event. Values include critical, warning, info, and debug.
Type: Network protocol or service generating the event. This always has a value of OSPF in this card workflow.
Table Actions
Select, export, or filter the list. Refer to Table Settings.
OSPF Session Card
This card displays performance and status information for a single OSPF session. Card is opened from the full-screen Network Services|All OSPF Sessions card.
The small OSPF Session card displays:
Item
Description
Indicates data is for a single session of a Network Service or Protocol.
Title
OSPF Session.
Hostnames of the two devices in a session. Host appears on top with peer below.
,
Current state of OSPF. Full or 2-way, Attempt, Down, Exchange, Exstart, Init, and Loading.
The medium OSPF Session card displays:
Item
Description
Time period
Range of time in which the displayed data was collected; applies to all card sizes.
Indicates data is for a single session of a Network Service or Protocol.
Title
Network Services | OSPF Session.
Hostnames of the two devices in a session. Host appears on top with peer below.
,
Current state of OSPF. Full or 2-way, Attempt, Down, Exchange, Exstart, Init, and Loading.
Time period for chart
Time period for the chart data.
Session State Changes Chart
Heat map of the state of the given session over the given time period. The status is sampled at a rate consistent with the time period. For example, for a 24 hour period, a status is collected every hour. Refer to Granularity of Data Shown Based on Time Period.
Ifname
Interface name on or hostname for host device where session resides.
Peer Address
IP address of the peer device.
Peer ID
IP address of router with access to the peer device.
The large OSPF Session card contains two tabs.
The Session Summary tab displays:
Item
Description
Time period
Range of time in which the displayed data was collected; applies to all card sizes.
Indicates data is for a single session of a Network Service or Protocol.
Hostnames of the two devices in a session. Arrow points in the direction of the session.
Current state of OSPF. Full or 2-way, Attempt, Down, Exchange, Exstart, Init, and Loading.
Session State Changes Chart
Heat map of the state of the given session over the given time period. The status is sampled at a rate consistent with the time period. For example, for a 24 hour period, a status is collected every hour. Refer to Granularity of Data Shown Based on Time Period.
Alarm Count Chart
Distribution and count of OSPF alarm events over the given time period.
Info Count Chart
Distribution and count of OSPF info events over the given time period.
Ifname
Name of the interface on the host device where the session resides.
State
Current state of OSPF. Full or 2-way, Attempt, Down, Exchange, Exstart, Init, and Loading.
Is Unnumbered
Indicates if the session is part of an unnumbered OSPF configuration (true) or part of a numbered OSPF configuration (false).
Nbr Count
Number of routers in the OSPF configuration.
Is Passive
Indicates if the host is in a passive state (true) or active state (false).
Peer ID
IP address of router with access to the peer device.
Is IPv6
Indicates if the IP address of the host device is IPv6 (true) or IPv4 (false).
If Up
Indicates if the interface on the host is up (true) or down (false).
Nbr Adj Count
Number of adjacent routers for this host.
MTU
Maximum transmission unit (MTU) on shortest path between the host and peer.
Peer Address
IP address of the peer device.
Area
Routing domain of the host device.
Network Type
Architectural design of the network. Values include Point-to-Point and Broadcast.
Cost
Shortest path through the network between the host and peer devices.
Dead Time
Countdown timer, starting at 40 seconds, that is constantly reset as messages are heard from the neighbor. If the dead time gets to zero, the neighbor is presumed dead, the adjacency is torn down, and the link removed from SPF calculations in the OSPF database.
The Configuration File Evolution tab displays:
Item
Description
Time period
Range of time in which the displayed data was collected; applies to all card sizes.
Indicates configuration file information for a single session of a Network Service or Protocol.
Device identifiers (hostname, IP address, or MAC address) for host and peer in session. Arrow points from the host to the peer. Click to open associated device card.
,
Current state of OSPF. Full or 2-way, Attempt, Down, Exchange, Exstart, Init, and Loading.
Timestamps
When changes to the configuration file have occurred, the date and time are indicated. Click the time to see the changed file.
Configuration File
When File is selected, the configuration file as it was at the selected time is shown.
When Diff is selected, the configuration file at the selected time is shown on the left and the configuration file at the previous timestamp is shown on the right. Differences are highlighted.
The full screen OSPF Session card provides tabs for all OSPF sessions
and all events.
Item
Description
Title
Network Services | OSPF.
Closes full screen card and returns to workbench.
Time period
Range of time in which the displayed data was collected; applies to all card sizes; select an alternate time period by clicking .
Displays data refresh status. Click to pause data refresh. Click to resume data refresh. Current refresh rate is visible by hovering over icon.
Results
Number of results found for the selected tab.
All OSPF Sessions tab
Displays all OSPF sessions running on the host device. The session list is sorted by hostname by default. This tab provides the following additional data about each session:
Area: Routing domain for this host device. Example values include 0.0.0.1, 0.0.0.23.
Ifname: Name of the interface on host device where session resides. Example values include swp5, peerlink-1.
Is IPv6: Indicates whether the address of the host device is IPv6 (true) or IPv4 (false).
Peer
Address: IPv4 or IPv6 address of the peer device.
Hostname: User-defined name for peer device.
ID: Network subnet address of router with access to the peer device.
State: Current state of OSPF. Values include Full, 2-way, Attempt, Down, Exchange, Exstart, Init, and Loading.
Timestamp: Date and time session was started, deleted, updated or marked dead (device is down).
All Events tab
Displays all events network-wide. By default, the event list is sorted by time, with the most recent events listed first. The tab provides the following additional data about each event:
Message: Text description of a OSPF-related event. Example: OSPF session with peer tor-1 swp7 vrf default state changed from failed to Established.
Source: Hostname of network device that generated the event.
Severity: Importance of the event. Values include critical, warning, info, and debug.
Type: Network protocol or service generating the event. This always has a value of OSPF in this card workflow.
Table Actions
Select, export, or filter the list. Refer to Table Settings.
Switch Card
Viewing detail about a particular switch is essential when troubleshooting performance issues. With NetQ you can view the overall performance and drill down to view attributes of the switch, interface performance and the events associated with a switch. This is accomplished through the Switches card.
Switch cards can be added to user-created workbenches. Click to open a switch card.
The small Switch card displays:
Item
Description
Indicates data is for a single switch.
title
Hostname of switch.
Chart
Distribution of switch alarms during the designated time period.
Trend
Trend of alarm count, represented by an arrow:
Pointing upward and green: alarm count is higher than the last two time periods, an increasing trend.
Pointing downward and bright pink: alarm count is lower than the last two time periods, a decreasing trend.
No arrow: alarm count is unchanged over the last two time periods, trend is steady.
Count
Current count of alarms on the switch.
Rating
Overall performance of the switch. Determined by the count of alarms relative to the average count of alarms during the designated time period:
Low: Count of alarms is below the average count; a nominal count.
Med: Count of alarms is in range of the average count; some room for improvement.
High: Count of alarms is above the average count; user intervention recommended.
The medium Switch card displays:
Item
Description
Indicates data is for a single switch.
title
Hostname of switch.
Alarms
When selected, displays distribution and count of alarms by alarm category, generated by this switch during the designated time period.
Charts
When selected, displays distribution of alarms by alarm category, during the designated time period.
The large Switch card contains four tabs:
The Attributes tab displays:
Item
Description
Indicates data is for a single switch.
title
<Hostname> | Attributes.
Hostname
User-defined name for this switch.
Management IP
IPv4 or IPv6 address used for management of this switch.
Management MAC
MAC address used for management of this switch.
Agent State
Operational state of the NetQ Agent on this switch; Fresh or Rotten.
Platform Vendor
Manufacturer of this switch box. Cumulus Networks is identified as the vendor for a switch in the Cumulus in the Cloud (CITC) environment, as seen here.
Platform Model
Manufacturer model of this switch. VX is identified as the model for a switch in CITC environment, as seen here.
ASIC Vendor
Manufacturer of the ASIC installed on the motherboard.
ASIC Model
Manufacturer model of the ASIC installed on the motherboard.
OS
Operating system running on the switch. CL indicates Cumulus Linux is installed.
OS Version
Version of the OS running on the switch.
NetQ Agent Version
Version of the NetQ Agent running on the switch.
Total Interfaces
Total number of interfaces on this switch, and the number of those that are up and down.
The Utilization tab displays:
Item
Description
Indicates utilization data is for a single switch.
Title
<Hostname> | Utilization.
Performance
Displays distribution of CPU and memory usage during the designated time period.
Disk Utilization
Displays distribution of disk usage during the designated time period.
The Interfaces tab displays:
Item
Description
Indicates interface statistics for a single switch.
Title
<Hostname> | Interface Stats.
Interface List
List of interfaces present during the designated time period.
Interface Filter
Sorts interface list by Name, Rx Util (receive utilization), or Tx Util (transmit utilization).
Interfaces Count
Number of interfaces present during the designated time period.
Interface Statistics
Distribution and current value of various transmit and receive statistics associated with a selected interface:
Broadcast: Number of broadcast packets
Bytes: Number of bytes per second
Drop: Number of dropped packets
Errs: Number of errors
Frame: Number of frames received
Multicast: Number of multicast packets
Packets: Number of packets per second
Utilization: Bandwidth utilization as a percentage of total available bandwidth
The Digital Optics tab displays:
Item
Description
Indicates digital optics metrics for a single switch.
Title
<Hostname> | Digital Optics.
Interface List
List of interfaces present during the designated time period.
Search
Search for an interface by Name.
Interfaces Count
Number of interfaces present during the designated time period.
Digital Optics Statistics
Use the parameter dropdown to change the chart view to see metrics for Laser RX Power, Laser Output Power, Laser Bias Current, Module Temperature, and Module Voltage.
The full screen Switch card provides multiple tabs.
Item
Description
Title
<hostname>
Closes full screen card and returns to workbench.
Default Time
Displayed data is current as of this moment.
Displays data refresh status. Click to pause data refresh. Click to resume data refresh. Current refresh rate is visible by hovering over icon.
Results
Number of results found for the selected tab.
Alarms
Displays all known critical alarms for the switch. This tab provides the following additional data about each address:
Hostname: User-defined name of the switch
Message: Description of alarm
Message Type: Indicates the protocol or service which generated the alarm
Severity: Indicates the level of importance of the event; it is always critical for NetQ alarms
Time: Date and time the data was collected
All Interfaces
Displays all known interfaces on the switch. This tab provides the following additional data about each interface:
Details: Information about the interface, such as MTU, table number, members, protocols running, VLANs
Hostname: Hostname of the given event
IfName: Name of the interface
Last Changed: Data and time that the interface was last enabled, updated, deleted, or changed state to down
OpId: Process identifier; for internal use only
State: Indicates if the interface is up or down
Time: Date and time the data was collected
Type: Kind of interface; for example, VRF, switch port, loopback, ethernet
VRF: Name of the associated virtual route forwarding (VRF) interface if deployed
MAC Addresses
Displays all known MAC addresses for the switch. This tab provides the following additional data about each MAC address:
Egress Port: Importance of the event-critical, warning, info, or debug
Hostname: User-defined name of the switch
Last Changed: Data and time that the address was last updated or deleted
MAC Address: MAC address of switch
Origin: Indicates whether this switch owns this address (true) or if another switch owns this address (false)
Remote: Indicates whether this address is reachable via a VXLAN on another switch (true) or is reachable locally on the switch (false)
Time: Date and time the data was collected
VLAN Id: Identifier of an associated VLAN if deployed
VLANs
Displays all configured VLANs on the switch. This tab provides the following additional data about each VLAN:
Hostname: User-defined name of the switch
IfName: Name of the interface
Last Changed: Data and time that the VLAN was last updated or deleted
Ports: Ports used by the VLAN
SVI: Indicates whether is the VLAN has a switch virtual interface (yes) or not (no)
Time: Date and time the data was collected
VLANs: Name of the VLAN
IP Routes
Displays all known IP routes for the switch. This tab provides the following additional data about each route:
Hostname: User-defined name of the switch
Is IPv6: Indicates whether the route is based on an IPv6 address (true) or an IPv4 address (false)
Message Type: Service type; always route
NextHops: List of hops in the route
Origin: Indicates whether the route is owned by this switch (true) or not (false)
Prefix: Prefix for the address
Priority: Indicates the importance of the route; higher priority is used before lower priority
Route Type: Kind of route, where the type is dependent on the protocol
RT Table Id: Identifier of the routing table that contains this route
Source: Address of source switch; *None* if this switch is the source
Time: Date and time the data was collected
VRF: Name of the virtual route forwarding (VRF) interface if used by the route
IP Neighbors
Displays all known IP neighbors of the switch. This tab provides the following additional data about each neighbor:
Hostname: User-defined name of the switch
IfIndex: Index of the interface
IfName: Name of the interface
IP Address: IP address of the neighbor
Is IPv6: Indicates whether the address is an IPv6 address (true) or an IPv4 address (false)
Is Remote: Indicates whether this address is reachable via a VXLAN on another switch (true) or is reachable locally on the switch (false)
MAC Address: MAC address of neighbor
Message Type: Service type; always neighbor
OpId: Process identifier; for internal use only
Time: Date and time the data was collected
VRF: Name of the virtual route forwarding (VRF) interface if deployed
IP Addresses
Displays all known IP addresses for the switch. This tab provides the following additional data about each address:
Hostname: User-defined name of the switch
IfName: Name of the interface
Is IPv6: Indicates whether the address is an IPv6 address (true) or an IPv4 address (false)
Mask: Mask for the address
Prefix: Prefix for the address
Time: Date and time the data was collected
VRF: Name of the virtual route forwarding (VRF) interface if deployed
BTRFS Utilization
Displays disk utilization information for devices running Cumulus Linux 3.x and the b-tree file system (BTRFS):
Device Allocated: Percentage of the disk space allocated by BTRFS
Hostname: Hostname of the given device
Largest Chunk Size: Largest remaining chunk size on disk
Last Changed: Data and time that the storage allocation was last updated
Rebalance Recommended: Based on rules described in [When to Rebalance BTRFS Partitions](https://docs.nvidia.com/networking-ethernet-software/knowledge-base/Configuration-and-Usage/Storage/When-to-Rebalance-BTRFS-Partitions/), a rebalance is suggested
Unallocated Space: Amount of space remaining on the disk
Unused Data Chunks Space: Amount of available data chunk space
Installed Packages
Displays all known interfaces on the switch. This tab provides the following additional data about each package:
CL Version: Version of Cumulus Linux associated with the package
Hostname: Hostname of the given event
Last Changed: Data and time that the interface was last enabled, updated, deleted, or changed state to down
Package Name: Name of the package
Package Status: Indicates if the package is installed
Version: Version of the package
SSD Utilization
Displays overall health and utilization of a 3ME3 solid state drive (SSD). This tab provides the following data about each drive:
Hostname: Hostname of the device with the 3ME3 drive installed
Last Changed: Data and time that the SSD information was updated
SSD Model: SSD model name
Total PE Cycles Supported: PE cycle rating for the drive
Current PE Cycles Executed: Number of PE cycle run to date
% Remaining PE Cycles: Number of PE cycle available before drive needs to be replaced
Forwarding Resources
Displays usage statistics for all forwarding resources on the switch. This tab provides the following additional data about each resource:
ECMP Next Hops: Maximum number of hops seen in forwarding table, number used, and the percentage of this usage versus the maximum number
Hostname: Hostname where forwarding resources reside
IPv4 Host Entries: Maximum number of hosts in forwarding table, number of hosts used, and the percentage of usage versus the maximum
IPv4 Route Entries: Maximum number of routes in forwarding table, number of routes used, and the percentage of usage versus the maximum
IPv6 Host Entries: Maximum number of hosts in forwarding table, number of hosts used, and the percentage of usage versus the maximum
IPv6 Route Entries: Maximum number of routes in forwarding table, number of routes used, and the percentage of usage versus the maximum
MAC Entries: Maximum number of MAC addresses in forwarding table, number of MAC addresses used, and the percentage of usage versus the maximum
MCAST Route: Maximum number of multicast routes in forwarding table, number of multicast routes used, and the percentage of usage versus the maximum
Time: Date and time the data was collected
Total Routes: Maximum number of total routes in forwarding table, number of total routes used, and the percentage of usage versus the maximum
ACL Resources
Displays usage statistics for all ACLs on the switch. The following is diplayed for each ACL:
Maximum entries in the ACL
Number entries used
Percentage of this usage versus the maximum
This tab also provides the following additional data about each ACL:
Hostname: Hostname where the ACLs reside
Time: Date and time the data was collected
What Just Happened
Displays displays events based on conditions detected in the data plane on the switch. Refer to What Just Happened for descriptions of the fields in this table.
Sensors
Displays all known sensors on the switch. This tab provides a table for each type of sensor. Select the sensor type using the filter above the table.
Fan:
Hostname: Hostname where the fan sensor resides
Message Type: Type of sensor; always Fan
Description: Text identifying the sensor
Speed (RPM): Revolutions per minute of the fan
Max: Maximum speed of the fan measured by sensor
Min: Minimum speed of the fan measured by sensor
Message: Description
Sensor Name: User-defined name for the fan sensor
Previous State: Operational state of the fan sensor before last update
State: Current operational state of the fan sensor
Time: Date and time the data was collected
Temperature:
Hostname: Hostname where the temperature sensor resides
Message Type: Type of sensor; always Temp
Critical: Maximum temperature (°C) threshold for the sensor
Description: Text identifying the sensor
Lower Critical: Minimum temperature (°C) threshold for the sensor
Max: Maximum temperature measured by sensor
Min: Minimum temperature measured by sensor
Message: Description
Sensor Name: User-defined name for the temperature sensor
Previous State: State of the sensor before last update
State: Current state of the temperature sensor
Temperature: Current temperature measured at sensor
Time: Date and time the data was collected
Power Supply Unit (PSU):
Hostname: Hostname where the temperature sensor resides
Message Type: Type of sensor; always PSU
PIn: Input power (W) measured by sensor
POut: Output power (W) measured by sensor
Sensor Name: User-defined name for the power supply unit sensor
Previous State: State of the sensor before last update
State: Current state of the temperature sensor
Time: Date and time the data was collected
VIn: Input voltage (V) measured by sensor
VOut: Output voltage (V) measured by sensor
Digital Optics
Displays all available digital optics performance metrics. This tab provides a table for each of five metrics.
Hostname: Hostname where the digital optics module resides
Timestamp: Date and time the data was collected
IfName: Name of the port where the digital optics module resides
Units: Unit of measure that applies to the given metric
Value: Measured value during the designated time period
High Warning Threshold: Value used to generate a warning if the measured value excedes it.
Low Warning Threshold: Value used to generate a warning if the measured value drops below it.
High Alarm Threshold: Value used to generate an alarm if the measured value excedes it.
Low Alarm Threshold: Value used to generate an alarm if the measured value drops below it.
Table Actions
Select, export, or filter the list. Refer to Table Settings.
Trace Cards
There are three cards used to perform on-demand and scheduled traces—one for the creation of on-demand and scheduled traces and two for the results. Trace cards can be added to user-created workbenches.
Trace Request Card
This card is used to create new on-demand or scheduled trace requests or to run a scheduled trace on demand.
The small Trace Request card displays:
Item
Description
Indicates a trace request
Select Trace list
Select a scheduled trace request from the list
Go
Click to start the trace now
The medium Trace Request card displays:
Item
Description
Indicates a trace request.
Title
New Trace Request.
New Trace Request
Create a new layer 2 or layer 3 (no VRF) trace request.
Source
(Required) Hostname or IP address of device where to begin the trace.
Destination
(Required) Ending point for the trace. For layer 2 traces, value must be a MAC address. For layer 3 traces, value must be an IP address.
VLAN ID
Numeric identifier of a VLAN. Required for layer 2 trace requests.
Run Now
Start the trace now.
The large Trace Request card displays:
Item
Description
Indicates a trace request.
Title
New Trace Request.
Trace selection
Leave New Trace Request selected to create a new request, or choose a scheduled request from the list.
Source
(Required) Hostname or IP address of device where to begin the trace.
Destination
(Required) Ending point for the trace. For layer 2 traces, value must be a MAC address. For layer 3 traces, value must be an IP address.
VRF
Optional for layer 3 traces. Virtual Route Forwarding interface to be used as part of the trace path.
VLAN ID
Required for layer 2 traces. Virtual LAN to be used as part of the trace path.
Schedule
Sets the frequency with which to run a new trace (Run every) and when to start the trace for the first time (Starting).
Run Now
Start the trace now.
Update
Update is available when a scheduled trace request is selected from the dropdown list and you make a change to its configuration. Clicking Update saves the changes to the existing scheduled trace.
Save As New
Save As New is available in two instances:
When you enter a source, destination, and schedule for a new trace. Clicking Save As New in this instance saves the new scheduled trace.
When changes are made to a selected scheduled trace request. Clicking Save As New in this instance saves the modified scheduled trace without changing the original trace on which it was based.
The full screen Trace Request card displays:
Item
Description
Title
Trace Request.
Closes full screen card and returns to workbench.
Time period
Range of time in which the displayed data was collected; applies to all card sizes; select an alternate time period by clicking .
Results
Number of results found for the selected tab.
Schedule Preview tab
Displays all scheduled trace requests for the given user. By default, the listing is sorted by Start Time, with the most recently started traces listed at the top. The tab provides the following additional data about each event:
Action: Indicates latest action taken on the trace job. Values include Add, Deleted, Update.
Frequency: How often the trace is scheduled to run
Active: Indicates if trace is actively running (true), or stopped from running (false)
ID: Internal system identifier for the trace job
Trace Name: User-defined name for a trace
Trace Params: Indicates source and destination, optional VLAN or VRF specified, and whether to alert on failure
Table Actions
Select, export, or filter the list. Refer to Table Settings.
On-demand Trace Results Card
This card is used to view the results of on-demand trace requests.
The small On-demand Trace Results card
displays:
Item
Description
Indicates an on-demand trace result.
Source and destination of the trace, identified by their address or hostname. Source is listed on top with arrow pointing to destination.
,
Indicates success or failure of the trace request. A successful result implies all paths were successful without any warnings or failures. A failure result implies there was at least one path with warnings or errors.
The medium On-demand Trace Results card displays:
Item
Description
Indicates an on-demand trace result.
Title
On-demand Trace Result.
Source and destination of the trace, identified by their address or hostname. Source is listed on top with arrow pointing to destination.
,
Indicates success or failure of the trace request. A successful result implies all paths were successful without any warnings or failures. A failure result implies there was at least one path with warnings or errors.
Total Paths Found
Number of paths found between the two devices.
MTU Overall
Average size of the maximum transmission unit for all paths.
Minimum Hops
Smallest number of hops along a path between the devices.
Maximum Hops
Largest number of hops along a path between the devices.
The large On-demand Trace Results card contains two tabs.
The On-demand Trace Result tab displays:
Item
Description
Indicates an on-demand trace result.
Title
On-demand Trace Result.
,
Indicates success or failure of the trace request. A successful result implies all paths were successful without any warnings or failures. A failure result implies there was at least one path with warnings or errors.
Source and destination of the trace, identified by their address or hostname. Source is listed on top with arrow pointing to destination.
Distribution by Hops chart
Displays the distributions of various hop counts for the available paths.
Distribution by MTU chart
Displays the distribution of MTUs used on the interfaces used in the available paths.
Table
Provides detailed path information, sorted by the route identifier, including:
Route ID: Identifier of each path
MTU: Average speed of the interfaces used
Hops: Number of hops to get from the source to the destination device
Warnings: Number of warnings encountered during the trace on a given path
Errors: Number of errors encountered during the trace on a given path
Total Paths Found
Number of paths found between the two devices.
MTU Overall
Average size of the maximum transmission unit for all paths.
Minimum Hops
Smallest number of hops along a path between the devices.
The On-demand Trace Settings tab displays:
Item
Description
Indicates an on-demand trace setting
Title
On-demand Trace Settings
Source
Starting point for the trace
Destination
Ending point for the trace
Schedule
Does not apply to on-demand traces
VRF
Associated virtual route forwarding interface, when used with layer 3 traces
VLAN
Associated virtual local area network, when used with layer 2 traces
Job ID
Identifier of the job; used internally
Re-run Trace
Clicking this button runs the trace again
The full screen On-demand Trace Results card displays:
Item
Description
Title
On-demand Trace Results
Closes full screen card and returns to workbench
Time period
Range of time in which the displayed data was collected; applies to all card sizes; select an alternate time period by clicking
Results
Number of results found for the selected tab
Trace Results tab
Provides detailed path information, sorted by the Resolution Time (date and time results completed), including:
SCR.IP: Source IP address
DST.IP: Destination IP address
Max Hop Count: Largest number of hops along a path between the devices
Min Hop Count: Smallest number of hops along a path between the devices
Total Paths: Number of paths found between the two devices
PMTU: Average size of the maximum transmission unit for all interfaces along the paths
Errors: Message provided for analysis when a trace fails
Table Actions
Select, export, or filter the list. Refer to Table Settings
Scheduled Trace Results Card
This card is used to view the results of scheduled trace requests.
The small Scheduled Trace Results card displays:
Item
Description
Indicates a scheduled trace result.
Source and destination of the trace, identified by their address or hostname. Source is listed on left with arrow pointing to destination.
Results
Summary of trace results: a successful result implies all paths were successful without any warnings or failures; a failure result implies there was at least one path with warnings or errors.
Number of trace runs completed in the designated time period
Number of runs with warnings
Number of runs with errors
The medium Scheduled Trace Results card displays:
Item
Description
Time period
Range of time in which the displayed data was collected; applies to all card sizes.
Indicates a scheduled trace result.
Title
Scheduled Trace Result.
Summary
Name of scheduled validation and summary of trace results: a successful result implies all paths were successful without any warnings or failures; a failure result implies there was at least one path with warnings or errors.
Number of trace runs completed in the designated time period
Number of runs with warnings
Number of runs with errors
Charts
Heat map: A time segmented view of the results. For each time segment, the color represents the percentage of warning and failed results. Refer to Granularity of Data Shown Based on Time Period for details on how to interpret the results.
Unique Bad Nodes: Distribution of unique nodes that generated the indicated warnings and/or failures.
The large Scheduled Trace Results card contains two tabs:
The Results tab displays:
Item
Description
Time period
Range of time in which the displayed data was collected; applies to all card sizes.
Indicates a scheduled trace result.
Title
Scheduled Trace Result.
Summary
Name of scheduled validation and summary of trace results: a successful result implies all paths were successful without any warnings or failures; a failure result implies there was at least one path with warnings or errors.
Number of trace runs completed in the designated time period
Number of runs with warnings
Number of runs with errors
Charts
Heat map: A time segmented view of the results. For each time segment, the color represents the percentage of warning and failed results. Refer to Granularity of Data Shown Based on Time Period for details on how to interpret the results.
Small charts: Display counts for each item during the same time period, for the purpose of correlating with the warnings and errors shown in the heat map.
Table/Filter options
When the Failures filter option is selected, the table displays the failure messages received for each run.
When the Paths filter option is selected, the table displays all of the paths tried during each run.
When the Warning filter option is selected, the table displays the warning messages received for each run.
The Configuration tab displays:
Item
Description
Time period
Range of time in which the displayed data was collected; applies to all card sizes.
Address or hostname of the device where the trace was started.
Destination
Address of the device where the trace was stopped.
Schedule
The frequency and starting date and time to run the trace.
VRF
Virtual Route Forwarding interface, when defined.
VLAN
Virtual LAN identifier, when defined.
Name
User-defined name of the scheduled trace.
Run Now
Start the trace now.
Edit
Modify the trace. Opens Trace Request card with this information pre-populated.
The full screen Scheduled Trace Results card displays:
Item
Description
Title
Scheduled Trace Results
Closes full screen card and returns to workbench.
Time period
Range of time in which the displayed data was collected; applies to all card sizes; select an alternate time period by clicking .
Results
Number of results found for the selected tab.
Scheduled Trace Results tab
Displays the basic information about the trace, including:
Resolution Time: Time that trace was run
SRC.IP: IP address of the source device
DST.IP: Address of the destination device
Max Hop Count: Maximum number of hops across all paths between the devices
Min Hop Count: Minimum number of hops across all paths between the devices
Total Paths: Number of available paths found between the devices
PMTU: Average of the maximum transmission units for all paths
Errors: Message provided for analysis if trace fails
Click on a result to open a detailed view of the results.
Table Actions
Select, export, or filter the list. Refer to Table Settings.
Validation Cards
There are three cards used to perform on-demand and scheduled validations—one for the creation of on-demand and scheduled validations and two for the results. Validation cards can be added to user-created workbenches.
Validation Request Card
This card is used to create a new on-demand or scheduled validation request or run a scheduled validation on demand.
The small Validation Request card displays:
Item
Description
Indicates a validation request.
Validation
Select a scheduled request to run that request on-demand. A default validation is provided for each supported network protocol and service, which runs a network-wide validation check. These validations run every 60 minutes, but you can run them on-demand at any time.
Note: No new requests can be configured from this size card.
GO
Start the validation request. The corresponding On-demand Validation Result cards are opened on your workbench, one per protocol and service.
The medium Validation Request card displays:
Item
Description
Indicates a validation request.
Title
Validation Request.
Validation
Select a scheduled request to run that request on-demand. A default validation is provided for each supported network protocol and service, which runs a network-wide validation check. These validations run every 60 minutes, but you can run them on-demand at any time.
Note: No new requests can be configured from this size card.
Protocols
The protocols included in a selected validation request are listed here.
The large Validation Request card displays:
Item
Description
Indicates a validation request.
Title
Validation Request.
Validation
Depending on user intent, this field is used to:
Select a scheduled request to run that request on-demand. A default validation is provided for each supported network protocol and service, which runs a network-wide validation check. These validations run every 60 minutes, but you can run them on-demand at any time.
Leave as is to create a new scheduled validation request.
Select a scheduled request to modify.
Protocols
For a selected scheduled validation, the protocols included in a validation request are listed here. For new on-demand or scheduled validations, click these to include them in the validation.
Schedule
For a selected scheduled validation, the schedule and the time of the last run are displayed. For new scheduled validations, select the frequency and starting date and time.
Run Every: Select how often to run the request. Choose from 30 minutes, 1, 3, 6, or 12 hours, or 1 day.
Starting: Select the date and time to start the first request in the series.
Last Run: Timestamp of when the selected validation was started.
Scheduled Validations
Count of scheduled validations that are currently scheduled compared to the maximum of 15 allowed.
Run Now
Start the validation request.
Update
When changes are made to a selected validation request, Update becomes available so that you can save your changes.
Be aware, that if you update a previously saved validation request, the historical data collected will no longer match the data results of future runs of the request. If your intention is to leave this request unchanged and create a new request, click Save As New instead.
Save As New
When changes are made to a previously saved validation request, Save As New becomes available so that you can save the modified request as a new request.
The full screen Validation Request card displays all scheduled
validation requests.
Item
Description
Title
Validation Request.
Closes full screen card and returns to workbench.
Default Time
No time period is displayed for this card as each validation request has its own time relationship.
Displays data refresh status. Click to pause data refresh. Click to resume data refresh. Current refresh rate is visible by hovering over icon.
Results
Number of results found for the selected tab.
Validation Requests
Displays all scheduled validation requests. By default, the requests list is sorted by the date and time that it was originally created (Created At). This tab provides the following additional data about each request:
Name: Text identifier of the validation.
Type: Name of network protocols and/or services included in the validation.
Start Time: Data and time that the validation request was run.
Last Modified: Date and time of the most recent change made to the validation request.
Cadence (Min): How often, in minutes, the validation is scheduled to run. This is empty for new on-demand requests.
Is Active: Indicates whether the request is currently running according to its schedule (true) or it is not running (false).
Table Actions
Select, export, or filter the list. Refer to Table Settings.
On-Demand Validation Result Card
This card is used to view the results of on-demand validation requests.
The small Validation Result card displays:
Item
Description
Indicates an on-demand validation result.
Title
On-demand Result <Network Protocol or Service Name> Validation.
Timestamp
Date and time the validation was completed.
,
Status of the validation job, where:
Good: Job ran successfully. One or more warnings might have occurred during the run.
Failed: Job encountered errors which prevented the job from completing, or job ran successfully, but errors occurred during the run.
The medium Validation Result card displays:
Item
Description
Indicates an on-demand validation result.
Title
On-demand Validation Result | <Network Protocol or Service Name>.
Timestamp
Date and time the validation was completed.
, ,
Status of the validation job, where:
Good: Job ran successfully.
Warning: Job encountered issues, but it did complete its run.
Failed: Job encountered errors which prevented the job from completing.
Devices Tested
Chart with the total number of devices included in the validation and the distribution of the results.
Pass: Number of devices tested that had successful results.
Warn: Number of devices tested that had successful results, but also had at least one warning event.
Fail: Number of devices tested that had one or more protocol or service failures.
Hover over chart to view the number of devices and the percentage of all tested devices for each result category.
Sessions Tested
For BGP, chart with total number of BGP sessions included in the validation and the distribution of the overall results.
For EVPN, chart with total number of BGP sessions included in the validation and the distribution of the overall results.
For Interfaces, chart with total number of ports included in the validation and the distribution of the overall results.
In each of these charts:
Pass: Number of sessions or ports tested that had successful results.
Warn: Number of sessions or ports tested that had successful results, but also had at least one warning event.
Fail: Number of sessions or ports tested that had one or more failure events.
Hover over chart to view the number of devices, sessions, or ports and the percentage of all tested devices, sessions, or ports for each result category.
This chart does not apply to other Network Protocols and Services, and thus is not displayed for those cards.
Open <Service> Card
Click to open the corresponding medium Network Services card, where available.
The large Validation Result card contains two tabs.
The Summary tab displays:
Item
Description
Indicates an on-demand validation result.
Title
On-demand Validation Result | Summary | <Network Protocol or Service Name>.
Date
Day and time when the validation completed.
, ,
Status of the validation job, where:
Good: Job ran successfully.
Warning: Job encountered issues, but it did complete its run.
Failed: Job encountered errors which prevented the job from completing.
Devices Tested
Chart with the total number of devices included in the validation and the distribution of the results.
Pass: Number of devices tested that had successful results.
Warn: Number of devices tested that had successful results, but also had at least one warning event.
Fail: Number of devices tested that had one or more protocol or service failures.
Hover over chart to view the number of devices and the percentage of all tested devices for each result category.
Sessions Tested
For BGP, chart with total number of BGP sessions included in the validation and the distribution of the overall results.
For EVPN, chart with total number of BGP sessions included in the validation and the distribution of the overall results.
For Interfaces, chart with total number of ports included in the validation and the distribution of the overall results.
For OSPF, chart with total number of OSPF sessions included in the validation and the distribution of the overall results.
In each of these charts:
Pass: Number of sessions or ports tested that had successful results.
Warn: Number of sessions or ports tested that had successful results, but also had at least one warning event.
Fail: Number of sessions or ports tested that had one or more failure events.
Hover over chart to view the number of devices, sessions, or ports and the percentage of all tested devices, sessions, or ports for each result category.
This chart does not apply to other Network Protocols and Services, and thus is not displayed for those cards.
Open <Service> Card
Click to open the corresponding medium Network Services card, when available.
Table/Filter options
When the Most Active filter option is selected, the table displays switches and hosts running the given service or protocol in decreasing order of alarm counts. Devices with the largest number of warnings and failures are listed first. You can click on the device name to open its switch card on your workbench.
When the Most Recent filter option is selected, the table displays switches and hosts running the given service or protocol sorted by timestamp, with the device with the most recent warning or failure listed first. The table provides the following additional information:
Hostname: User-defined name for switch or host.
Message Type: Network protocol or service which triggered the event.
Message: Short description of the event.
Severity: Indication of importance of event; values in decreasing severity include critical, warning, error, info, debug.
Show All Results
Click to open the full screen card with all on-demand validation results sorted by timestamp.
The Configuration tab displays:
Item
Description
Indicates an on-demand validation request configuration.
Title
On-demand Validation Result | Configuration | <Network Protocol or Service Name>.
Validations
List of network protocols or services included in the request that produced these results.
Schedule
Not relevant to on-demand validation results. Value is always N/A.
The full screen Validation Result card provides a tab for all on-demand validation results.
Item
Description
Title
Validation Results | On-demand.
Closes full screen card and returns to workbench.
Time period
Range of time in which the displayed data was collected; applies to all card sizes; select an alternate time period by clicking
Displays data refresh status. Click to pause data refresh. Click to resume data refresh. Current refresh rate is visible by hovering over icon.
Results
Number of results found for the selected tab.
On-demand Validation Result | <network protocol or service>
Displays all unscheduled validation results. By default, the results list is sorted by Timestamp. This tab provides the following additional data about each result:
Job ID: Internal identifier of the validation job that produced the given results
Timestamp: Date and time the validation completed
Type: Network protocol or service type
Total Node Count: Total number of nodes running the given network protocol or service
Checked Node Count: Number of nodes on which the validation ran
Failed Node Count: Number of checked nodes that had protocol or service failures
Rotten Node Count: Number of nodes that could not be reached during the validation
Unknown Node Count: Applies only to the Interfaces service. Number of nodes with unknown port states.
Failed Adjacent Count: Number of adjacent nodes that had protocol or service failures
Total Session Count: Total number of sessions running for the given network protocol or service
Failed Session Count: Number of sessions that had session failures
Table Actions
Select, export, or filter the list. Refer to Table Settings.
Scheduled Validation Result Card
This card is used to view the results of scheduled validation requests.
The small Scheduled Validation Result card displays:
Item
Description
Indicates a scheduled validation result.
Title
Scheduled Result <Network Protocol or Service Name> Validation.
Results
Summary of validation results:
Number of validation runs completed in the designated time period.
Number of runs with warnings.
Number of runs with errors.
,
Status of the validation job, where:
Pass: Job ran successfully. One or more warnings might have occurred during the run.
Failed: Job encountered errors which prevented the job from completing, or job ran successfully, but errors occurred during the run.
The medium Scheduled Validation Result card displays:
Item
Description
Time period
Range of time in which the displayed data was collected; applies to all card sizes.
Indicates a scheduled validation result.
Title
Scheduled Validation Result | <Network Protocol or Service Name>.
Summary
Summary of validation results:
Name of scheduled validation.
Status of the validation job, where:
Pass: Job ran successfully. One or more warnings might have occurred during the run.
Failed: Job encountered errors which prevented the job from completing, or job ran successfully, but errors occurred during the run.
Chart
Validation results, where:
Time period: Range of time in which the data on the heat map was collected.
Heat map: A time segmented view of the results. For each time segment, the color represents the percentage of warning, passing, and failed results. Refer to NetQ UI Card Reference for details on how to interpret the results.
Open <Service> Card
Click to open the corresponding medium Network Services card, when available.
The large Scheduled Validation Result card contains two tabs.
The Summary tab displays:
Item
Description
Indicates a scheduled validation result.
Title
Validation Summary (Scheduled Validation Result | <Network Protocol or Service Name>).
Summary
Summary of validation results:
Name of scheduled validation.
Status of the validation job, where:
Pass: Job ran successfully. One or more warnings might have occurred during the run.
Failed: Job encountered errors which prevented the job from completing, or job ran successfully, but errors occurred during the run.
Expand/Collapse: Expand the heat map to full width of card, collapse the heat map to the left.
Chart
Validation results, where:
Time period: Range of time in which the data on the heat map was collected.
Heat map: A time segmented view of the results. For each time segment, the color represents the percentage of warning, passing, and failed results. Refer to NetQ UI Card Reference for details on how to interpret the results.
Open <Service> Card
Click to open the corresponding medium Network Services card, when available.
Table/Filter options
When the Most Active filter option is selected, the table displays switches and hosts running the given service or protocol in decreasing order of alarm counts-devices with the largest number of warnings and failures are listed first.
When the Most Recent filter option is selected, the table displays switches and hosts running the given service or protocol sorted by timestamp, with the device with the most recent warning or failure listed first. The table provides the following additional information:
Hostname: User-defined name for switch or host.
Message Type: Network protocol or service which triggered the event.
Message: Short description of the event.
Severity: Indication of importance of event; values in decreasing severity include critical, warning, error, info, debug.
Show All Results
Click to open the full screen card with all scheduled validation results sorted by timestamp.
The Configuration tab displays:
Item
Description
Indicates a scheduled validation configuration
Title
Configuration (Scheduled Validation Result | <Network Protocol or Service Name>)
Name
User-defined name for this scheduled validation
Validations
List of validations included in the validation request that created this result
Schedule
User-defined schedule for the validation request that created this result
Open Schedule Card
Opens the large Validation Request card for editing this configuration
The full screen Scheduled Validation Result card provides tabs for all scheduled
validation results for the service.
Item
Description
Title
Scheduled Validation Results | <Network Protocol or Service>.
Closes full screen card and returns to workbench.
Time period
Range of time in which the displayed data was collected; applies to all card sizes; select an alternate time period by clicking .
Displays data refresh status. Click to pause data refresh. Click to resume data refresh. Current refresh rate is visible by hovering over icon.
Results
Number of results found for the selected tab.
Scheduled Validation Result | <network protocol or service>
Displays all unscheduled validation results. By default, the results list is sorted by timestamp. This tab provides the following additional data about each result:
Job ID: Internal identifier of the validation job that produced the given results
Timestamp: Date and time the validation completed
Type: Protocol of Service Name
Total Node Count: Total number of nodes running the given network protocol or service
Checked Node Count: Number of nodes on which the validation ran
Failed Node Count: Number of checked nodes that had protocol or service failures
Rotten Node Count: Number of nodes that could not be reached during the validation
Unknown Node Count: Applies only to the Interfaces service. Number of nodes with unknown port states.
Failed Adjacent Count: Number of adjacent nodes that had protocol or service failures
Total Session Count: Total number of sessions running for the given network protocol or service
Failed Session Count: Number of sessions that had session failures
Table Actions
Select, export, or filter the list. Refer to Table Settings.
Integrate NetQ API with Your Applications
The NetQ API provides access to key telemetry and system monitoring data gathered about the performance and operation of your network and devices so that you can view that data in your internal or third-party analytic tools. The API gives you access to the health of individual switches, network protocols and services, trace and validation results, and views of networkwide inventory and events.
This guide provides an overview of the NetQ API framework, the basics of using Swagger UI 2.0 or bash plus curl to view and test the APIs. Descriptions of each endpoint and model parameter are in individual API JSON files.
For information regarding new features, improvements, bug fixes, and known issues present in this NetQ release, refer to the release notes.
Inventory and Devices: Address, Inventory, MAC Address tables, Node, Sensors
Events: Events
Each endpoint has its own API. You can make requests for all data and all devices or you can filter the request by a given hostname. Each API returns a predetermined set of data as defined in the API models.
The Swagger interface displays both public and internal APIs. Public APIs do not have internal in their name. Internal APIs are not supported for public use and subject to change without notice.
Get Started
You can access the API gateway and execute requests from the Swagger UI or a terminal interface.
The API is embedded in the NetQ software, making it easy to access from the Swagger UI application.
Select auth from the Select a definition dropdown at the top right of the window. This opens the authorization API.
Open a terminal window.
Continue to Log In instructions.
Log In
While you can view the API endpoints without authorization, you can only execute the API endpoints if you have been authorized.
You must first obtain an access key and then use that key to authorize your access to the API.
Click POST/login.
Click Try it out.
Enter the username and password you used to install NetQ. For this release, the default is username admin and password admin. Do not change the access-key value.
Click Execute.
Scroll down to view the Responses. In the Server response section, in the Response body of the 200 code response, copy the access token in the top line.
Click Authorize.
Paste the access key into the Value field, and click Authorize.
Click Close.
To log in and obtain authorization:
Open a terminal window.
Login to obtain the access token. You will need the following information:
Hostname or IP address, and port (443 for Cloud deployments, 32708 for on-premises deployments) of your API gateway
Your login credentials that were provided as part of the NetQ installation process. For this release, the default is username admin and password admin.
This example uses an IP address of 192.168.0.10, port of 443, and the default credentials:
The output provides the access token as the first parameter.
{"access_token":"eyJhbGciOiJIUzI1NiIsInR5cCI6IkpXVCJ9....","customer_id":0,"expires_at":1597200346504,"id":"admin","is_cloud":true,"premises":[{"name":"OPID0","namespace":"NAN","opid":0},{"name":"ea-demo-dc-1","namespace":"ea1","opid":30000},{"name":"ea-demo-dc-2","namespace":"ea1","opid":30001},{"name":"ea-demo-dc-3","namespace":"ea1","opid":30002},{"name":"ea-demo-dc-4","namespace":"ea1","opid":30003},{"name":"ea-demo-dc-5","namespace":"ea1","opid":30004},{"name":"ea-demo-dc-6","namespace":"ea1","opid":30005},{"name":"ea-demo-dc-7","namespace":"ea1","opid":80006},{"name":"Cumulus Data Center","namespace":"NAN","opid":1568962206}],"reset_password":false,"terms_of_use_accepted":true}
Copy the access token to a text file for use in making API data requests.
You are now able to create and execute API requests against the endpoints.
By default, authorization is valid for 24 hours, after which users must sign in again and reauthorize their account.
API Requests
You can use either the Swagger UI or a terminal window with bash and curl commands to create and execute API requests.
API requests are easy to execute in the Swagger UI. Just select the endpoint of interest and try it out.
Select the endpoint from the definition dropdown at the top right of the application.
This example shows the BGP endpoint selected:
Select the endpoint object.
This example shows the results of selecting the GET bgp object:
A description is provided for each object and the various parameters that can be specified. In the Responses section, you can see the data that is returned when the request is successful.
Click Try it out.
Enter values for the required parameters.
Click Execute.
In a terminal window, use bash plus curl to execute requests. Each request contains an API method (GET, POST, etc.), the address and API endpoint object to query, a variety of headers, and sometimes a body. For example, in the log in step above:
API method = POST
Address and API object = “https://<netq.domain>:443/netq/auth/v1/login”
Headers = -H “accept: application/json” and -H “Content-Type: application/json”
Body = -d “{ "username": "admin", "password": "admin", "access_key": "string"}”
API Responses
A NetQ API response is comprised of a status code, any relevant error codes (if unsuccessful), and the collected data (if successful).
The following HTTP status codes might be presented in the API responses:
Code
Name
Description
Action
200
Success
Request was successfully processed.
Review response.
400
Bad Request
Invalid input was detected in request.
Check the syntax of your request and make sure it matches the schema.
401
Unauthorized
Authentication has failed or credentials were not provided.
Provide or verify your credentials, or request access from your administrator.
403
Forbidden
Request was valid, but user might not have the needed permissions.
Verify your credentials or request an account from your administrator.
404
Not Found
Requested resource could not be found.
Try the request again after a period of time or verify status of resource.
409
Conflict
Request cannot be processed due to conflict in current state of the resource.
Verify status of resource and remove conflict.
500
Internal Server Error
Unexpected condition has occurred.
Perform general troubleshooting and try the request again.
503
Service Unavailable
The service being requested is currently unavailable.
Verify the status of the NetQ Platform or Appliance, and the associated service.
Example Requests and Responses
Some command requests and their responses are shown here, but feel free to run your own requests. To run a request, you will need your authorization token. When using the curl commands, the responses have been piped through a python tool to make them more readable. You can choose to do so as well.
Validate Networkwide Status of the BGP Service
Make your request to the bgp endpoint to obtain validate the operation of the BGP service on all nodes running the service.
Open the check endpoint.
Open the check object.
Click Try it out.
Enter values for time, duration, by, and proto parameters.
In this example, time=1597256560, duration=24, by=scheduled, and proto=bgp.
Click Execute, then scroll down to see the results under Server response.
Run the following curl command, entering values for the various parameters. In this example, time=1597256560, duration=24 (hours), by=scheduled, and proto=bgp.
Make your request to the interfaces endpoint to view the status of all interfaces. By specifying the eq-timestamp option and entering a date and time in epoch format, you indicate the data for that time (versus in the last hour by default), as follows:
The following table covers some basic terms used throughout the NetQ
user documentation.
Term
Definition
Agent
NetQ software that resides on a host server that provides metrics about the host to the NetQ Telemetry Server for network health analysis.
Alarm
In UI, event with critical severity.
Bridge
Device that connects two communication networks or network segments. Occurs at OSI Model Layer 2, Data Link Layer.
Clos
Multistage circuit switching network used by the telecommunications industry, first formalized by Charles Clos in 1952.
Device
UI term referring to a switch, host, or chassis or combination of these. Typically used when describing hardware and components versus a software or network topology. See also Node.
Event
Change or occurrence in network or component; possibly triggering a notification. In the NetQ UI, there are two types of events: Alarms which indicate a critical severity event, and Info which indicate warning, informational, and debugging severity events.
Fabric
Network topology where a set of network nodes interconnects through one or more network switches.
Fresh
Node that has been silent for the last 90 seconds.
High Availability
Software used to provide a high percentage of uptime (running and available) for network devices.
Host
A device connected to a TCP/IP network. It can run one or more virtual machines.
Hypervisor
Software which creates and runs virtual machines. Also called a virtual machine monitor.
Info
In UI, event with warning, informational, or debugging severity.
IP Address
An Internet Protocol address comprises a series of numbers assigned to a network device to uniquely identify it on a given network. Version 4 addresses are 32 bits and written in dotted decimal notation with 8-bit binary numbers separated by decimal points. Example: 10.10.10.255. Version 6 addresses are 128 bits and written in 16-bit hexadecimal numbers separated by colons. Example: 2018:3468:1B5F::6482:D673.
Leaf
An access layer switch in a Spine-Leaf or Clos topology. An Exit-Leaf is switch that connects to services outside of the Data Center such as firewalls, load balancers, and Internet routers. See also Spine, Clos, Top of Rack and Access Switch.
Linux
Set of free and open-source software operating systems built around the Linux kernel. Cumulus Linux is one available distribution packages.
Node
UI term referring to a switch, host or chassis in a topology.
Notification
Item that informs a user of an event. In UI there are two types of notifications: Alert which is a notification sent by system to inform a user about an event; specifically received through a third-party application, and Message which is a notification sent by a user to share content with another user.
Peer link
Link, or bonded links, used to connect two switches in an MLAG pair.
Rotten
Node that has been silent for 90 seconds or more.
Router
Device that forwards data packets (directs traffic) from nodes on one communication network to nodes on another network. Occurs at the OSI Model Layer 3, Network Layer.
Spine
Used to describe the role of a switch in a Spine-Leaf or Clos topology. See also Aggregation switch, End of Row switch, and distribution switch.
Switch
High-speed device that connects that receives data packets from one device or node and redirects them to other devices or nodes on a network.
Telemetry server
NetQ server which receives metrics and other data from NetQ agents on leaf and spine switches and hosts.
Top of Rack
Switch that connects to the network (versus internally); also known as a ToR switch.
Virtual Machine
Emulation of a computer system that provides all the functions of a particular architecture.
Web-scale
A network architecture designed to deliver capabilities of large cloud service providers within an enterprise IT environment.
Whitebox
Generic, off-the-shelf, switch or router hardware used in Software Defined Networks (SDN).
Common Cumulus Linux and NetQ Acronyms
The following table covers some common acronyms used throughout the NetQ
user documentation.
Beyond knowing what physical components are in the deployment, it is valuable to know that their configurations are correct and they operate correctly. NetQ enables you to confirm that peer connections are present, discover any misconfigured ports, peers, or unsupported modules, and monitor for link flaps.
NetQ checks peer connections using LLDP. For DACs and AOCs, NetQ determines the peers using their serial numbers in the port EEPROMs, even if the link is not UP.
Confirm Peer Connections
You can validate peer connections for all devices in your network or for a specific device or port. This example shows the peer hosts and their status for leaf03 switch.
cumulus@switch:~$ netq leaf03 show interfaces physical peer
Matching cables records:
Hostname Interface Peer Hostname Peer Interface State Message
----------------- ------------------------- ----------------- ------------------------- ---------- -----------------------------------
leaf03 swp1 oob-mgmt-switch swp7 up
leaf03 swp2 down Peer port unknown
leaf03 swp47 leaf04 swp47 up
leaf03 swp48 leaf04 swp48 up
leaf03 swp49 leaf04 swp49 up
leaf03 swp50 leaf04 swp50 up
leaf03 swp51 exit01 swp51 up
leaf03 swp52 down Port cage empty
This example shows the peer data for a specific interface port.
cumulus@switch:~$ netq leaf01 show interfaces physical swp47
Matching cables records:
Hostname Interface Peer Hostname Peer Interface State Message
----------------- ------------------------- ----------------- ------------------------- ---------- -----------------------------------
leaf01 swp47 leaf02 swp47 up
Discover Misconfigurations
You can verify that the following configurations are the same on both sides of a peer interface:
Admin state
Operational state
Link speed
Auto-negotiation setting
You use the netq check interfaces command to determine if any of the interfaces have any continuity errors. This command only checks the physical interfaces; it does not check bridges, bonds or other software constructs. You can check all interfaces at one time. It enables you to compare the current status of the interfaces, as well as their status at an earlier point in time. The command syntax is:
netq check interfaces [around <text-time>] [json]
If NetQ cannot determine a peer for a given device, the port shows as unverified.
If you find a misconfiguration, use the netq show interfaces physical command for clues about the cause.
Find Mismatched Operational States
This example checks every interface for misconfiguration and you can find that one interface port has an error. Look for clues about the cause and see that the operational states do not match on the connection between leaf 03 and leaf04: leaf03 is up, but leaf04 is down. If the misconfiguration was due to a mismatch in the administrative state, the message would have been Admin state mismatch (up, down) or Admin state mismatch (down, up).
This example uses the and keyword to check the connections between two peers. You can see an error, so you check the physical peer information and discover that someone specified an incorrect peer. After fixing it, run the check again, and see that there are no longer any interface errors.
This example checks for configuration mismatches and finds a link speed mismatch on server03. The link speed on swp49 is 40G and the peer port swp50 shows as unspecified.
This example checks for configuration mismatches and finds auto-negotiation setting mismatches between the servers and leafs. Auto-negotiation is off for the leafs, but on for the servers.