Configure and Monitor What Just Happened
What Just Happened (WJH) streams detailed and contextual telemetry data for analysis. This provides real-time visibility into problems in the network, such as hardware packet drops due to buffer congestion, incorrect routing, and ACL or layer 1 problems.
Using WJH in combination with NetQ helps you identify losses anywhere in the fabric. From a single management console you can:
- View any current or historic drop information, including the reason for the drop
- Identify problematic flows or endpoints, and pinpoint where communication is failing in the network
For a list of supported WJH events, refer to the WJH Events Reference.
To use a gNMI client to export WJH data to a collector, refer to Collect WJH Data with gNMI.
By default, Cumulus Linux 4.4.0 and later includes the NetQ Agent and CLI. Depending on the version of Cumulus Linux running on your NVIDIA switch, you might need to upgrade the NetQ Agent and CLI to the latest release:
nvidia@<hostname>:~$ sudo apt-get update
nvidia@<hostname>:~$ sudo apt-get install -y netq-agent
nvidia@<hostname>:~$ sudo netq config restart agent
nvidia@<hostname>:~$ sudo apt-get install -y netq-apps
nvidia@<hostname>:~$ sudo netq config restart cli
Configure What Just Happened
WJH is enabled by default on NVIDIA Spectrum switches running Cumulus Linux 4.4.0 or later. Before WJH can collect data, you must enable the NetQ Agent on your switches and servers.
To enable WJH on any switch or server:
Configure the NetQ Agent on the switch:
nvidia@switch:~$ sudo netq config add agent wjhRestart the NetQ Agent to begin collecting WJH data:
nvidia@switch:~$ sudo netq config restart agent
When you finish viewing WJH metrics, you can stop the NetQ Agent from collecting WJH data to reduce network traffic. Use netq config del agent wjh followed by netq config restart agent to disable WJH on a given switch.
View What Just Happened Metrics
WJH metrics are available on the WJH and Events cards. To view the metrics on the Events card, open the large card and select the WJH tab at the top of the card. For a more detailed view, open the WJH card. You can create, save, and apply filters to show a subset of events from either the Events or WJH cards.
To add the WJH card to your workbench, navigate to the header and select ![]() Add card > Events > What Just Happened > Open cards
Add card > Events > What Just Happened > Open cards
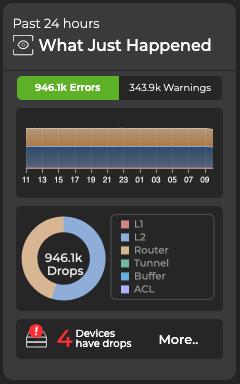
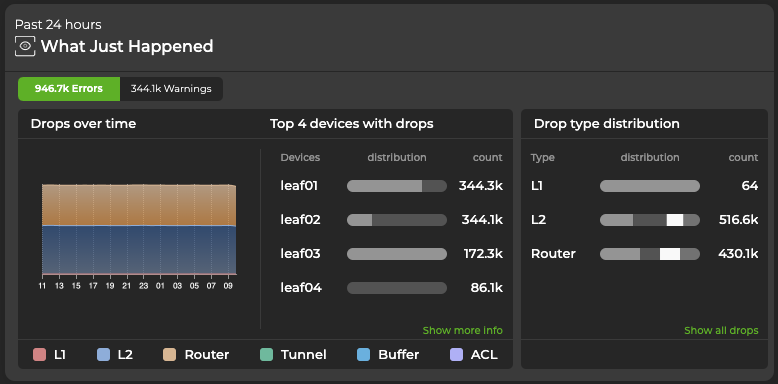
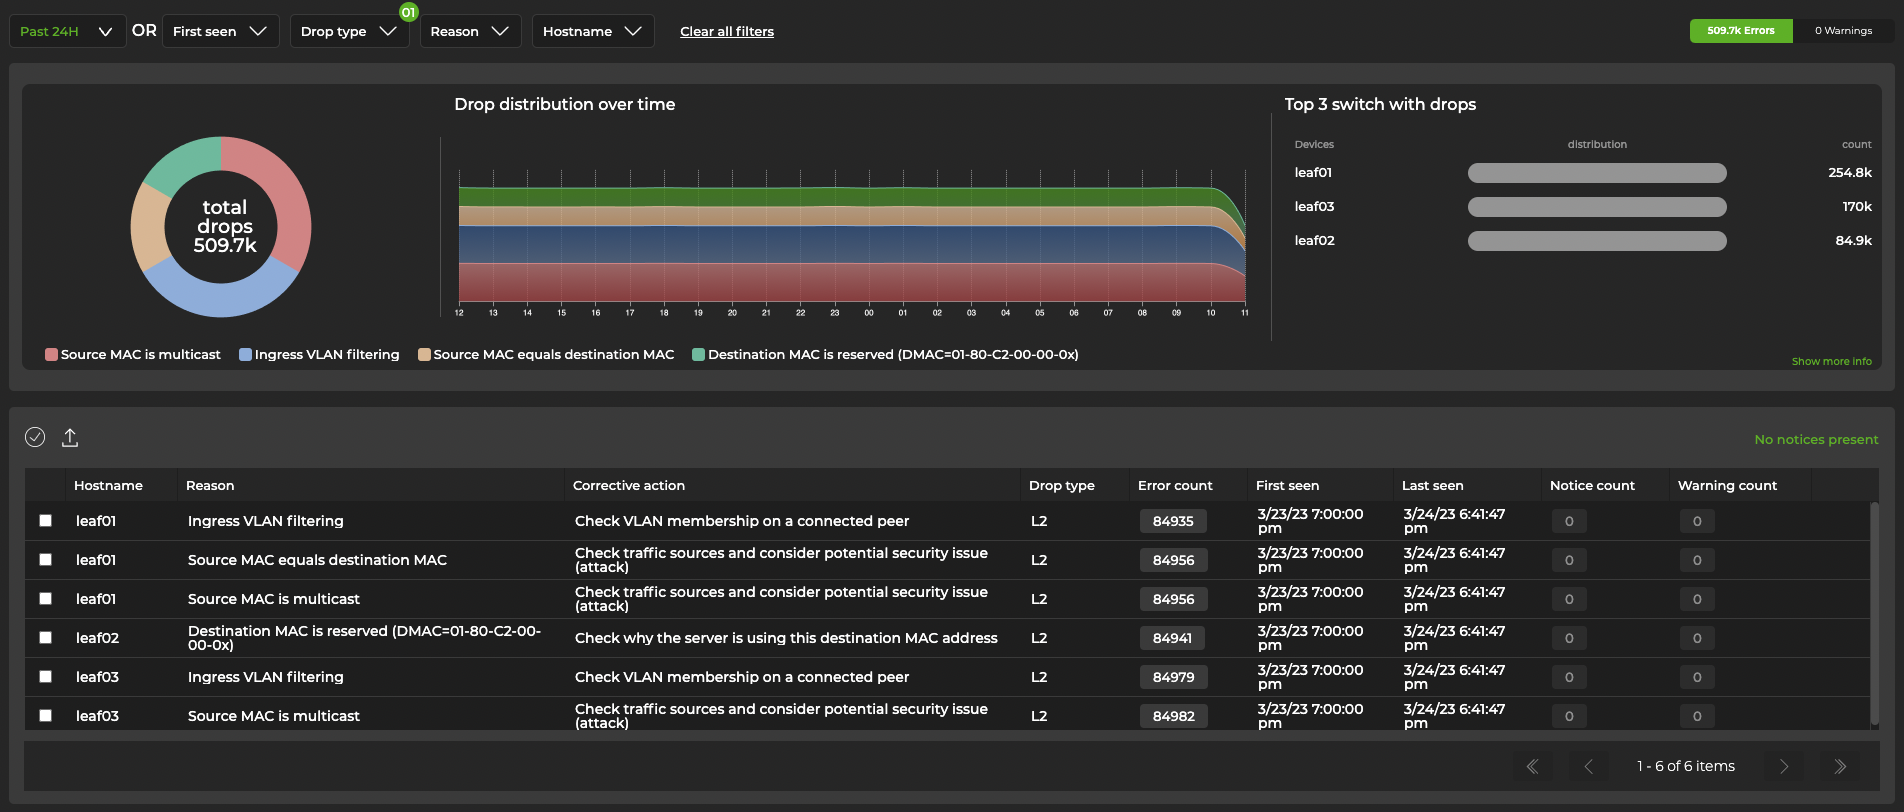
You can expand the card to see a detailed summary of WJH data, including devices with the most drops, the number of drops, their distribution, and a timeline:
Expand the card to its largest size to open the WJH dashboard.
The table beneath the charts displays WJH events and recommendations for resolving them. Hover over the color-coded chart to view WJH event categories:
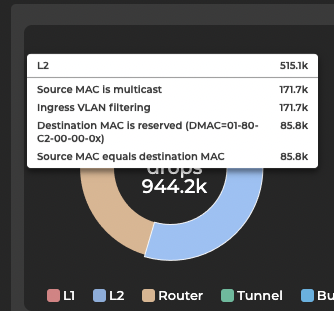
Click on a category in the chart for a detailed view:
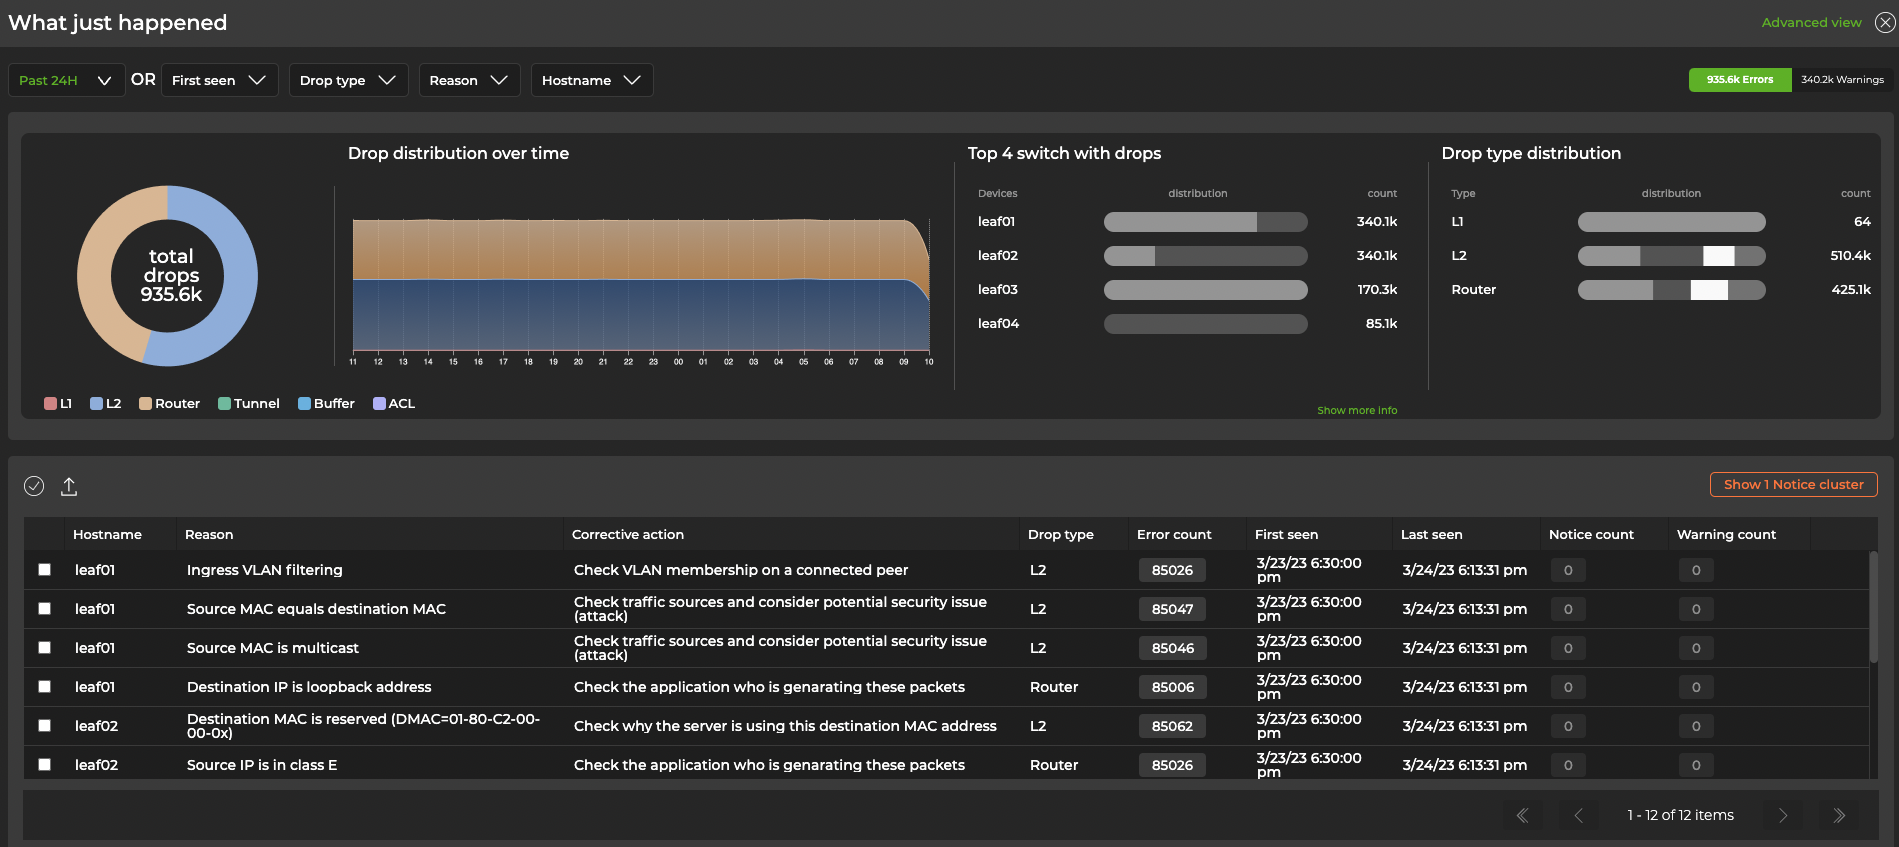
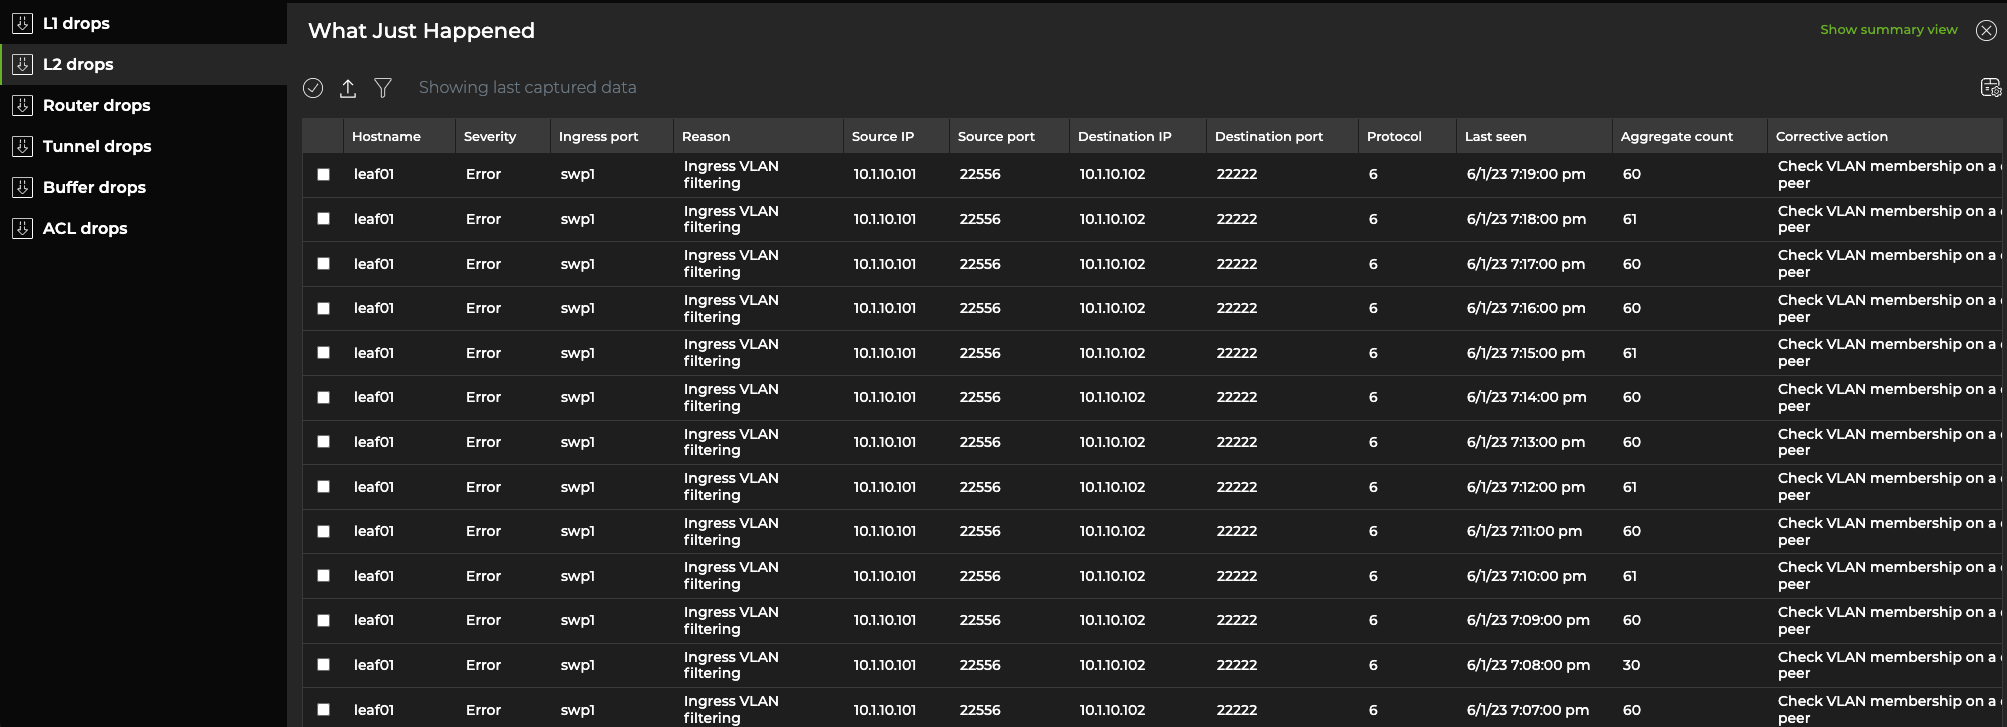
Select Advanced view in the top-right corner for a tabular display of drops that can be sorted by drop type. This display includes additional information, such as source and destination IP addresses, ports, and MACs.
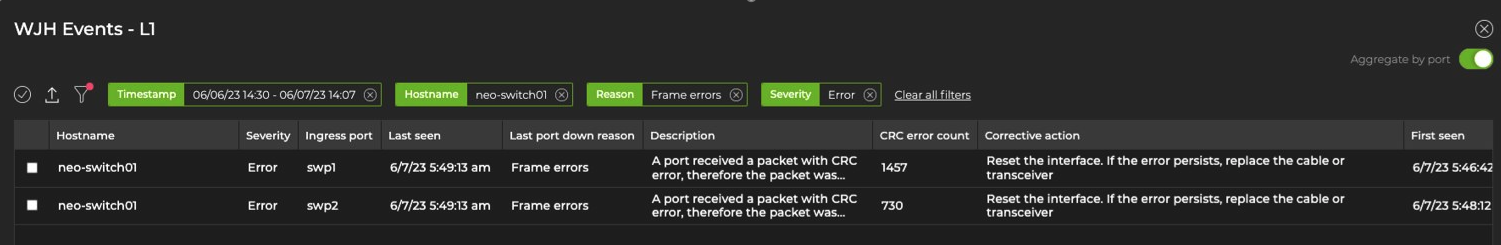
For L1 events, you can group entries by switch and ingress port to reduce the number of events displayed. To do this, select the Aggregate by port toggle in the top-right corner.
To view WJH drops, run one of the following commands. Refer to the command line reference for a comprehensive list of options and definitions.
netq [<hostname>] show wjh-drop
    [severity <text-severity>]
    [details]
    [between <text-fixed-time> and <text-fixed-endtime>]
    [around <text-fixed-time>]
    [json]

netq [<hostname>] show wjh-drop <text-drop-type>
    [ingress-port <text-ingress-port>]
    [severity <text-severity>]
    [reason <text-reason>]
    [src-ip <text-src-ip>]
    [dst-ip <text-dst-ip>]
    [proto <text-proto>]
    [src-port <text-src-port>]
    [dst-port <text-dst-port>]
    [src-mac <text-src-mac>]
    [dst-mac <text-dst-mac>]
    [egress-port <text-egress-port>]
    [traffic-class <text-traffic-class>]
    [rule-id-acl <text-rule-id-acl>]
    [vlan <text-vlan>]
    [between <text-time> and <text-endtime>]
    [around <text-time>]
    [json]
An additional command is available that aggregates WJH L1 errors that occur on the same ingress port.
netq [<hostname>] show wjh-drop l1
    [ingress-port <text-ingress-port>]
    [severity <text-severity>]
    [reason <text-reason>]
    [port-aggregate <text-port-aggregate>]
    [between <text-time> and <text-endtime>]
    [around <text-time>] [json]
This example uses the first form of the command to show drops on switch leaf03 for the past week.
nvidia@switch:~$ netq leaf03 show wjh-drop between now and 7d
Matching wjh records:
Drop type          Aggregate Count
------------------ ------------------------------
L1                 560
Buffer             224
Router             144
L2                 0
ACL                0
Tunnel             0
This example uses the second form of the command to show drops on switch leaf03 for the past week including the drop reasons.
nvidia@switch:~$ netq leaf03 show wjh-drop details between now and 7d

Matching wjh records:
Drop type          Aggregate Count                Reason
------------------ ------------------------------ ---------------------------------------------
L1                 556                            None
Buffer             196                            WRED
Router             144                            Blackhole route
Buffer             14                             Packet Latency Threshold Crossed
Buffer             14                             Port TC Congestion Threshold
L1                 4                              Oper down
This example shows the drops seen at layer 2 across the network.
nvidia@switch:mgmt:~$ netq show wjh-drop l2
Matching wjh records:
Hostname          Ingress Port             Reason                                        Agg Count          Src Ip           Dst Ip           Proto  Src Port         Dst Port         Src Mac            Dst Mac            First Timestamp                Last Timestamp
----------------- ------------------------ --------------------------------------------- ------------------ ---------------- ---------------- ------ ---------------- ---------------- ------------------ ------------------ ------------------------------ ----------------------------
mlx-2700-03       swp1s2                   Port loopback filter                          10                 27.0.0.19        27.0.0.22        0      0                0                00:02:00:00:00:73  0c:ff:ff:ff:ff:ff  Mon Dec 16 11:54:15 2019       Mon Dec 16 11:54:15 2019
mlx-2700-03       swp1s2                   Source MAC equals destination MAC             10                 27.0.0.19        27.0.0.22        0      0                0                00:02:00:00:00:73  00:02:00:00:00:73  Mon Dec 16 11:53:17 2019       Mon Dec 16 11:53:17 2019
mlx-2700-03       swp1s2                   Source MAC equals destination MAC             10                 0.0.0.0          0.0.0.0          0      0                0                00:02:00:00:00:73  00:02:00:00:00:73  Mon Dec 16 11:40:44 2019       Mon Dec 16 11:40:44 2019
The following two examples include the severity of a drop event (error, warning, or notice) for ACLs and routers.
nvidia@switch:~$ netq show wjh-drop acl
Matching wjh records:
Hostname          Ingress Port             Reason                                        Severity         Agg Count          Src Ip           Dst Ip           Proto  Src Port         Dst Port         Src Mac            Dst Mac            Acl Rule Id            Acl Bind Point               Acl Name         Acl Rule         First Timestamp                Last Timestamp
----------------- ------------------------ --------------------------------------------- ---------------- ------------------ ---------------- ---------------- ------ ---------------- ---------------- ------------------ ------------------ ---------------------- ---------------------------- ---------------- ---------------- ------------------------------ ----------------------------
leaf01            swp2                     Ingress router ACL                            Error            49                 55.0.0.1         55.0.0.2         17     8492             21423            00:32:10:45:76:89  00:ab:05:d4:1b:13  0x0                    0                                                              Tue Oct  6 15:29:13 2024       Tue Oct  6 15:29:39 2024
nvidia@switch:~$ netq show wjh-drop router
Matching wjh records:
Hostname          Ingress Port             Reason                                        Severity         Agg Count          Src Ip           Dst Ip           Proto  Src Port         Dst Port         Src Mac            Dst Mac            First Timestamp                Last Timestamp
----------------- ------------------------ --------------------------------------------- ---------------- ------------------ ---------------- ---------------- ------ ---------------- ---------------- ------------------ ------------------ ------------------------------ ----------------------------
leaf01            swp1                     Blackhole route                               Notice           36                 46.0.1.2         47.0.2.3         6      1235             43523            00:01:02:03:04:05  00:06:07:08:09:0a  Tue Oct  6 15:29:13 2020       Tue Oct  6 15:29:47 2020
Configure Latency and Congestion Thresholds
WJH latency and congestion metrics depend on threshold settings to trigger the events. WJH measures packet latency as the time spent inside a single system (switch). When specified, WJH triggers events when measured values cross high thresholds and events are suppressed when values are below low thresholds.
To configure these thresholds, run:
netq config add agent wjh-threshold
    (latency|congestion)
    (<text-tc-list>|all)
    (<text-port-list>|all)
    <text-th-hi>
    <text-th-lo>
You can specify multiple traffic classes and multiple ports by separating the classes or ports by a comma (no spaces).
For example, the following command creates latency thresholds for Class 3 traffic on port swp1 where the upper threshold is 10 usecs and the lower threshold is 1 usec:
nvidia@switch:~$ sudo netq config add agent wjh-threshold latency 3 swp1 10 1
This example creates congestion thresholds for Class 4 traffic on port swp1 where the upper threshold is 200 cells and the lower threshold is 10 cells, where a cell is a unit of 144 bytes:
nvidia@switch:~$ sudo netq config add agent wjh-threshold congestion 4 swp1 200 10
Refer to the command line reference for a comprehensive list of options and definitions for this command.
Suppress WJH Events
You can create suppression rules with the UI or CLI to prevent WJH from generating events. Rules can be applied to a drop category (such as layer 1 drops or buffer drops), a drop reason (for example, “decapsulation error” or “multicast MAC mismatch”), or according to severity level (notice, warning, or error). With the CLI, you can create rules to suppress events according to their source or destination IP addresses.
For a complete list of drop types, reasons, and severity levels, refer to the WJH Events Reference.
Before configuring the NetQ Agent to suppress WJH drops, you must generate AuthKeys. Copy the access key and secret key to an accessible location. You will enter them in one of the final steps.
Expand the
 Menu and select Manage switches.
Select the NetQ agent configurations tab.
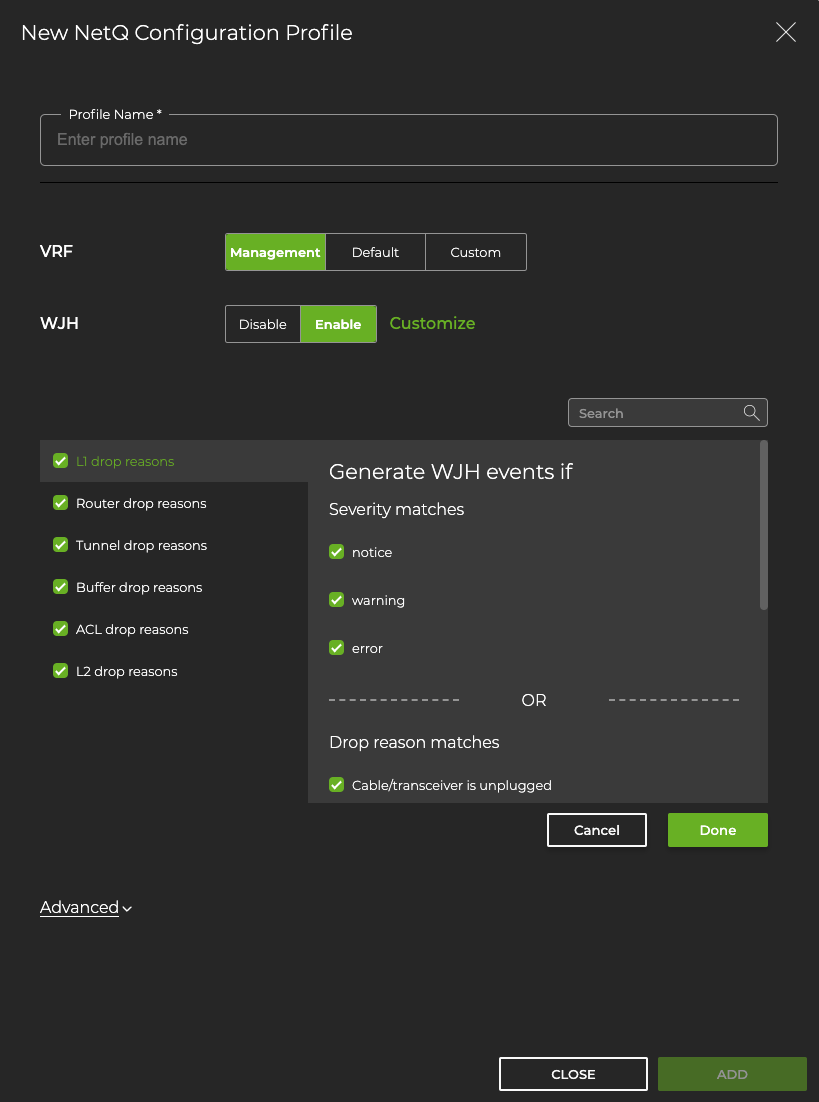
On the NetQ Agent Configurations card, select Add config.
Enter a name for the profile. In the WJH row, select Enable, then Customize. By default, WJH includes all drop reasons and severities. Uncheck any drop reasons or severity you do not want to generate WJH events, then click Done.
Enter your NetQ access key and secret key.
Select Add to save the configuration profile, or click Close to discard it.
To configure the NetQ Agent to suppress WJH drops, run netq config add agent wjh-drop-filter. Use tab completion to view the available drop type, drop reason, and severity values.
netq config add agent wjh-drop-filter
   drop-type <text-wjh-drop-type>
   [drop-reasons <text-wjh-drop-reasons>]
   [severity <text-drop-severity-list>]
To configure the NetQ Agent to ignore WJH drops based on IP addresses (both source and destination), run:
netq config add agent wjh-drop-filter
   ips [<text-wjh-ips>]
To display suppression configurations, run netq config show agent wjh-drop-filter. To delete a suppression rule, run netq config del agent wjh-drop-filter.