Networkwide Inventory
With the NetQ UI and CLI, a user can monitor the inventory on a networkwide basis for all switches, hosts, and DPUs. Inventory includes such items as the number of each device and its operating system. Additional details are available about the hardware and software components on individual switches, such as the motherboard, ASIC, microprocessor, disk, memory, fan and power supply information. The commands and cards available to obtain this type of information help you to answer questions such as:
- Which switches are being monitored in the network?
- What is the distribution of ASICs, CPUs, agents, and so forth across my network?
- Are NetQ Agents running on all of my switches?
- What hardware is installed on my switches?
- What software is installed on my switches?
To monitor the inventory of a given switch or DPU, refer to Switch Inventory or DPU Inventory.
Access Networkwide Inventory Data
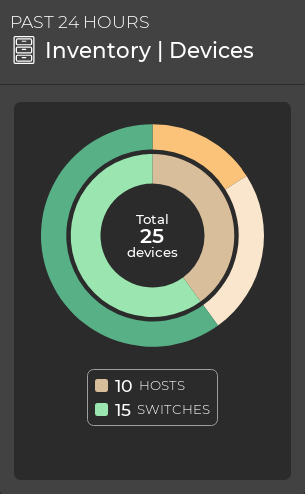
The Inventory/Devices card displays networkwide inventory information for all switches, hosts, and DPUs.
The NetQ CLI displays detailed network inventory information with netq show inventory.
View Networkwide Inventory Summary
View the Number of Each Device Type in Your Network
To view the quantity of devices in your network, open the Inventory/Devices card. The medium-sized card displays operating system distribution across the network in addition to the device count. Hover over items in the chart’s outer circle to view operating system distribution, and hover over items in the chart’s inner circle to view device counts.
View All Switches, Hosts, and DPUs
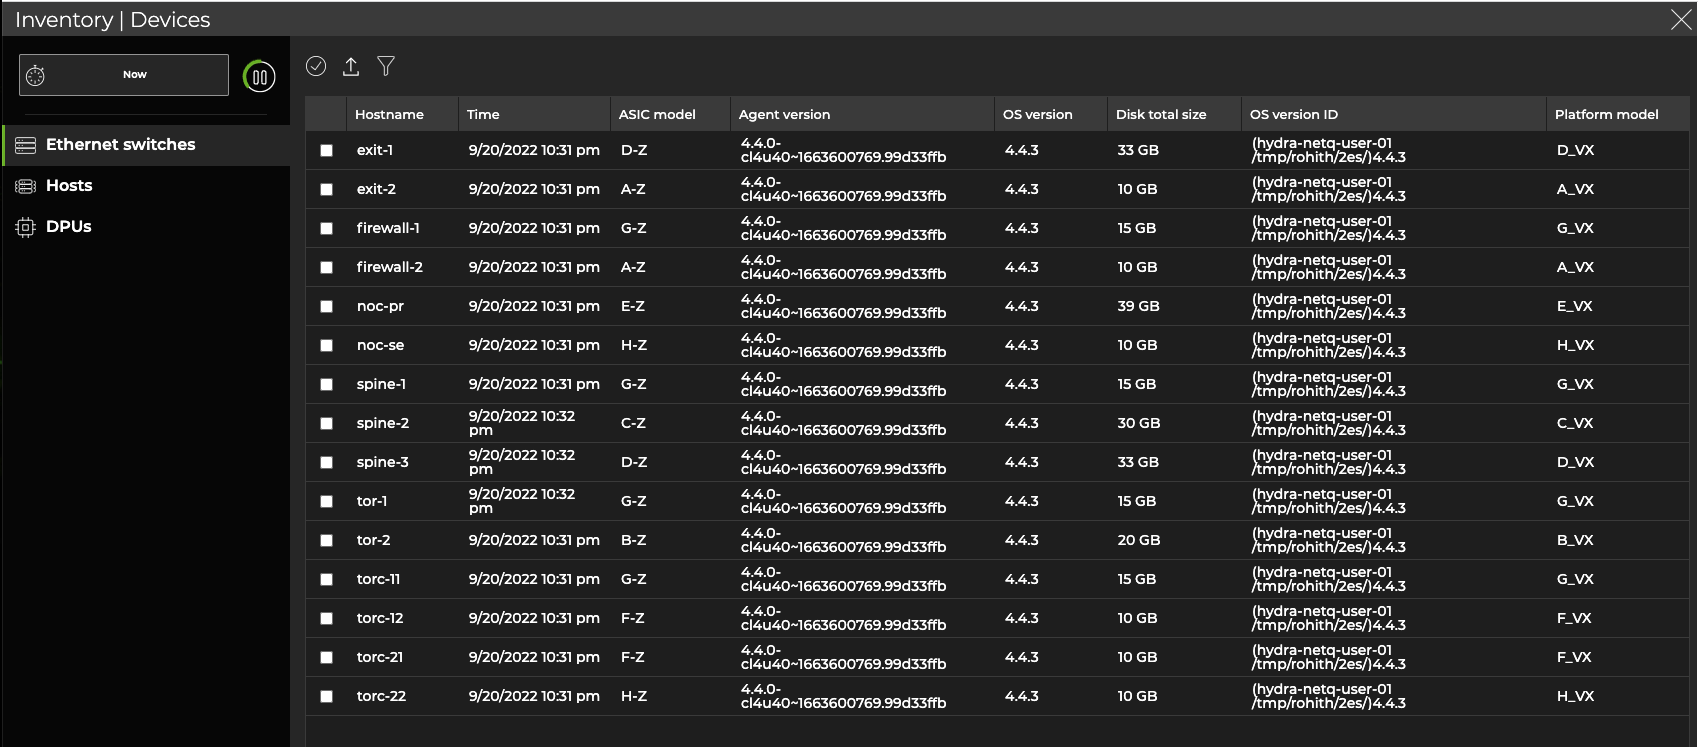
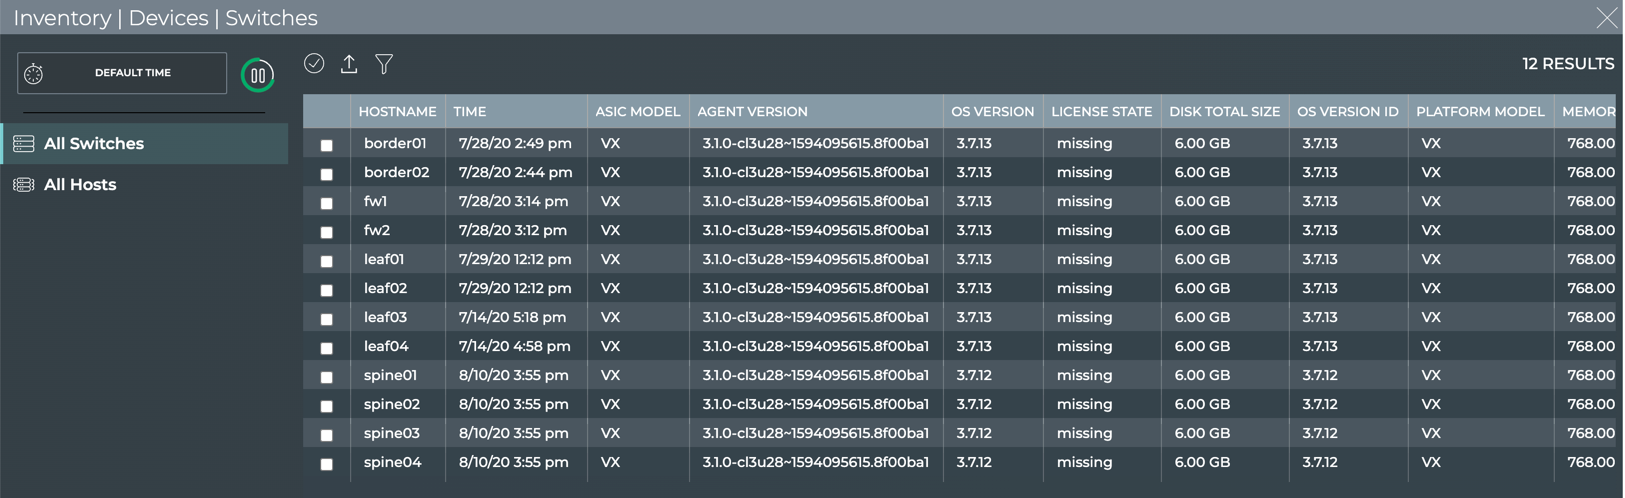
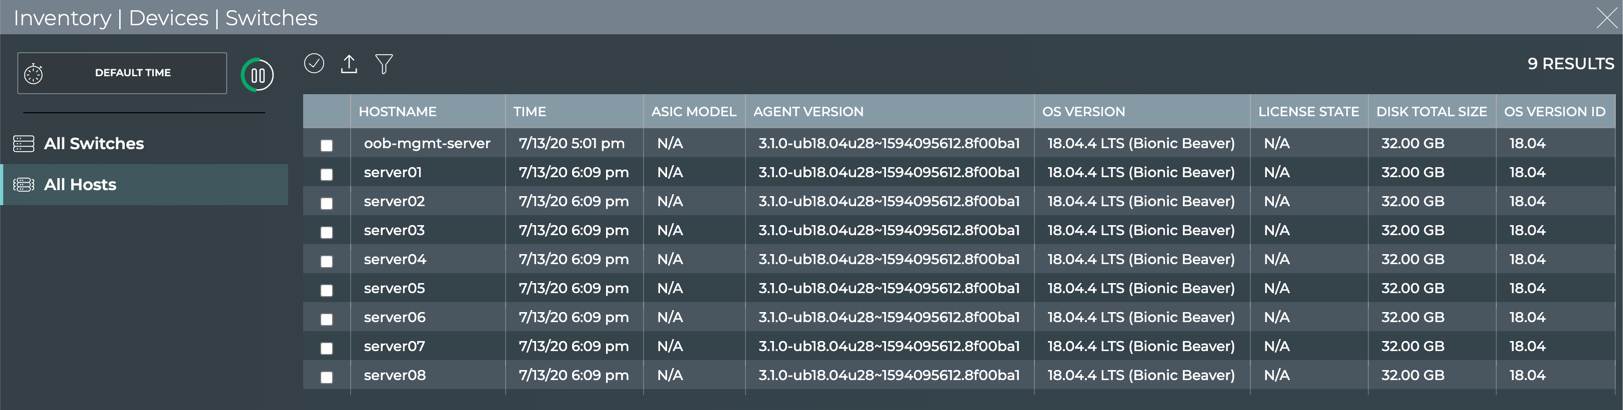
You can view all stored attributes for all switches, hosts, and DPUs in your network in the full-screen Inventory/Devices card:
To view a list of devices in your network, run:
netq show inventory brief [json]
This example shows that there are four spine switches, three leaf switches, two border switches, two firewall switches, seven hosts (servers), and an out-of-band management server in this network. Each entry displays the type of switch, operating system, CPU, and ASIC.
cumulus@switch:~$ netq show inventory brief
Matching inventory records:
Hostname          Switch               OS              CPU      ASIC            Ports
----------------- -------------------- --------------- -------- --------------- -----------------------------------
border01          VX                   CL              x86_64   VX              N/A
border02          VX                   CL              x86_64   VX              N/A
fw1               VX                   CL              x86_64   VX              N/A
fw2               VX                   CL              x86_64   VX              N/A
leaf01            VX                   CL              x86_64   VX              N/A
leaf02            VX                   CL              x86_64   VX              N/A
leaf03            VX                   CL              x86_64   VX              N/A
oob-mgmt-server   N/A                  Ubuntu          x86_64   N/A             N/A
server01          N/A                  Ubuntu          x86_64   N/A             N/A
server02          N/A                  Ubuntu          x86_64   N/A             N/A
server03          N/A                  Ubuntu          x86_64   N/A             N/A
server04          N/A                  Ubuntu          x86_64   N/A             N/A
server05          N/A                  Ubuntu          x86_64   N/A             N/A
server06          N/A                  Ubuntu          x86_64   N/A             N/A
server07          N/A                  Ubuntu          x86_64   N/A             N/A
spine01           VX                   CL              x86_64   VX              N/A
spine02           VX                   CL              x86_64   VX              N/A
spine03           VX                   CL              x86_64   VX              N/A
spine04           VX                   CL              x86_64   VX              N/A
View Networkwide Hardware Inventory
You can view hardware components deployed on all switches and hosts, or on all switches in your network.
View Components Summary
It can be useful to know the quantity and ratio of many components deployed in your network to determine the scope of upgrade tasks, balance vendor reliance, or for detailed troubleshooting.
Locate the Inventory/Devices card on your workbench.
Hover over the card, and change to the large size card using the size picker.
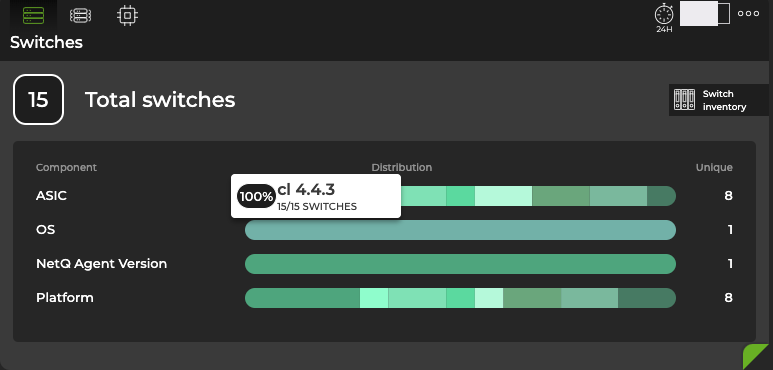
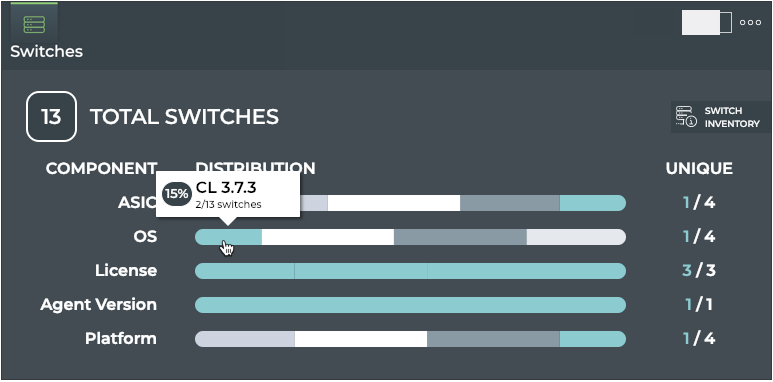
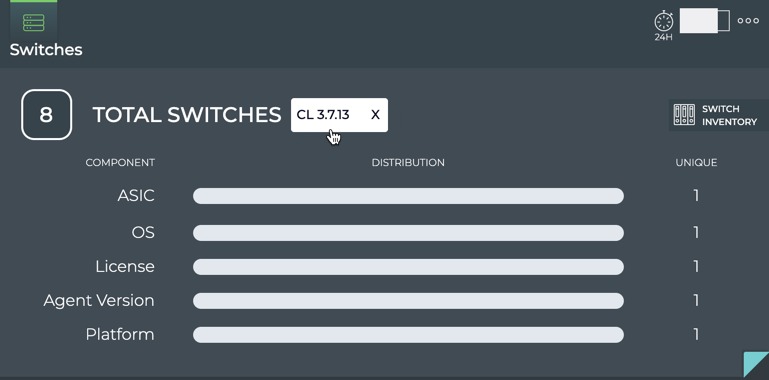
By default, the Switches tab shows the total number of switches, ASIC vendors, OS versions, NetQ Agent versions, and specific platforms deployed across all your switches.
You can hover over any of the segments in a component distribution chart to highlight a specific type of the given component. When you hover, a tooltip appears displaying:
- Name or value of the component type, such as the version number or status
- Total number of switches with that type of component deployed compared to the total number of switches
- Percentage of this type as compared to all component types
To view switch components, run:
netq show inventory brief [json]
This example shows the operating systems (Cumulus Linux and Ubuntu), CPU architecture (all x86_64), ASIC (virtual), and ports (N/A because Cumulus VX is virtual) for each device in the network.
cumulus@switch:~$ netq show inventory brief
Matching inventory records:
Hostname          Switch               OS              CPU      ASIC            Ports
----------------- -------------------- --------------- -------- --------------- -----------------------------------
border01          VX                   CL              x86_64   VX              N/A
border02          VX                   CL              x86_64   VX              N/A
fw1               VX                   CL              x86_64   VX              N/A
fw2               VX                   CL              x86_64   VX              N/A
leaf01            VX                   CL              x86_64   VX              N/A
leaf02            VX                   CL              x86_64   VX              N/A
leaf03            VX                   CL              x86_64   VX              N/A
oob-mgmt-server   N/A                  Ubuntu          x86_64   N/A             N/A
server01          N/A                  Ubuntu          x86_64   N/A             N/A
server02          N/A                  Ubuntu          x86_64   N/A             N/A
server03          N/A                  Ubuntu          x86_64   N/A             N/A
server04          N/A                  Ubuntu          x86_64   N/A             N/A
server05          N/A                  Ubuntu          x86_64   N/A             N/A
server06          N/A                  Ubuntu          x86_64   N/A             N/A
server07          N/A                  Ubuntu          x86_64   N/A             N/A
spine01           VX                   CL              x86_64   VX              N/A
spine02           VX                   CL              x86_64   VX              N/A
spine03           VX                   CL              x86_64   VX              N/A
spine04           VX                   CL              x86_64   VX              N/A
View ASIC Information
Locate the medium Inventory/Devices card on your workbench.
Hover over the card, and change to the large size card using the size picker.
Click a segment of the ASIC graph in the component distribution charts. Select Filter ASIC:

- Alternately, expand the card to full screen to view ASIC information as a column in a table.
To view information about the ASIC installed on your devices, run:
netq show inventory asic [vendor <asic-vendor>|model <asic-model>|model-id <asic-model-id>] [json]
If you are running NetQ on a CumulusVX setup, there is no physical hardware to query and thus no ASIC information to display.
This example shows the ASIC information for all devices in your network:
cumulus@switch:~$ netq show inventory asic
Matching inventory records:
Hostname          Vendor               Model                          Model ID                  Core BW        Ports
----------------- -------------------- ------------------------------ ------------------------- -------------- -----------------------------------
dell-z9100-05     Broadcom             Tomahawk                       BCM56960                  2.0T           32 x 100G-QSFP28
mlx-2100-05       Mellanox             Spectrum                       MT52132                   N/A            16 x 100G-QSFP28
mlx-2410a1-05     Mellanox             Spectrum                       MT52132                   N/A            48 x 25G-SFP28 & 8 x 100G-QSFP28
mlx-2700-11       Mellanox             Spectrum                       MT52132                   N/A            32 x 100G-QSFP28
qct-ix1-08        Broadcom             Tomahawk                       BCM56960                  2.0T           32 x 100G-QSFP28
qct-ix7-04        Broadcom             Trident3                       BCM56870                  N/A            32 x 100G-QSFP28
st1-l1            Broadcom             Trident2                       BCM56854                  720G           48 x 10G-SFP+ & 6 x 40G-QSFP+
st1-l2            Broadcom             Trident2                       BCM56854                  720G           48 x 10G-SFP+ & 6 x 40G-QSFP+
st1-l3            Broadcom             Trident2                       BCM56854                  720G           48 x 10G-SFP+ & 6 x 40G-QSFP+
st1-s1            Broadcom             Trident2                       BCM56850                  960G           32 x 40G-QSFP+
st1-s2            Broadcom             Trident2                       BCM56850                  960G           32 x 40G-QSFP+
You can filter the results of the command to view devices with a particular vendor, model, or modelID. This example shows ASIC information for all devices with a vendor of NVIDIA.
cumulus@switch:~$ netq show inventory asic vendor NVIDIA
Matching inventory records:
Hostname          Vendor               Model                          Model ID                  Core BW        Ports
----------------- -------------------- ------------------------------ ------------------------- -------------- -----------------------------------
mlx-2100-05       NVIDIA               Spectrum                       MT52132                   N/A            16 x 100G-QSFP28
mlx-2410a1-05     NVIDIA               Spectrum                       MT52132                   N/A            48 x 25G-SFP28 & 8 x 100G-QSFP28
mlx-2700-11       NVIDIA               Spectrum                       MT52132                   N/A            32 x 100G-QSFP28
View Motherboard/Platform Information
Locate the Inventory/Devices card on your workbench.
Hover over the card, and change to the full-screen card using the size picker.
The All Switches tab is active by default. Scroll to the right to view the various Platform parameters for your switches. Optionally drag and drop the relevant columns next to each other.
Click All Hosts.
Scroll to the right to view the various Platform parameters for your hosts. Optionally drag and drop the relevant columns next to each other.
To view a list of motherboards installed in your switches and hosts, run:
netq show inventory board [vendor <board-vendor>|model <board-model>] [json]
This example shows all motherboard data for all devices.
cumulus@switch:~$ netq show inventory board
Matching inventory records:
Hostname          Vendor               Model                          Base MAC           Serial No                 Part No          Rev    Mfg Date
----------------- -------------------- ------------------------------ ------------------ ------------------------- ---------------- ------ ----------
dell-z9100-05     DELL                 Z9100-ON                       4C:76:25:E7:42:C0  CN03GT5N779315C20001      03GT5N           A00    12/04/2015
mlx-2100-05       Penguin              Arctica 1600cs                 7C:FE:90:F5:61:C0  MT1623X10078              MSN2100-CB2FO    N/A    06/09/2016
mlx-2410a1-05     Mellanox             SN2410                         EC:0D:9A:4E:55:C0  MT1734X00067              MSN2410-CB2F_QP3 N/A    08/24/2017
mlx-2700-11       Penguin              Arctica 3200cs                 44:38:39:00:AB:80  MT1604X21036              MSN2700-CS2FO    N/A    01/31/2016
qct-ix1-08        QCT                  QuantaMesh BMS T7032-IX1       54:AB:3A:78:69:51  QTFCO7623002C             1IX1UZZ0ST6      H3B    05/30/2016
qct-ix7-04        QCT                  IX7                            D8:C4:97:62:37:65  QTFCUW821000A             1IX7UZZ0ST5      B3D    05/07/2018
qct-ix7-04        QCT                  T7032-IX7                      D8:C4:97:62:37:65  QTFCUW821000A             1IX7UZZ0ST5      B3D    05/07/2018
st1-l1            CELESTICA            Arctica 4806xp                 00:E0:EC:27:71:37  D2060B2F044919GD000011    R0854-F1004-01   Redsto 09/20/2014
                                                                                                                                    ne-XP
st1-l2            CELESTICA            Arctica 4806xp                 00:E0:EC:27:6B:3A  D2060B2F044919GD000060    R0854-F1004-01   Redsto 09/20/2014
                                                                                                                                    ne-XP
st1-l3            Penguin              Arctica 4806xp                 44:38:39:00:70:49  N/A                       N/A              N/A    N/A
st1-s1            Dell                 S6000-ON                       44:38:39:00:80:00  N/A                       N/A              N/A    N/A
st1-s2            Dell                 S6000-ON                       44:38:39:00:80:81  N/A                       N/A              N/A    N/A
You can filter the results of the command to capture only those devices with a particular motherboard vendor or model. This example shows only the devices with a Celestica motherboard.
cumulus@switch:~$ netq show inventory board vendor celestica
Matching inventory records:
Hostname          Vendor               Model                          Base MAC           Serial No                 Part No          Rev    Mfg Date
----------------- -------------------- ------------------------------ ------------------ ------------------------- ---------------- ------ ----------
st1-l1            CELESTICA            Arctica 4806xp                 00:E0:EC:27:71:37  D2060B2F044919GD000011    R0854-F1004-01   Redsto 09/20/2014
                                                                                                                                    ne-XP
st1-l2            CELESTICA            Arctica 4806xp                 00:E0:EC:27:6B:3A  D2060B2F044919GD000060    R0854-F1004-01   Redsto 09/20/2014
                                                                                                                                    ne-XP
View CPU Information
Locate the Inventory/Devices card on your workbench.
Hover over the card, and change to the full-screen card using the size picker.
The All Switches tab is active by default. Scroll to the right to view the various CPU parameters. Optionally drag and drop relevant columns next to each other.
- Click All Hosts to view the CPU information for your host servers.
To view CPU information for all devices in your network, run:
netq show inventory cpu [arch <cpu-arch>] [json]
This example shows the CPU information for all devices.
cumulus@switch:~$ netq show inventory cpu
Matching inventory records:
Hostname          Arch     Model                          Freq       Cores
----------------- -------- ------------------------------ ---------- -----
dell-z9100-05     x86_64   Intel(R) Atom(TM) C2538        2.40GHz    4
mlx-2100-05       x86_64   Intel(R) Atom(TM) C2558        2.40GHz    4
mlx-2410a1-05     x86_64   Intel(R) Celeron(R)  1047UE    1.40GHz    2
mlx-2700-11       x86_64   Intel(R) Celeron(R)  1047UE    1.40GHz    2
qct-ix1-08        x86_64   Intel(R) Atom(TM) C2558        2.40GHz    4
qct-ix7-04        x86_64   Intel(R) Atom(TM) C2558        2.40GHz    4
st1-l1            x86_64   Intel(R) Atom(TM) C2538        2.41GHz    4
st1-l2            x86_64   Intel(R) Atom(TM) C2538        2.41GHz    4
st1-l3            x86_64   Intel(R) Atom(TM) C2538        2.40GHz    4
st1-s1            x86_64   Intel(R) Atom(TM)  S1220       1.60GHz    4
st1-s2            x86_64   Intel(R) Atom(TM)  S1220       1.60GHz    4
You can filter the results of the command to view which switches employ a particular CPU architecture using the arch keyword. This example shows how to determine all the currently deployed architectures in your network, and then shows all devices with an x86_64 architecture.
cumulus@switch:~$ netq show inventory cpu arch
    x86_64  :  CPU Architecture

cumulus@switch:~$ netq show inventory cpu arch x86_64
Matching inventory records:
Hostname          Arch     Model                          Freq       Cores
----------------- -------- ------------------------------ ---------- -----
leaf01            x86_64   Intel Core i7 9xx (Nehalem Cla N/A        1
                            ss Core i7)
leaf02            x86_64   Intel Core i7 9xx (Nehalem Cla N/A        1
                            ss Core i7)
leaf03            x86_64   Intel Core i7 9xx (Nehalem Cla N/A        1
                            ss Core i7)
leaf04            x86_64   Intel Core i7 9xx (Nehalem Cla N/A        1
                            ss Core i7)
oob-mgmt-server   x86_64   Intel Core i7 9xx (Nehalem Cla N/A        1
                            ss Core i7)
server01          x86_64   Intel Core i7 9xx (Nehalem Cla N/A        1
                            ss Core i7)
server02          x86_64   Intel Core i7 9xx (Nehalem Cla N/A        1
                            ss Core i7)
server03          x86_64   Intel Core i7 9xx (Nehalem Cla N/A        1
                            ss Core i7)
server04          x86_64   Intel Core i7 9xx (Nehalem Cla N/A        1
                            ss Core i7)
spine01           x86_64   Intel Core i7 9xx (Nehalem Cla N/A        1
                            ss Core i7)
spine02           x86_64   Intel Core i7 9xx (Nehalem Cla N/A        1
                            ss Core i7)
View Disk Information
Locate the Inventory/Devices card on your workbench.
Hover over the card, and change to the full-screen card using the size picker.
The All Switches tab is selected by default. Locate the Disk Total Size column.
Click All Hosts to view the total disk size of all host servers.
To view disk information for your switches, run:
netq show inventory disk [name <disk-name>|transport <disk-transport>|vendor <disk-vendor>] [json]
This example shows the disk information for all devices.
cumulus@switch:~$ netq show inventory disk
Matching inventory records:
Hostname          Name            Type             Transport          Size       Vendor               Model
----------------- --------------- ---------------- ------------------ ---------- -------------------- ------------------------------
leaf01            vda             disk             N/A                6G         0x1af4               N/A
leaf02            vda             disk             N/A                6G         0x1af4               N/A
leaf03            vda             disk             N/A                6G         0x1af4               N/A
leaf04            vda             disk             N/A                6G         0x1af4               N/A
oob-mgmt-server   vda             disk             N/A                256G       0x1af4               N/A
server01          vda             disk             N/A                301G       0x1af4               N/A
server02          vda             disk             N/A                301G       0x1af4               N/A
server03          vda             disk             N/A                301G       0x1af4               N/A
server04          vda             disk             N/A                301G       0x1af4               N/A
spine01           vda             disk             N/A                6G         0x1af4               N/A
spine02           vda             disk             N/A                6G         0x1af4               N/A
View Memory Information
Locate the Inventory/Devices card on your workbench.
Hover over the card, and change to the full-screen card using the size picker.
The All Switches tab is selected by default. Locate the Memory Size column.
Click All Hosts to view the memory size for all host servers.
To view memory information for your switches and host servers, run:
netq show inventory memory [type <memory-type>|vendor <memory-vendor>] [json]
This example shows all memory characteristics for all devices.
cumulus@switch:~$ netq show inventory memory
Matching inventory records:
Hostname          Name            Type             Size       Speed      Vendor               Serial No
----------------- --------------- ---------------- ---------- ---------- -------------------- -------------------------
dell-z9100-05     DIMM0 BANK 0    DDR3             8192 MB    1600 MHz   Hynix                14391421
mlx-2100-05       DIMM0 BANK 0    DDR3             8192 MB    1600 MHz   InnoDisk Corporation 00000000
mlx-2410a1-05     ChannelA-DIMM0  DDR3             8192 MB    1600 MHz   017A                 87416232
                    BANK 0
mlx-2700-11       ChannelA-DIMM0  DDR3             8192 MB    1600 MHz   017A                 73215444
                    BANK 0
mlx-2700-11       ChannelB-DIMM0  DDR3             8192 MB    1600 MHz   017A                 73215444
                    BANK 2
qct-ix1-08        N/A             N/A              7907.45MB  N/A        N/A                  N/A
qct-ix7-04        DIMM0 BANK 0    DDR3             8192 MB    1600 MHz   Transcend            00211415
st1-l1            DIMM0 BANK 0    DDR3             4096 MB    1333 MHz   N/A                  N/A
st1-l2            DIMM0 BANK 0    DDR3             4096 MB    1333 MHz   N/A                  N/A
st1-l3            DIMM0 BANK 0    DDR3             4096 MB    1600 MHz   N/A                  N/A
st1-s1            A1_DIMM0 A1_BAN DDR3             8192 MB    1333 MHz   A1_Manufacturer0     A1_SerNum0
                    K0
st1-s2            A1_DIMM0 A1_BAN DDR3             8192 MB    1333 MHz   A1_Manufacturer0     A1_SerNum0
                    K0
You can filter the results of the command to view devices with a particular memory type or vendor. This example shows all the devices with memory from QEMU .
cumulus@switch:~$ netq show inventory memory vendor QEMU
Matching inventory records:
Hostname          Name            Type             Size       Speed      Vendor               Serial No
----------------- --------------- ---------------- ---------- ---------- -------------------- -------------------------
leaf01            DIMM 0          RAM              1024 MB    Unknown    QEMU                 Not Specified
leaf02            DIMM 0          RAM              1024 MB    Unknown    QEMU                 Not Specified
leaf03            DIMM 0          RAM              1024 MB    Unknown    QEMU                 Not Specified
leaf04            DIMM 0          RAM              1024 MB    Unknown    QEMU                 Not Specified
oob-mgmt-server   DIMM 0          RAM              4096 MB    Unknown    QEMU                 Not Specified
server01          DIMM 0          RAM              512 MB     Unknown    QEMU                 Not Specified
server02          DIMM 0          RAM              512 MB     Unknown    QEMU                 Not Specified
server03          DIMM 0          RAM              512 MB     Unknown    QEMU                 Not Specified
server04          DIMM 0          RAM              512 MB     Unknown    QEMU                 Not Specified
spine01           DIMM 0          RAM              1024 MB    Unknown    QEMU                 Not Specified
spine02           DIMM 0          RAM              1024 MB    Unknown    QEMU                 Not Specified
View Sensor Information
Fan, power supply unit (PSU), and temperature sensors are available to provide additional data about the NetQ system operation.
Power Supply Unit Information
Click
 Menu, then click Sensors.
The PSU tab is displayed by default.
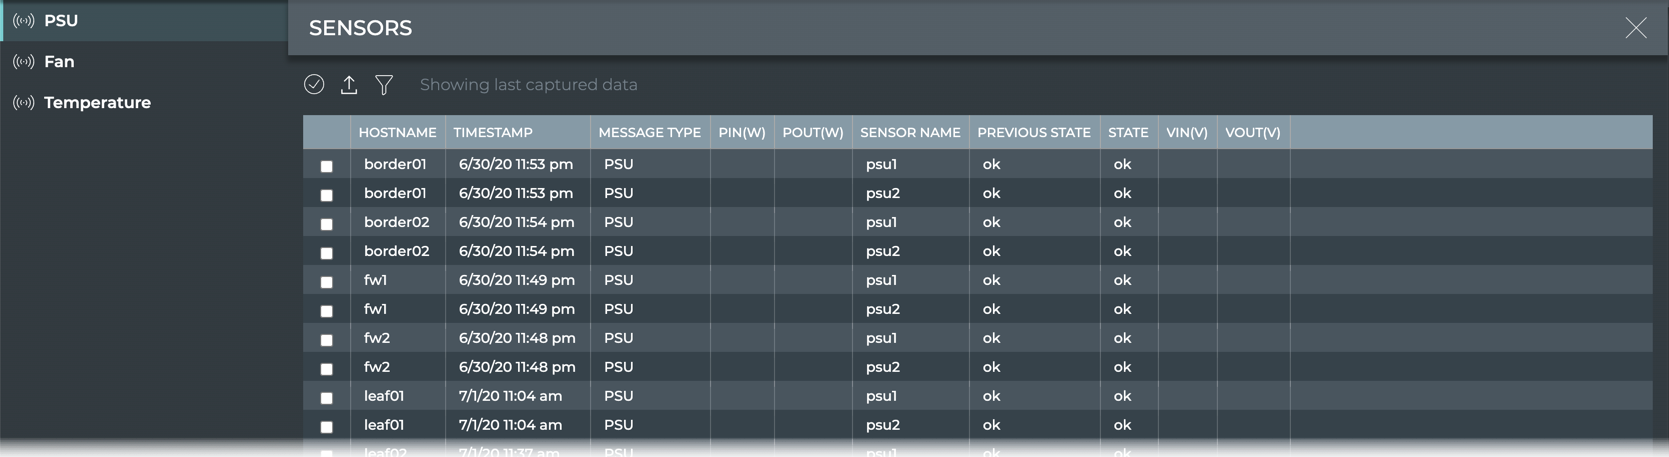
| PSU Parameter | Description |
|---|---|
| Hostname | Name of the switch or host where the power supply is installed |
| Timestamp | Date and time the data was captured |
| Message Type | Type of sensor message; always PSU in this table |
| PIn(W) | Input power (Watts) for the PSU on the switch or host |
| POut(W) | Output power (Watts) for the PSU on the switch or host |
| Sensor Name | User-defined name for the PSU |
| Previous State | State of the PSU when data was captured in previous window |
| State | State of the PSU when data was last captured |
| VIn(V) | Input voltage (Volts) for the PSU on the switch or host |
| VOut(V) | Output voltage (Volts) for the PSU on the switch or host |
Fan Information
Click
Menu, then click Sensors in the Network heading.Click Fan.
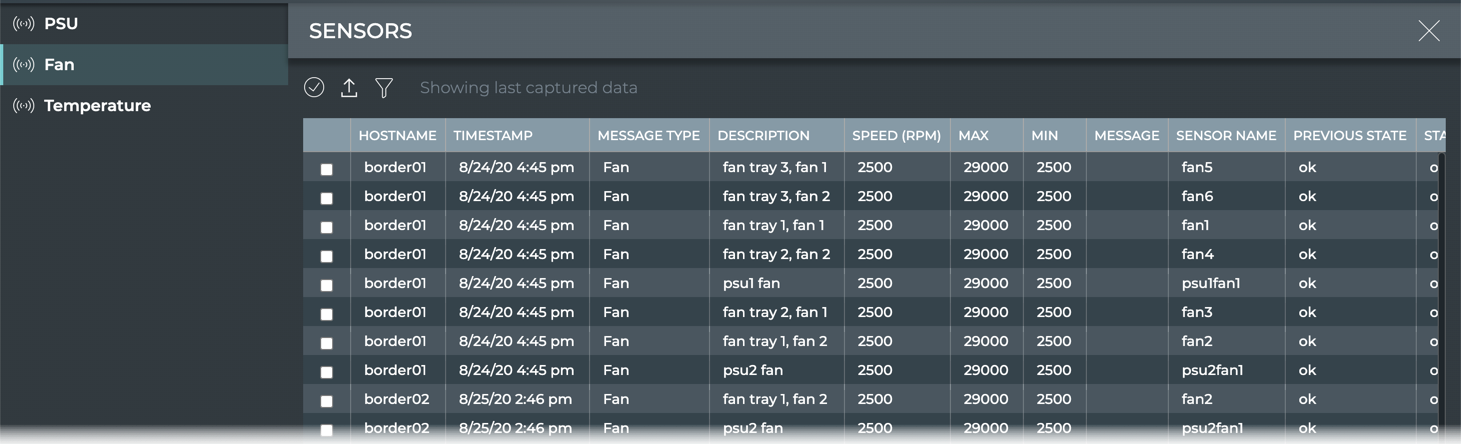
| Fan Parameter | Description |
|---|---|
| Hostname | Name of the switch or host where the fan is installed |
| Timestamp | Date and time the data was captured |
| Message Type | Type of sensor message; always Fan in this table |
| Description | User specified description of the fan |
| Speed (RPM) | Revolution rate of the fan (revolutions per minute) |
| Max | Maximum speed (RPM) |
| Min | Minimum speed (RPM) |
| Message | Message |
| Sensor Name | User-defined name for the fan |
| Previous State | State of the fan when data was captured in previous window |
| State | State of the fan when data was last captured |
Temperature Information
Click
Menu, then click Sensors in the Network heading.Click Temperature.
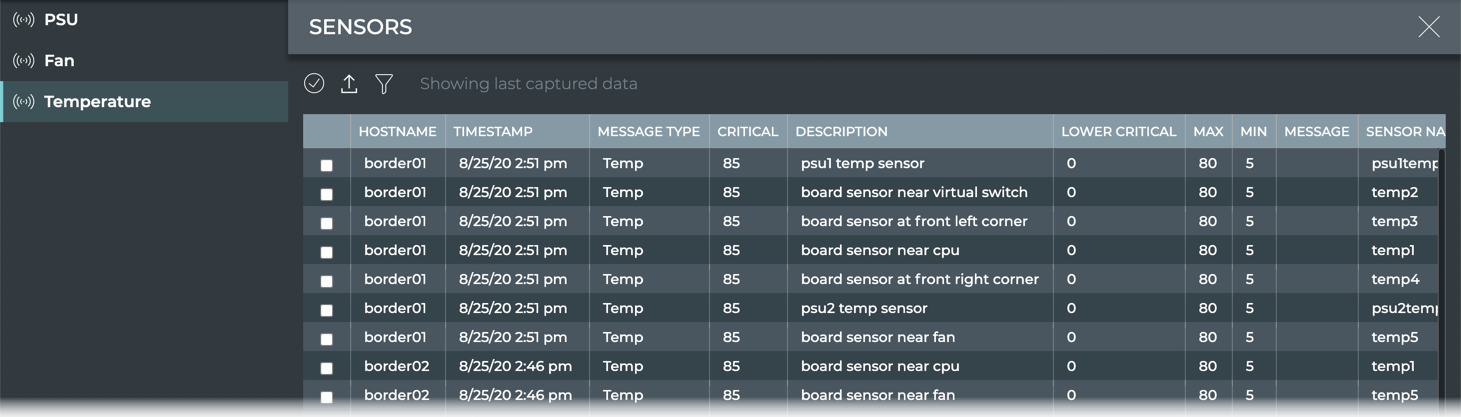
| Temperature Parameter | Description |
|---|---|
| Hostname | Name of the switch or host where the temperature sensor is installed |
| Timestamp | Date and time the data was captured |
| Message Type | Type of sensor message; always Temp in this table |
| Critical | Current critical maximum temperature (°C) threshold setting |
| Description | User specified description of the temperature sensor |
| Lower Critical | Current critical minimum temperature (°C) threshold setting |
| Max | Maximum temperature threshold setting |
| Min | Minimum temperature threshold setting |
| Message | Message |
| Sensor Name | User-defined name for the temperature sensor |
| Previous State | State of the fan when data was captured in previous window |
| State | State of the fan when data was last captured |
| Temperature(Celsius) | Current temperature (°C) measured by sensor |
View All Sensor Information
To view information for power supplies, fans, and temperature sensors on all switches and host servers, run:
netq show sensors all [around <text-time>] [json]
View Only Power Supply Sensors
To view information from all PSU sensors or PSU sensors with a given name on your switches and host servers, run:
netq show sensors psu [<psu-name>] [around <text-time>] [json]
Use the psu-name option to view all PSU sensors with a particular name.
Use Tab completion to determine the names of the PSUs in your switches.
cumulus@switch:~$ netq show sensors psu <press tab>
around  :  Go back in time to around ...
json    :  Provide output in JSON
psu1    :  Power Supply
psu2    :  Power Supply
<ENTER>
This example shows all PSUs with the name psu2.
cumulus@switch:~$ netq show sensors psu psu2
Matching sensors records:
Hostname          Name            State      Message                             Last Changed
----------------- --------------- ---------- ----------------------------------- -------------------------
exit01            psu2            ok                                             Fri Apr 19 16:01:17 2019
exit02            psu2            ok                                             Fri Apr 19 16:01:33 2019
leaf01            psu2            ok                                             Sun Apr 21 20:07:12 2019
leaf02            psu2            ok                                             Fri Apr 19 16:01:41 2019
leaf03            psu2            ok                                             Fri Apr 19 16:01:44 2019
leaf04            psu2            ok                                             Fri Apr 19 16:01:36 2019
spine01           psu2            ok                                             Fri Apr 19 16:01:52 2019
spine02           psu2            ok                                             Fri Apr 19 16:01:08 2019
View Only Fan Sensors
To view information from all fan sensors or fan sensors with a given name on your switches and host servers, run:
netq show sensors fan [<fan-name>] [around <text-time>] [json]
Use tab completion to determine the names of the fans in your switches:
cumulus@switch:~$ netq show sensors fan <<press tab>>
   around : Go back in time to around ...
   fan1 : Fan Name
   fan2 : Fan Name
   fan3 : Fan Name
   fan4 : Fan Name
   fan5 : Fan Name
   fan6 : Fan Name
   json : Provide output in JSON
   psu1fan1 : Fan Name
   psu2fan1 : Fan Name
   <ENTER>
This example shows the state of all fans with the name fan1.
cumulus@switch~$ netq show sensors fan fan1
Matching sensors records:
Hostname          Name            Description                         State      Speed      Max      Min      Message                             Last Changed
----------------- --------------- ----------------------------------- ---------- ---------- -------- -------- ----------------------------------- -------------------------
border01          fan1            fan tray 1, fan 1                   ok         2500       29000    2500                                         Tue Aug 25 21:45:21 2020
border02          fan1            fan tray 1, fan 1                   ok         2500       29000    2500                                         Tue Aug 25 21:39:36 2020
fw1               fan1            fan tray 1, fan 1                   ok         2500       29000    2500                                         Wed Aug 26 00:08:01 2020
fw2               fan1            fan tray 1, fan 1                   ok         2500       29000    2500                                         Wed Aug 26 00:02:13 2020
leaf01            fan1            fan tray 1, fan 1                   ok         2500       29000    2500                                         Tue Aug 25 18:30:07 2020
leaf02            fan1            fan tray 1, fan 1                   ok         2500       29000    2500                                         Tue Aug 25 18:08:38 2020
leaf03            fan1            fan tray 1, fan 1                   ok         2500       29000    2500                                         Tue Aug 25 21:20:34 2020
leaf04            fan1            fan tray 1, fan 1                   ok         2500       29000    2500                                         Wed Aug 26 14:20:22 2020
spine01           fan1            fan tray 1, fan 1                   ok         2500       29000    2500                                         Wed Aug 26 10:53:17 2020
spine02           fan1            fan tray 1, fan 1                   ok         2500       29000    2500                                         Wed Aug 26 10:54:07 2020
spine03           fan1            fan tray 1, fan 1                   ok         2500       29000    2500                                         Wed Aug 26 11:00:44 2020
spine04           fan1            fan tray 1, fan 1                   ok         2500       29000    2500                                         Wed Aug 26 10:52:00 2020
View Only Temperature Sensors
To view information from all temperature sensors or temperature sensors with a given name on your switches and host servers, run:
netq show sensors temp [<temp-name>] [around <text-time>] [json]
Use tab completion to determine the names of the temperature sensors on your devices:
cumulus@switch:~$ netq show sensors temp <press tab>
    around     :  Go back in time to around ...
    json       :  Provide output in JSON
    psu1temp1  :  Temp Name
    psu2temp1  :  Temp Name
    temp1      :  Temp Name
    temp2      :  Temp Name
    temp3      :  Temp Name
    temp4      :  Temp Name
    temp5      :  Temp Name
    <ENTER>
This example shows the state of all temperature sensors with the name psu2temp1.
cumulus@switch:~$ netq show sensors temp psu2temp1
Matching sensors records:
Hostname          Name            Description                         State      Temp     Critical Max      Min      Message                             Last Changed
----------------- --------------- ----------------------------------- ---------- -------- -------- -------- -------- ----------------------------------- -------------------------
border01          psu2temp1       psu2 temp sensor                    ok         25       85       80       5                                            Tue Aug 25 21:45:21 2020
border02          psu2temp1       psu2 temp sensor                    ok         25       85       80       5                                            Tue Aug 25 21:39:36 2020
fw1               psu2temp1       psu2 temp sensor                    ok         25       85       80       5                                            Wed Aug 26 00:08:01 2020
fw2               psu2temp1       psu2 temp sensor                    ok         25       85       80       5                                            Wed Aug 26 00:02:13 2020
leaf01            psu2temp1       psu2 temp sensor                    ok         25       85       80       5                                            Tue Aug 25 18:30:07 2020
leaf02            psu2temp1       psu2 temp sensor                    ok         25       85       80       5                                            Tue Aug 25 18:08:38 2020
leaf03            psu2temp1       psu2 temp sensor                    ok         25       85       80       5                                            Tue Aug 25 21:20:34 2020
leaf04            psu2temp1       psu2 temp sensor                    ok         25       85       80       5                                            Wed Aug 26 14:20:22 2020
spine01           psu2temp1       psu2 temp sensor                    ok         25       85       80       5                                            Wed Aug 26 10:53:17 2020
spine02           psu2temp1       psu2 temp sensor                    ok         25       85       80       5                                            Wed Aug 26 10:54:07 2020
spine03           psu2temp1       psu2 temp sensor                    ok         25       85       80       5                                            Wed Aug 26 11:00:44 2020
spine04           psu2temp1       psu2 temp sensor                    ok         25       85       80       5                                            Wed Aug 26 10:52:00 2020
View Digital Optics Information
Use the filter option to view laser power and bias current for a given interface and channel on a switch, and temperature and voltage for a given module. Select the relevant tab to view the data.
Click
Menu, then click Digital Optics.The Laser Rx Power tab is displayed by default.
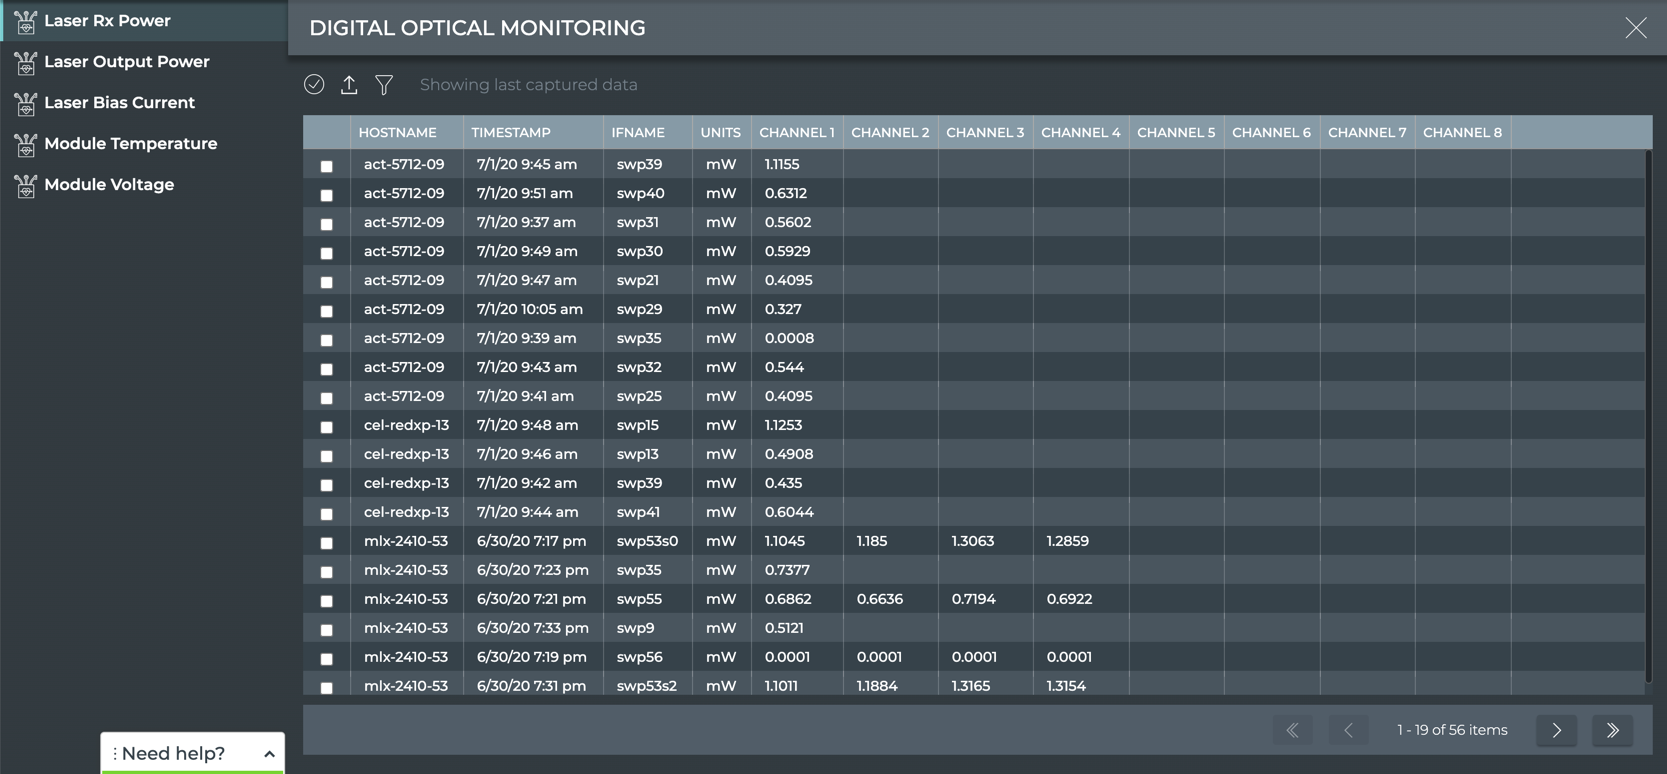
| Laser Parameter | Description |
|---|---|
| Hostname | Name of the switch or host where the digital optics module resides |
| Timestamp | Date and time the data was captured |
| If Name | Name of interface where the digital optics module is installed |
| Units | Measurement unit for the power (mW) or current (mA) |
| Channel 1–8 | Value of the power or current on each channel where the digital optics module is transmitting |
| Module Parameter | Description |
|---|---|
| Hostname | Name of the switch or host where the digital optics module resides |
| Timestamp | Date and time the data was captured |
| If Name | Name of interface where the digital optics module is installed |
| Degree C | Current module temperature, measured in degrees Celsius |
| Degree F | Current module temperature, measured in degrees Fahrenheit |
| Units | Measurement unit for module voltage; Volts |
| Value | Current module voltage |
- Click each of the other Laser or Module tabs to view that information for all devices.
To view digital optics information for your switches and host servers, run one of the following:
netq show dom type (laser_rx_power|laser_output_power|laser_bias_current) [interface <text-dom-port-anchor>] [channel_id <text-channel-id>] [around <text-time>] [json]
netq show dom type (module_temperature|module_voltage) [interface <text-dom-port-anchor>] [around <text-time>] [json]
This example shows module temperature information for all devices.
cumulus@switch:~$ netq show dom type module_temperature
Matching dom records:
Hostname          Interface  type                 high_alarm_threshold low_alarm_threshold  high_warning_thresho low_warning_threshol value                Last Updated
                                                                                            ld                   d
----------------- ---------- -------------------- -------------------- -------------------- -------------------- -------------------- -------------------- ------------------------
...
spine01           swp53s0    module_temperature   {‘degree_c’: 85,     {‘degree_c’: -10,    {‘degree_c’: 70,     {‘degree_c’: 0,      {‘degree_c’: 32,     Wed Jul  1 15:25:56 2020
                                                  ‘degree_f’: 185}     ‘degree_f’: 14}      ‘degree_f’: 158}     ‘degree_f’: 32}      ‘degree_f’: 89.6}
spine01           swp35      module_temperature   {‘degree_c’: 75,     {‘degree_c’: -5,     {‘degree_c’: 70,     {‘degree_c’: 0,      {‘degree_c’: 27.82,  Wed Jul  1 15:25:56 2020
                                                  ‘degree_f’: 167}     ‘degree_f’: 23}      ‘degree_f’: 158}     ‘degree_f’: 32}      ‘degree_f’: 82.08}
spine01           swp55      module_temperature   {‘degree_c’: 75,     {‘degree_c’: -5,     {‘degree_c’: 70,     {‘degree_c’: 0,      {‘degree_c’: 26.29,  Wed Jul  1 15:25:56 2020
                                                  ‘degree_f’: 167}     ‘degree_f’: 23}      ‘degree_f’: 158}     ‘degree_f’: 32}      ‘degree_f’: 79.32}
spine01           swp9       module_temperature   {‘degree_c’: 78,     {‘degree_c’: -13,    {‘degree_c’: 73,     {‘degree_c’: -8,     {‘degree_c’: 25.57,  Wed Jul  1 15:25:56 2020
                                                  ‘degree_f’: 172.4}   ‘degree_f’: 8.6}     ‘degree_f’: 163.4}   ‘degree_f’: 17.6}    ‘degree_f’: 78.02}
spine01           swp56      module_temperature   {‘degree_c’: 78,     {‘degree_c’: -10,    {‘degree_c’: 75,     {‘degree_c’: -5,     {‘degree_c’: 29.43,  Wed Jul  1 15:25:56 2020
                                                  ‘degree_f’: 172.4}   ‘degree_f’: 14}      ‘degree_f’: 167}     ‘degree_f’: 23}      ‘degree_f’: 84.97}
...
View Software Inventory across the Network
You can view software components deployed on all switches and hosts, or on all the switches in your network.
View the Operating Systems Information
- Locate the medium Inventory/Devices card on your workbench.
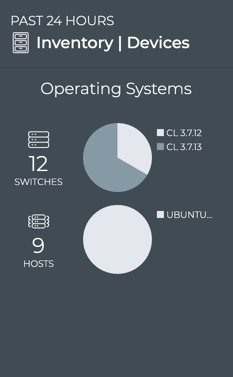
- Hover over the pie charts to view the total number of devices with a given operating system installed.
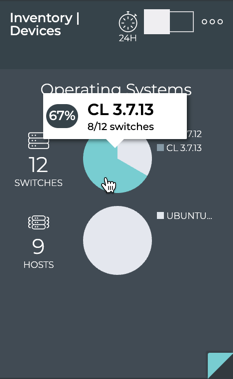
Change to the large card using the size picker.
Hover over a segment in the OS distribution chart to view the total number of devices with a given operating system installed.
Note that sympathetic highlighting (in blue) is employed to show which versions of the other switch components are associated with this OS.
Click on a segment in OS distribution chart.
Click Filter OS at the top of the popup.
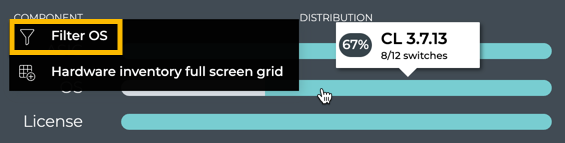
- The card updates to show only the components associated with switches running the selected OS. To return to all OSs, click X in the OS tag to remove the filter.
- Change to the full-screen card using the size picker.
The All Switches tab is selected by default. Scroll to the right to locate all of the OS parameter data.
Click All Hosts to view the OS parameters for all host servers.
To view OS information for your switches and host servers, run:
netq show inventory os [version <os-version>|name <os-name>] [json]
You can filter the results of the command to view only devices with a particular operating system or version. This can be especially helpful when you suspect that a particular device upgrade did not work as expected.
This example shows all devices with the Cumulus Linux version 3.7.12 installed.
cumulus@switch:~$ netq show inventory os version 3.7.12

Matching inventory records:
Hostname          Name            Version                              Last Changed
----------------- --------------- ------------------------------------ -------------------------
spine01           CL              3.7.12                               Mon Aug 10 19:55:06 2020
spine02           CL              3.7.12                               Mon Aug 10 19:55:07 2020
spine03           CL              3.7.12                               Mon Aug 10 19:55:09 2020
spine04           CL              3.7.12                               Mon Aug 10 19:55:08 2020
View the Supported Cumulus Linux Packages
When you are troubleshooting an issue with a switch, you might want to know all the supported versions of the Cumulus Linux operating system that are available for that switch and on a switch that is not having the same issue.
To view package information for your switches, run:
netq show cl-manifest [json]
This example shows the OS packages supported for all switches.
cumulus@switch:~$ netq show cl-manifest

Matching manifest records:
Hostname          ASIC Vendor          CPU Arch             Manifest Version
----------------- -------------------- -------------------- --------------------
border01          vx                   x86_64               3.7.6.1
border01          vx                   x86_64               3.7.10
border01          vx                   x86_64               3.7.11
border01          vx                   x86_64               3.6.2.1
...
fw1               vx                   x86_64               3.7.6.1
fw1               vx                   x86_64               3.7.10
fw1               vx                   x86_64               3.7.11
fw1               vx                   x86_64               3.6.2.1
...
leaf01            vx                   x86_64               4.1.0
leaf01            vx                   x86_64               4.0.0
leaf01            vx                   x86_64               3.6.2
leaf01            vx                   x86_64               3.7.2
...
leaf02            vx                   x86_64               3.7.6.1
leaf02            vx                   x86_64               3.7.10
leaf02            vx                   x86_64               3.7.11
leaf02            vx                   x86_64               3.6.2.1
...
View All Software Packages Installed
If you are having an issue with several switches, you should verify all the packages installed on them and compare that to the recommended packages for a given Cumulus Linux release.
To view installed package information for your switches, run:
netq show cl-pkg-info [<text-package-name>] [around <text-time>] [json]
Use the text-package-name option to narrow the results to a particular package.
This example shows the installed switchd package version.
cumulus@switch:~$ netq spine01 show cl-pkg-info switchd

Matching package_info records:
Hostname          Package Name             Version              CL Version           Package Status       Last Changed
----------------- ------------------------ -------------------- -------------------- -------------------- -------------------------
spine01           switchd                  1.0-cl3u40           Cumulus Linux 3.7.12 installed            Thu Aug 27 01:58:47 2020
View Recommended Software Packages
You can determine whether any of your switches are using a software package other than the default package associated with the Cumulus Linux release that is running on the switches. Use this list to determine which packages to install/upgrade on all devices. Additionally, you can determine if a software package is missing.
To view recommended package information for your switches, run:
netq show recommended-pkg-version [release-id <text-release-id>] [package-name <text-package-name>] [json]
The output can be rather lengthy if you run this command for all releases and packages. If desired, run the command using the release-id and/or package-name options to shorten the output.
This example looks for switches running Cumulus Linux 3.7.1 and switchd. The result is a single switch, leaf12, that has older software and should get an update.
cumulus@switch:~$ netq show recommended-pkg-version release-id 3.7.1 package-name switchd
Matching manifest records:
Hostname          Release ID           ASIC Vendor          CPU Arch             Package Name         Version              Last Changed
----------------- -------------------- -------------------- -------------------- -------------------- -------------------- -------------------------
leaf12            3.7.1                vx                   x86_64               switchd              1.0-cl3u30           Wed Feb  5 04:36:30 2020
This example looks for switches running Cumulus Linux 3.7.1 and ptmd. The result is a single switch, server01, that has older software and should get an update.
cumulus@switch:~$ netq show recommended-pkg-version release-id 3.7.1 package-name ptmd
Matching manifest records:
Hostname          Release ID           ASIC Vendor          CPU Arch             Package Name         Version              Last Changed
----------------- -------------------- -------------------- -------------------- -------------------- -------------------- -------------------------
server01            3.7.1                vx                   x86_64               ptmd                 3.0-2-cl3u8          Wed Feb  5 04:36:30 2020
This example looks for switches running Cumulus Linux 3.7.1 and lldpd. The result is a single switch, server01, that has older software and should get an update.
cumulus@switch:~$ netq show recommended-pkg-version release-id 3.7.1 package-name lldpd
Matching manifest records:
Hostname          Release ID           ASIC Vendor          CPU Arch             Package Name         Version              Last Changed
----------------- -------------------- -------------------- -------------------- -------------------- -------------------- -------------------------
server01            3.7.1                vx                   x86_64               lldpd                0.9.8-0-cl3u11       Wed Feb  5 04:36:30 2020
This example looks for switches running Cumulus Linux 3.6.2 and switchd. The result is a single switch, leaf04, that has older software and should get an update.
cumulus@noc-pr:~$ netq show recommended-pkg-version release-id 3.6.2 package-name switchd
Matching manifest records:
Hostname          Release ID           ASIC Vendor          CPU Arch             Package Name         Version              Last Changed
----------------- -------------------- -------------------- -------------------- -------------------- -------------------- -------------------------
leaf04            3.6.2                vx                   x86_64               switchd              1.0-cl3u27           Wed Feb  5 04:36:30 2020
View ACL Resources
Using the NetQ CLI, you can monitor the incoming and outgoing access control lists (ACLs) configured on all switches, currently or at a time in the past.
To view ACL resources for all your switches, run:
netq show cl-resource acl [ingress | egress] [around <text-time>] [json]
Use the egress or ingress options to show only the outgoing or incoming ACLs.
This example shows the ACL resources for all configured switches:
cumulus@switch:~$ netq show cl-resource acl
Matching cl_resource records:
Hostname          In IPv4 filter       In IPv4 Mangle       In IPv6 filter       In IPv6 Mangle       In 8021x filter      In Mirror            In PBR IPv4 filter   In PBR IPv6 filter   Eg IPv4 filter       Eg IPv4 Mangle       Eg IPv6 filter       Eg IPv6 Mangle       ACL Regions          18B Rules Key        32B Rules Key        54B Rules Key        L4 Port range Checke Last Updated
                                                                                                                                                                                                                                                                                                                                                                  rs
----------------- -------------------- -------------------- -------------------- -------------------- -------------------- -------------------- -------------------- -------------------- -------------------- -------------------- -------------------- -------------------- -------------------- -------------------- -------------------- -------------------- -------------------- ------------------------
act-5712-09       40,512(7%)           0,0(0%)              30,768(3%)           0,0(0%)              0,0(0%)              0,0(0%)              0,0(0%)              0,0(0%)              32,256(12%)          0,0(0%)              0,0(0%)              0,0(0%)              0,0(0%)              0,0(0%)              0,0(0%)              0,0(0%)              2,24(8%)             Tue Aug 18 20:20:39 2020
mlx-2700-04       0,0(0%)              0,0(0%)              0,0(0%)              0,0(0%)              0,0(0%)              0,0(0%)              0,0(0%)              0,0(0%)              0,0(0%)              0,0(0%)              0,0(0%)              0,0(0%)              4,400(1%)            2,2256(0%)           0,1024(0%)           2,1024(0%)           0,0(0%)              Tue Aug 18 20:19:08 2020
View Forwarding Resources
To view forwarding resources for all your switches, run:
netq show cl-resource forwarding [around <text-time>] [json]
This example shows forwarding resources for all configured switches:
cumulus@noc-pr:~$ netq show cl-resource forwarding
Matching cl_resource records:
Hostname          IPv4 host entries    IPv6 host entries    IPv4 route entries   IPv6 route entries   ECMP nexthops        MAC entries          Total Mcast Routes   Last Updated
----------------- -------------------- -------------------- -------------------- -------------------- -------------------- -------------------- -------------------- ------------------------
act-5712-09       0,16384(0%)          0,0(0%)              0,131072(0%)         23,20480(0%)         0,16330(0%)          0,32768(0%)          0,8192(0%)           Tue Aug 18 20:20:39 2020
mlx-2700-04       0,32768(0%)          0,16384(0%)          0,65536(0%)          4,28672(0%)          0,4101(0%)           0,40960(0%)          0,1000(0%)           Tue Aug 18 20:19:08 2020
View NetQ Agents
To view the NetQ Agents on all switches and hosts:
Click
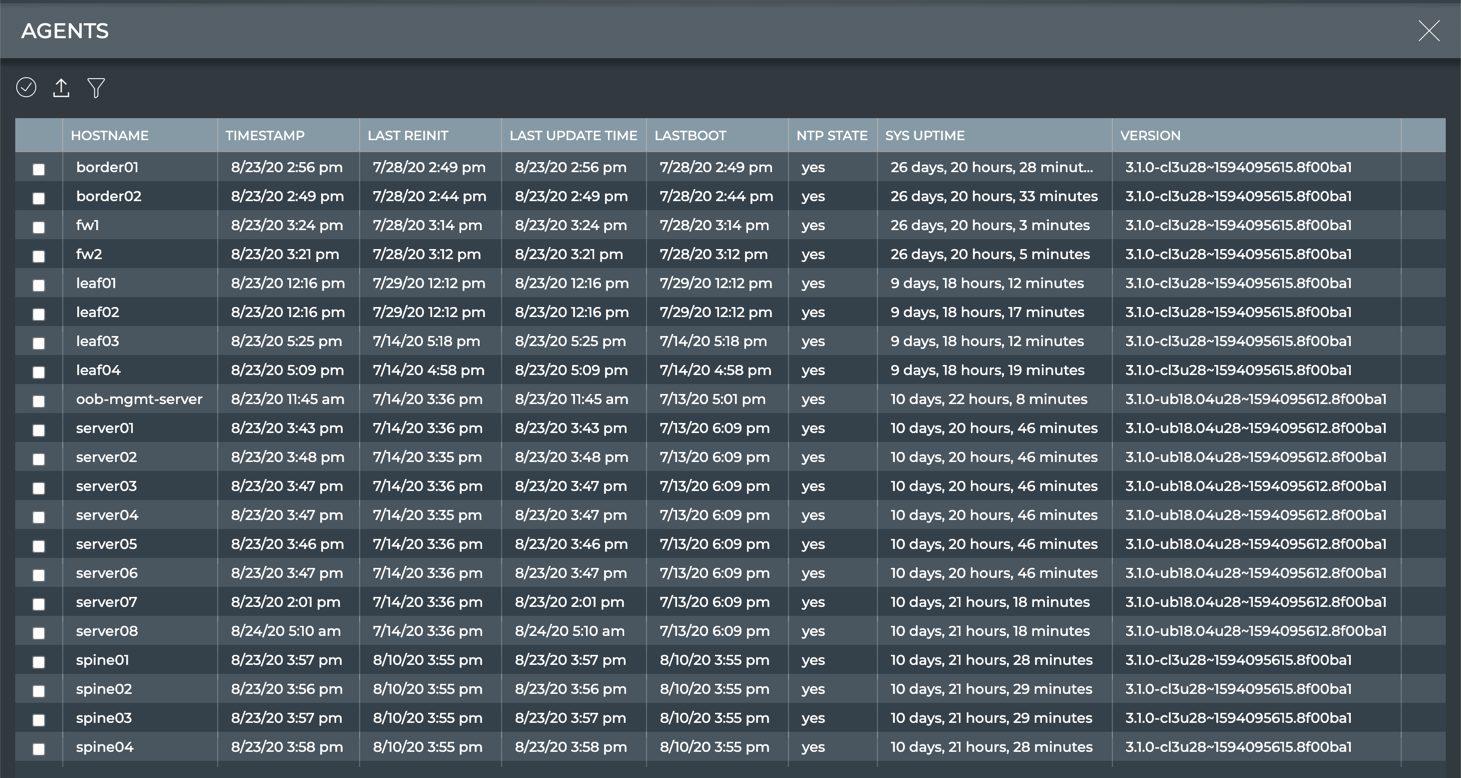
Menu.Select Agents from the Network column.
View the Version column to determine which release of the NetQ Agent is running on your devices. Ideally, this version should be the same as the NetQ release you are running, and is the same across all your devices.
| Parameter | Description |
|---|---|
| Hostname | Name of the switch or host |
| Timestamp | Date and time the data was captured |
| Last Reinit | Date and time that the switch or host was reinitialized |
| Last Update Time | Date and time that the switch or host was updated |
| Lastboot | Date and time that the switch or host was last booted up |
| NTP State | Status of NTP synchronization on the switch or host; yes = in synchronization, no = out of synchronization |
| Sys Uptime | Amount of time the switch or host has been continuously up and running |
| Version | NetQ version running on the switch or host |
To view the NetQ Agents on all switches and hosts, run:
netq show agents [fresh | rotten ] [around <text-time>] [json]
Use the fresh keyword to view only the NetQ Agents that are in current communication with the NetQ Platform or NetQ Collector. Use the rotten keyword to view those that are not.