Monitor DPUs
DPU monitoring is an early access feature.
With the NetQ UI, you can monitor hardware resources of individual data processing units (DPUs), including CPU utilization, disk usage, and memory utilization.
View Overall Health of a DPU
For an overview of the current or past health of DPU hardware resources, open the DPU device card. To open a DPU device card:
- Click
 Devices in the header, then click Open a device card.
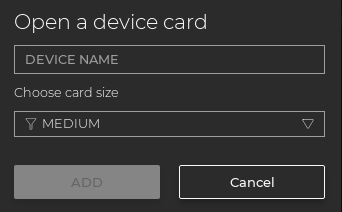
- Begin typing the hostname of the DPU you would like to view. Select it from the suggested matches when it appears.
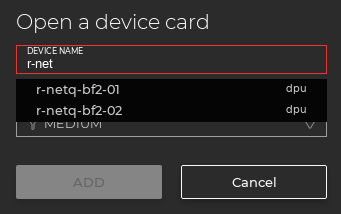
Click Add.
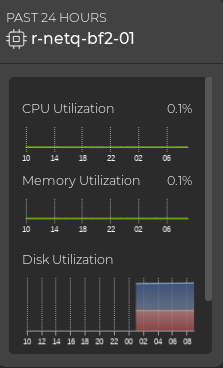
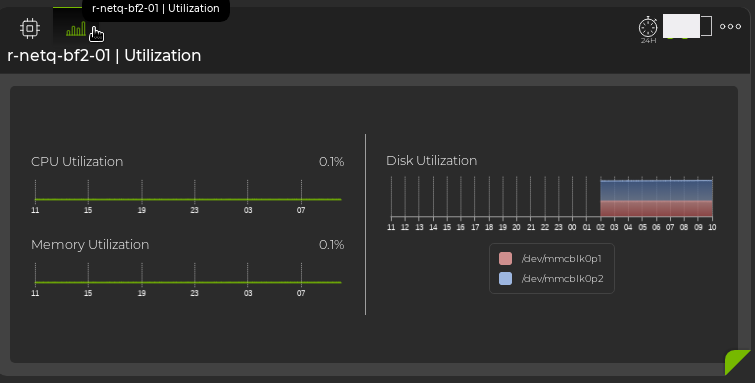
This example shows that the r-netq-bf2-01 DPU has low utilization across CPU, memory, and disks.
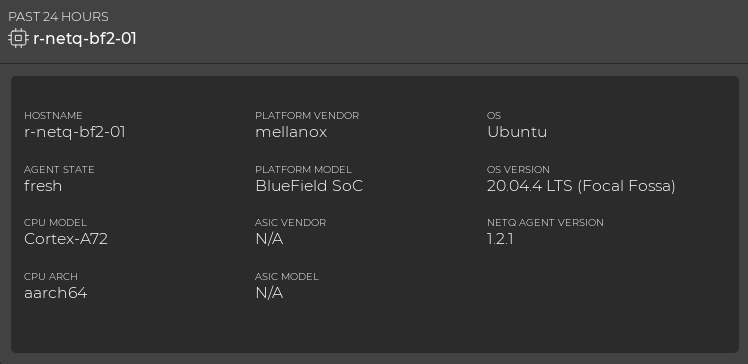
View DPU Attributes
For a quick look at the key attributes of a particular DPU, expand the DPU card using the card size picker.
Attributes are displayed as the default tab on the large DPU card. You can view the static information about the DPU, including its hostname, ASIC vendor and model, CPU information, OS version, and agent version.
To view a larger display of hardware resource utilization, select ![]() (Utilization).
(Utilization).
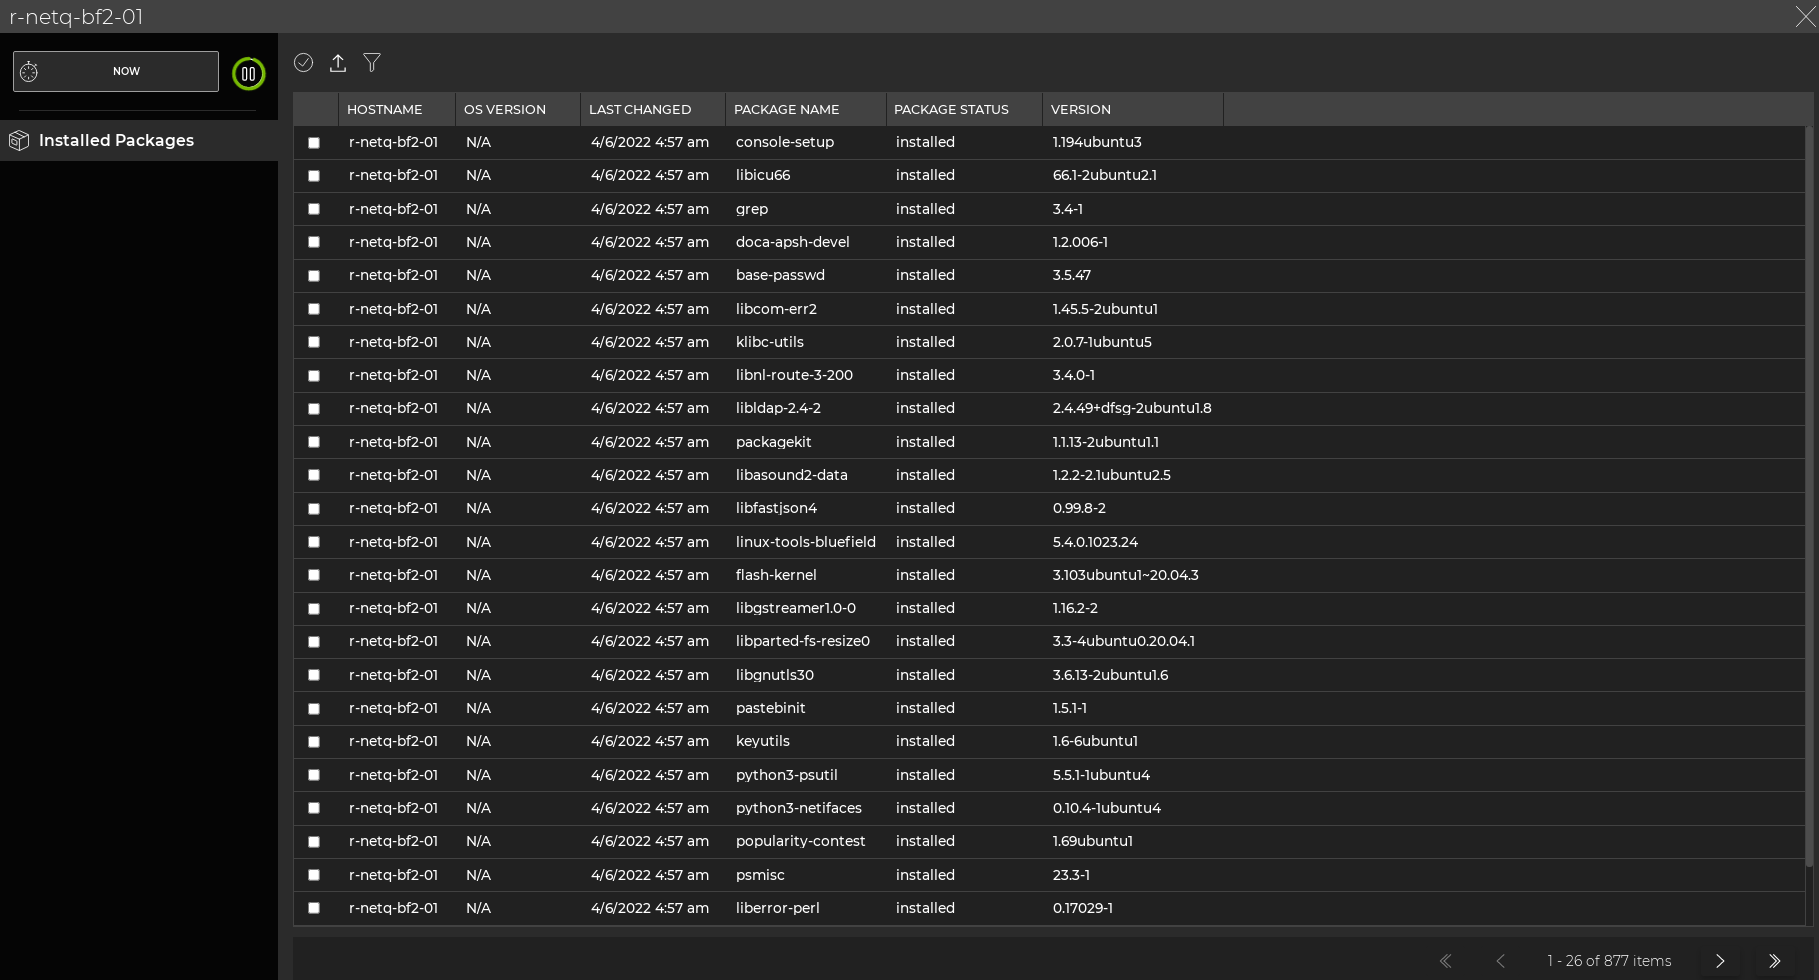
View Installed Packages
To view the list of installed packages on a particular DPU, expand the card to its largest size using the card size picker.
Installed packages are displayed in a table. You can export the table into other file formats by selecting ![]() (Export), and you can filter the table by selecting
(Export), and you can filter the table by selecting ![]() (Filter).
(Filter).