Monitor Switches
With the NetQ UI and NetQ CLI, you can monitor the health of individual switches, including interface performance and resource utilization.
NetQ reports switch performance metrics for three categories:
- System configuration: events, interfaces, IP and MAC addresses, VLANs, IP routes, IP neighbors, and installed software packages
- Utilization statistics: CPU, memory, disk, ACL and forwarding resources, SSD, and BTRFS
- Physical sensing: digital optics and chassis sensors
For switch inventory information (ASIC, platform, CPU, memory, disk, and OS), refer to Switch Inventory.
View Switch Metrics and Attributes
To view events, metrics, and attributes per switch, open the Switch card:
Select
 Devices in the header, then click Open a device card.
Begin typing the switch’s hostname and select it from the list:
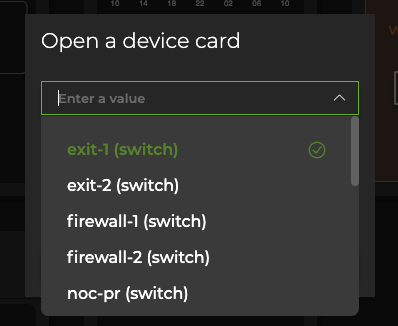
Click Add.
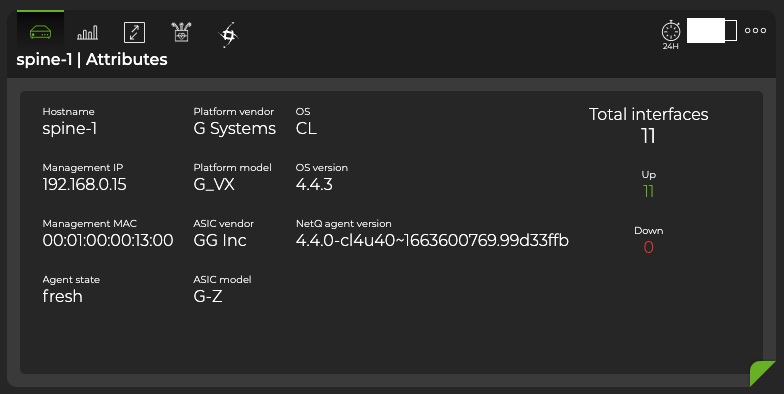
Adjust the card’s size to view information at different levels of granularity.
Attributes are displayed as the default tab on the large Switch card. You can view the static information about the switch, including its hostname, addresses, server and ASIC vendors and models, OS and NetQ software information. You can also view the state of the interfaces and NetQ Agent on the switch.
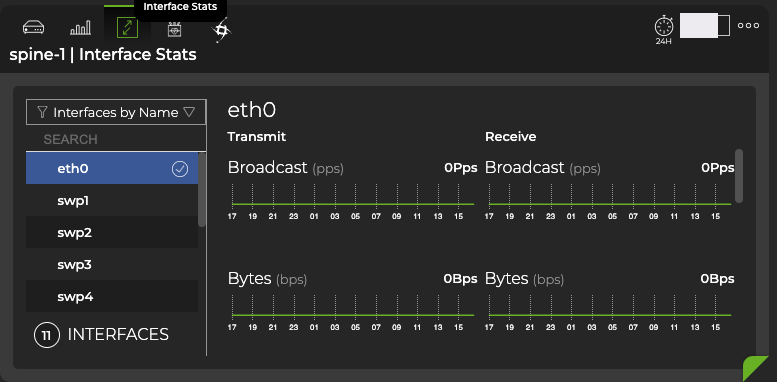
Hover over the top of the card, then select the appropriate icon to view utilization info, interface statistics, digital optics info, and RoCe metrics as graphs. The following card shows interface statistics:
View System Configuration in the UI
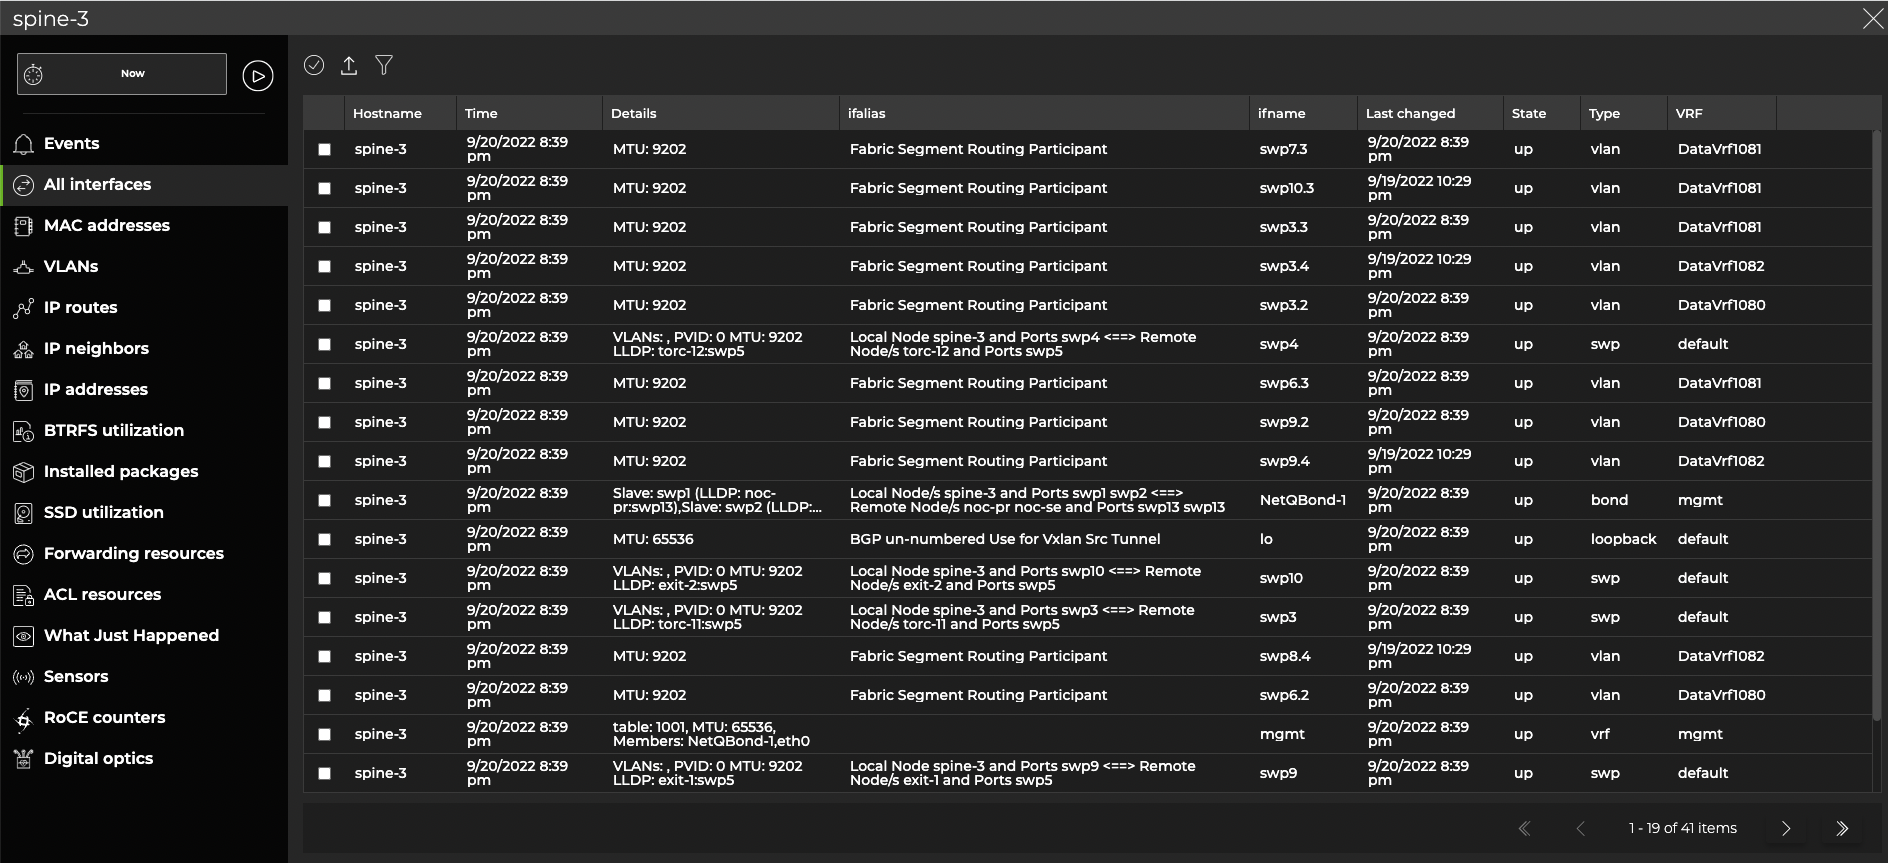
To view additional information in the NetQ UI, open a Switch card, then expand it to the full-screen view. From here, you can filter, sort, and view information about events, interfaces, MAC addresses, VLANs, IP routes, IP neighbors, IP addresses, BTRFS utilization, software packages, SSD utilization, forwarding resources, ACL resources, What Just Happened events, sensors, RoCE counters, and digital optics.
View System Configuration in the CLI
View All Switch Events
To view all events on the switch, run:
netq [<hostname>] show events [severity info | severity error ] [between <text-time> and <text-endtime>] [json]
View Compute Resources Utilization
You can view the current utilization of CPU, memory, and disk resources to determine whether a switch is reaching its maximum load and compare its performance with other switches.
To determine how many compute resources the switches on your network consume, run:
netq <hostname> show resource-util [cpu | memory] [around <text-time>] [json]
netq <hostname> show resource-util disk [<text-diskname>] [around <text-time>] [json]
When no options are included the output shows the percentage of CPU and memory being consumed as well as the amount and percentage of disk space being consumed.
This example shows only the disk utilization for the leaf01 switch. If you have more than one disk in your switch, the output displays utilization data for all disks. If you want to view the data for only one of the disks, you must specify a disk name.
cumulus@switch:~$ netq leaf01 show resource-util disk
Matching resource_util records:
Hostname          Disk Name            Total                Used                 Disk Utilization     Last Updated
----------------- -------------------- -------------------- -------------------- -------------------- ------------------------
leaf01            /dev/vda4            6170849280           1230393344           20.9                 Wed Sep 16 20:54:14 2020
View Status of All Interfaces
You can view all interfaces or filter by the interface type.
To view all interfaces, run:
netq <hostname> show interfaces [<remote-interface>] [state <remote-interface-state>] [around <text-time>] [count] [json]
To view interfaces of a particular type, run:
netq <hostname> show interfaces type (bond|bridge|eth|loopback|macvlan|swp|vlan|vrf|vxlan) [state <remote-interface-state>] [around <text-time>] [count] [json]
View Interface Statistics and Utilization
NetQ Agents collect performance statistics every 30 seconds for the physical interfaces on switches in your network. The NetQ Agent does not collect statistics for non-physical interfaces, such as bonds, bridges, and VXLANs. The NetQ Agent collects:
- Statistics
- Transmit: tx_bytes, tx_carrier, tx_colls, tx_drop, tx_errs, tx_packets
- Receive: rx_bytes, rx_drop, rx_errs, rx_frame, rx_multicast, rx_packets
- Utilization
- rx_util, tx_util
- port speed
To view the interface statistics and utilization, run:
netq <hostname> show interface-stats [errors | all] [<physical-port>] [around <text-time>] [json]
netq <hostname> show interface-utilization [<text-port>] [tx|rx] [around <text-time>] [json]
Where the various options are:
hostnamelimits the output to a particular switcherrorslimits the output to only the transmit and receive errors found on the designated interfacesphysical-portlimits the output to a particular portaroundenables viewing of the data at a time in the pastjsonoutputs results in JSON formattext-portlimits output to a particular host and port; this option requires ahostnametx,rxlimits output to the transmit or receive values, respectively
View All MAC Addresses on a Switch
You can view all MAC addresses on a switch, or filter the list to view a particular address, only the addresses on the egress port, a particular VLAN, or those that are owned by the switch. You can also view the number addresses.
Use the following commands to obtain this MAC address information:
netq <hostname> show macs [<mac>] [vlan <1-4096>] [origin | count] [around <text-time>] [json]
netq <hostname> show macs egress-port <egress-port> [<mac>] [vlan <1-4096>] [origin] [around <text-time>] [json]
This example shows the total number of MAC address on the leaf01 switch:
cumulus@switch:~$ netq leaf01 show macs count
Count of matching mac records: 55
This example shows the addresses on the bridge egress port on the leaf01 switch:
cumulus@switch:~$ netq leaf01 show macs egress-port bridge
Matching mac records:
Origin MAC Address        VLAN   Hostname          Egress Port                    Remote Last Changed
------ ------------------ ------ ----------------- ------------------------------ ------ -------------------------
yes    00:00:00:00:00:1a  10     leaf01            bridge                         no     Thu Sep 17 16:16:11 2020
yes    44:38:39:00:00:59  4001   leaf01            bridge                         no     Thu Sep 17 16:16:11 2020
yes    44:38:39:00:00:59  30     leaf01            bridge                         no     Thu Sep 17 16:16:11 2020
yes    44:38:39:00:00:59  20     leaf01            bridge                         no     Thu Sep 17 16:16:11 2020
yes    44:38:39:00:00:59  4002   leaf01            bridge                         no     Thu Sep 17 16:16:11 2020
yes    44:38:39:00:00:59  10     leaf01            bridge                         no     Thu Sep 17 16:16:11 2020
yes    44:38:39:be:ef:aa  4001   leaf01            bridge                         no     Thu Sep 17 16:16:11 2020
yes    44:38:39:be:ef:aa  4002   leaf01            bridge                         no     Thu Sep 17 16:16:11 2020
yes    00:00:00:00:00:1b  20     leaf01            bridge                         no     Thu Sep 17 16:16:11 2020
yes    00:00:00:00:00:1c  30     leaf01            bridge                         no     Thu Sep 17 16:16:11 2020
View All VLANs on a Switch
To view all VLANs on a switch, run:
netq <hostname> show interfaces type vlan [state <remote-interface-state>] [around <text-time>] [count] [json]
Filter the output for VLANs with state option to view VLANs that are up or down, the around option to view VLAN information for a time in the past, or the count option to view the total number of VLANs on the device.
This example shows the total number of VLANs on the leaf01 switch:
cumulus@switch:~$ netq leaf01 show interfaces type vlan count
Count of matching link records: 6
This example shows the VLANs on the leaf01 switch that are down:
cumulus@switch:~$ netq leaf01 show interfaces type vlan state down
No matching link records found
View All IP Routes on a Switch
To view all IPv4 and IPv6 routes or only IPv4 routes on a switch, run:
netq show ip routes [<ipv4>|<ipv4/prefixlen>] [vrf <vrf>] [origin] [around <text-time>] [json]
You can filter the output with the following options:
ipv4oripv4/prefixlento view a particular IPv4 route on the switchvrfto view routes using a given VRForiginto view routes that the switch ownsaroundto view routes at a time in the past
The following example shows information for the IPv4 route at 10.10.10.1 on the spine01 switch:
cumulus@switch:~$ netq spine01 show ip routes 10.10.10.1

Matching routes records:
Origin VRF             Prefix                         Hostname          Nexthops                            Last Changed
------ --------------- ------------------------------ ----------------- ----------------------------------- -------------------------
no     default         10.10.10.1/32                  spine01           169.254.0.1: swp1,                  Wed Sep 16 19:57:26 2020
                                                                        169.254.0.1: swp2
View All IP Neighbors on a Switch
To view all IP neighbors on a switch, run:
netq <hostname> show ip neighbors [<remote-interface>] [<ipv4>|<ipv4> vrf <vrf>|vrf <vrf>] [<mac>] [around <text-time>] [count] [json]
You can filter the output with the following options:
ipv4,ipv4 vrf, orvrfto view the neighbor with a given IPv4 address, the neighbor with a given IPv4 address and VRF, or all neighbors using a given VRF on the switchmacto view the neighbor with a given MAC addresscountto view the total number of known IP neighborsaroundto view neighbors at a time in the past
The following example shows the neighbor with a MAC address of 44:38:39:00:00:0b on the leaf02 switch:
cumulus@switch:~$ netq leaf02 show ip neighbors 44:38:39:00:00:0b
Matching neighbor records:
IP Address                Hostname          Interface                 MAC Address        VRF             Remote Last Changed
------------------------- ----------------- ------------------------- ------------------ --------------- ------ -------------------------
169.254.0.1               leaf02            swp52                     44:38:39:00:00:0b  default         no     Thu Sep 17 20:25:16 2020
This example shows the neighbor with an IP address of 10.1.10.2 on the leaf02 switch:
cumulus@switch:~$ netq leaf02 show ip neighbors 10.1.10.2
Matching neighbor records:
IP Address                Hostname          Interface                 MAC Address        VRF             Remote Last Changed
------------------------- ----------------- ------------------------- ------------------ --------------- ------ -------------------------
10.1.10.2                 leaf02            vlan10                    44:38:39:00:00:59  RED             no     Thu Sep 17 20:25:14 2020
View All IP Addresses on a Switch
To view all IP addresses on a switch, run:
netq <hostname> show ip addresses [<remote-interface>] [<ipv4>|<ipv4/prefixlen>] [vrf <vrf>] [around <text-time>] [count] [json]
You can filter the output with the following options:
ipv4oripv4/prefixlento view a particular IPv4 address on the switchvrfto view addresses using a given VRFcountto view the total number of known IP neighborsaroundto view addresses at a time in the past
This example shows all IP addresses using the BLUE VRF on the leaf03 switch:
cumulus@switch:~$ netq leaf03 show ip addresses vrf BLUE
Matching address records:
Address                   Hostname          Interface                 VRF             Last Changed
------------------------- ----------------- ------------------------- --------------- -------------------------
10.1.30.1/24              leaf03            vlan30-v0                 BLUE            Thu Sep 17 20:25:09 2020
10.1.30.2/24              leaf03            vlan30                    BLUE            Thu Sep 17 20:25:08 2020
View Disk Storage After BTRFS Allocation
Customers running Cumulus Linux 3 which uses the BTRFS (b-tree file system) might experience issues with disk space management. This is a known problem of BTRFS because it does not perform periodic garbage collection, or rebalancing. If left unattended, these errors can make it impossible to rebalance the partitions on the disk. To avoid this issue, NVIDIA recommends rebalancing the BTRFS partitions preemptively, but only when absolutely needed to avoid reduction in the lifetime of the disk. By tracking the state of the disk space usage, users can determine when they should rebalance.
For details about when to perform a recommended rebalance, refer to When to Rebalance BTRFS Partitions.
To view the disk utilization and check whether a rebalance is recommended, run:
netq show cl-btrfs-util [around <text-time>] [json]
This example shows the utilization on the leaf01 switch:
cumulus@switch:~$ netq leaf01 show cl-btrfs-info
Matching btrfs_info records:
Hostname          Device Allocated     Unallocated Space    Largest Chunk Size   Unused Data Chunks S Rebalance Recommende Last Changed
                                                                                 pace                 d
----------------- -------------------- -------------------- -------------------- -------------------- -------------------- -------------------------
leaf01            37.79 %              3.58 GB              588.5 MB             771.91 MB            yes                  Wed Sep 16 21:25:17 2020
Look for the Rebalance Recommended column. If the value in that column says Yes, then you are strongly encouraged to rebalance the BTRFS partitions. If it says No, then you can review the other values in the output to determine if you are getting close to needing a rebalance, and come back to view this data at a later time.
View All Software Packages
To view software package information for a switch, run:
netq <hostname> show cl-pkg-info [<text-package-name>] [around <text-time>] [json]
Use the text-package-name option to narrow the results to a particular package or the around option to narrow the output to a particular time range.
This example shows the ntp package on the spine01 switch.
cumulus@switch:~$ netq spine01 show cl-pkg-info ntp
Matching package_info records:
Hostname          Package Name             Version              CL Version           Package Status       Last Changed
----------------- ------------------------ -------------------- -------------------- -------------------- -------------------------
spine01           ntp                      1:4.2.8p10-cl3u2     Cumulus Linux 3.7.12 installed            Wed Aug 26 19:58:45 2020
View SSD Utilization
For NetQ Appliances that have 3ME3 solid state drives (SSDs) installed (primarily in on-premises deployments), you can view the utilization of the drive on-demand. NetQ generates an event for drives that drop below 10% health, or have more than a 2% loss of health in 24 hours, indicating the need to rebalance the drive.
To view SDD utilization, run:
netq <hostname> show cl-ssd-util [around <text-time>] [json]
This example shows the utilization for spine02 which has this type of SSD.
cumulus@switch:~$ netq spine02 show cl-ssd-util
Hostname        Remaining PE Cycle (%)  Current PE Cycles executed      Total PE Cycles supported       SSD Model               Last Changed
spine02         80                      576                             2880                            M.2 (S42) 3ME3          Thu Oct 31 00:15:06 2019
This output indicates that this drive is in a good state overall with 80% of its PE cycles remaining.
View Forwarding Resources
To view forwarding resources utilization on a switch, run:
netq <hostname> show cl-resource forwarding [around <text-time>] [json]
This example shows the forwarding resources used by the spine02 switch:
cumulus@switch:~$ netq spine02 show cl-resource forwarding
Matching cl_resource records:
Hostname          IPv4 host entries    IPv6 host entries    IPv4 route entries   IPv6 route entries   ECMP nexthops        MAC entries          Total Mcast Routes   Last Updated
----------------- -------------------- -------------------- -------------------- -------------------- -------------------- -------------------- -------------------- ------------------------
spine02           9,16384(0%)          0,0(0%)              290,131072(0%)       173,20480(0%)        54,16330(0%)         26,32768(0%)         0,8192(0%)           Mon Jan 13 03:34:11 2020
View ACL Resources
You can monitor the incoming and outgoing access control lists (ACLs) configured on a switch.
Both the Switch card and netq show cl-resource acl command display the ingress/egress IPv4/IPv6 filter/mangle, ingress 802.1x filter, ingress mirror, ingress/egress PBR IPv4/IPv6 filter/mangle, ACL Regions, 18B/32B/54B Rules Key, and layer 4 port range checker.
To view ACL resource utilization on a switch, run:
netq <hostname> show cl-resource acl [ingress | egress] [around <text-time>] [json]
Use the egress or ingress options to show only the outgoing or incoming ACLs.
This example shows the ACL resources available and currently used by the leaf01 switch.
cumulus@switch:~$ netq leaf01 show cl-resource acl
Matching cl_resource records:
Hostname          In IPv4 filter       In IPv4 Mangle       In IPv6 filter       In IPv6 Mangle       In 8021x filter      In Mirror            In PBR IPv4 filter   In PBR IPv6 filter   Eg IPv4 filter       Eg IPv4 Mangle       Eg IPv6 filter       Eg IPv6 Mangle       ACL Regions          18B Rules Key        32B Rules Key        54B Rules Key        L4 Port range Checke Last Updated
                                                                                                                                                                                                                                                                                                                                                                  rs
----------------- -------------------- -------------------- -------------------- -------------------- -------------------- -------------------- -------------------- -------------------- -------------------- -------------------- -------------------- -------------------- -------------------- -------------------- -------------------- -------------------- -------------------- ------------------------
leaf01            36,512(7%)           0,0(0%)              30,768(3%)           0,0(0%)              0,0(0%)              0,0(0%)              0,0(0%)              0,0(0%)              29,256(11%)          0,0(0%)              0,0(0%)              0,0(0%)              0,0(0%)              0,0(0%)              0,0(0%)              0,0(0%)              2,24(8%)             Mon Jan 13 03:34:11 2020
View Chassis Health with Sensors
Fan, power supply unit (PSU), and temperature sensors provide additional data about the switch operation.
View All Sensor Information for a Switch
To view information for power supplies, fans, and temperature sensors on a switch, run:
netq <hostname> show sensors all [around <text-time>] [json]
View Only Power Supply Health
To view information from all PSU sensors or PSU sensors with a given name on a given switch, run:
netq <hostname> show sensors psu [<psu-name>] [around <text-time>] [json]
Use the psu-name option to view all PSU sensors with a particular name.
Use Tab completion to determine the names of the PSUs in your switches.
cumulus@switch:~$ netq <hostname> show sensors psu <press tab>
around  :  Go back in time to around ...
json    :  Provide output in JSON
psu1    :  Power Supply
psu2    :  Power Supply
<ENTER>
View Only Fan Health
To view information from all fan sensors or fan sensors with a given name on your switch, run:
netq <hostname> show sensors fan [<fan-name>] [around <text-time>] [json]
Use the fan-name option to view all fan sensors with a particular name.
This example shows the state of all fans with the name fan1 on the leaf02 switch.
cumulus@switch:~$ netq leaf02 show sensors fan fan1
Hostname          Name            Description                         State      Speed      Max      Min      Message                             Last Changed
----------------- --------------- ----------------------------------- ---------- ---------- -------- -------- ----------------------------------- -------------------------
leaf02            fan1            fan tray 1, fan 1                   ok         2500       29000    2500                                         Fri Apr 19 16:01:41 2019
View Only Temperature Information
To view information from all temperature sensors or temperature sensors with a given name on a switch, run:
netq <hostname> show sensors temp [<temp-name>] [around <text-time>] [json]
Use the temp-name option to view all PSU sensors with a particular name.
This example shows the state of the psu1temp1 temperature sensor on the leaf01 switch.
cumulus@switch:~$ netq leaf01 show sensors temp psu2temp1
Matching sensors records:
Hostname          Name            Description                         State      Temp     Critical Max      Min      Message                             Last Changed
----------------- --------------- ----------------------------------- ---------- -------- -------- -------- -------- ----------------------------------- -------------------------
leaf01            psu2temp1       psu2 temp sensor                    ok         25       85       80       5                                            Wed Aug 26 16:14:41 2020
View Digital Optics Health
Digital optics module information is available regarding the performance degradation or complete outage of any digital optics modules on a switch.
To view digital optics information for a switch, run one of the following:
netq <hostname> show dom type (laser_rx_power|laser_output_power|laser_bias_current) [interface <text-dom-port-anchor>] [channel_id <text-channel-id>] [around <text-time>] [json]
netq <hostname> show dom type (module_temperature|module_voltage) [interface <text-dom-port-anchor>] [around <text-time>] [json]