Topology View
NetQ lets you monitor your network by viewing performance and configuration data for individual network devices and the entire fabric networkwide. This section describes monitoring tasks you can perform from a topology view in the NetQ UI.
Access the Topology View
To open the topology view, click ![]() Topology in any workbench header. This opens the full-screen view of your network topology.
Topology in any workbench header. This opens the full-screen view of your network topology.
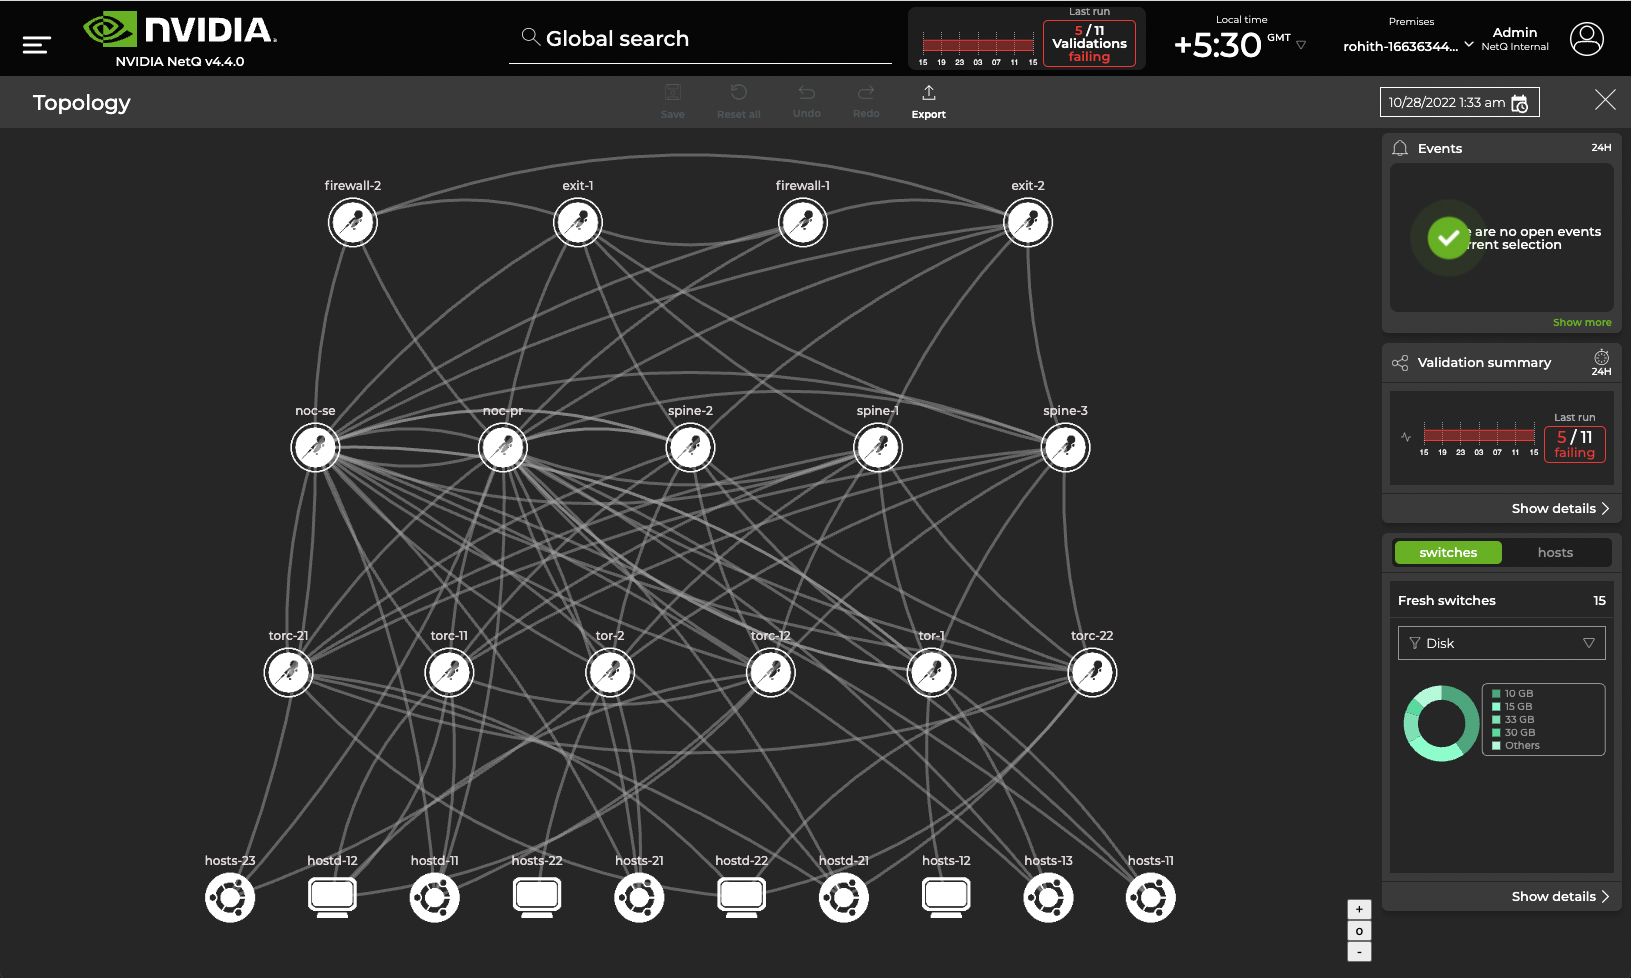
Topology Overview
The topology view provides a visual representation of your Linux network, showing the connections and device information for all monitored nodes. The topology view uses a number of icons and elements to represent the nodes and their connections:
| Symbol | Usage |
|---|---|
| Switch running Cumulus Linux OS | |
| Switch running RedHat, Ubuntu, or CentOS | |
| Host with unknown operating system | |
| Host running Ubuntu | |
| Lines | Physical links or connections |
Interact with the Topology
There are a number of ways in which you can interact with the topology.
Move the Topology Focus
You can move the focus on the topology closer to view a smaller number of nodes, or further out to view a larger number of nodes. As with mapping applications, the node labels appear and disappear as you move in and out on the diagram for better readability. To zoom, you can use:
- The zoom controls,
 , in the bottom right corner of the screen; the ‘+’ zooms you in closer, the ‘-’ moves you further out, and the ‘o’ resets to the default size.
 - A scrolling motion on your mouse.
- Your trackpad.
You can also click anywhere on the topology, and drag it left, right, up, or down to view a different portion of the network diagram.
View Data About the Network
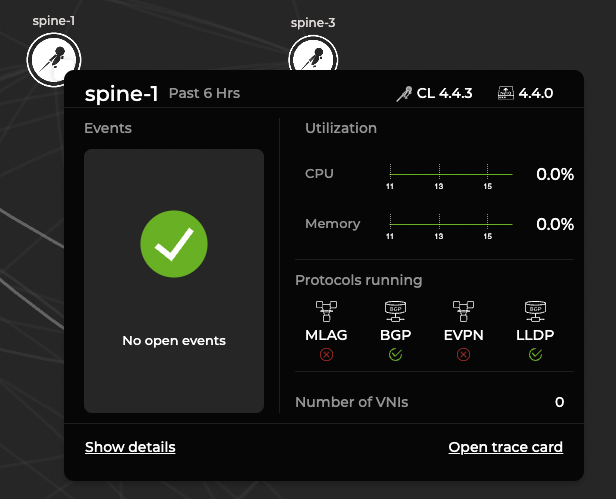
You can hover over the various elements to view data about them. Select an element to open a side panel with additional statistics.
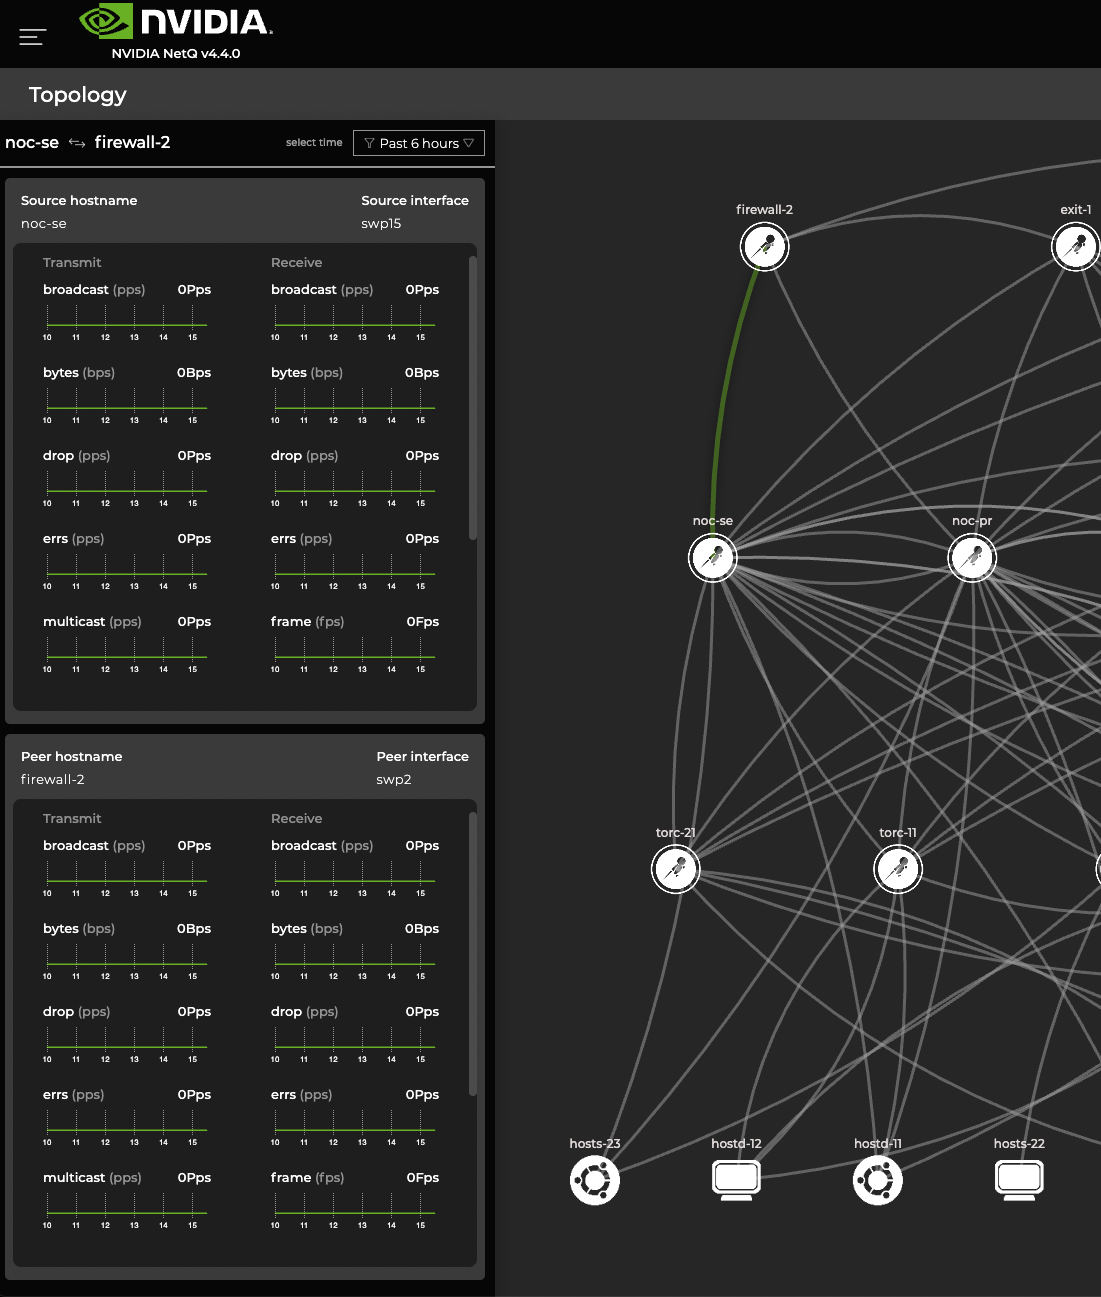
Hovering over a line highlights each end of the connection. Select the line to open a side panel with additional configuration data.
From the side panel, you can view the following data about nodes and links:
| Node Data | Description |
|---|---|
| ASIC | Name of the ASIC used in the switch. A value of Cumulus Networks VX indicates a virtual machine. |
| NetQ Agent Status | Operational status of the NetQ Agent on the switch (fresh or rotten). |
| NetQ Agent Version | Version ID of the NetQ Agent on the switch. |
| OS Name | Operating system running on the switch. |
| Platform | Vendor and name of the switch hardware. |
| Interface Statistics | Transmit and receive data. |
| Resource Utilization | CPU, memory, and disk utilization. |
| Events | Warning and info events. |
| Link Data | Description |
|---|---|
| Source | Switch where the connection originates |
| Source Interface | Port on the source switch used by the connection |
| Target | Switch where the connection ends |
| Target Interface | Port on the destination switch used by the connection |
Change the time period by selecting the timestamp box in the topology header. Adjust the time to view historic network configurations.
Click Export in the header to export your topology information as a JSON file.
Rearrange the Topology Layout
NetQ generates the network topology and positions the nodes automatically. In large topologies, the position of the nodes might not be suitable for easy viewing. You can move the components of the topology by dragging and dropping them with your mouse. You can save the new layout so other users can see it by selecting the Save icon in the header.