Integrate NetQ API with Your Applications
The NetQ API provides access to key telemetry and system monitoring data gathered about the performance and operation of your network and devices so that you can view that data in your internal or third-party analytic tools. The API gives you access to the health of individual switches, network protocols and services, trace and validation results, and views of networkwide inventory and events.
This guide provides an overview of the NetQ API framework, the basics of using Swagger UI 2.0 or bash plus curl to view and test the APIs. Descriptions of each endpoint and model parameter are in individual API JSON files.
API Organization
The NetQ API provides endpoints for:
- Network protocols: BGP, EVPN, LLDP, CLAG, MSTP, Neighbors, NTP, Routes
- Virtual networks: VLAN
- Services: Services
- Interfaces: Interface, Port
- Trace and validation: Trace, Check
- Inventory and Devices: Address, Inventory, MAC Address tables, Node, Sensors
- Events: Events
Each endpoint has its own API. You can make requests for all data and all devices or you can filter the request by a given hostname. Each API returns a predetermined set of data as defined in the API models.
The Swagger interface displays both public and internal APIs. Public APIs do not have internal in their name. Internal APIs are not supported for public use and subject to change without notice.
Get Started
You can access the API gateway and execute requests from the Swagger UI or a terminal interface:
Download Swagger UI 2.0.
Open a new browser tab or window, and enter one of the following in the address bar:
- Cloud deployments: https://api.netq.nvidia.com/swagger/
- On-premises deployments: https://<hostname-or-ipaddr>/swagger/
- Cumulus in the Cloud (CITC): https://api.air.netq.nvidia.com/swagger/
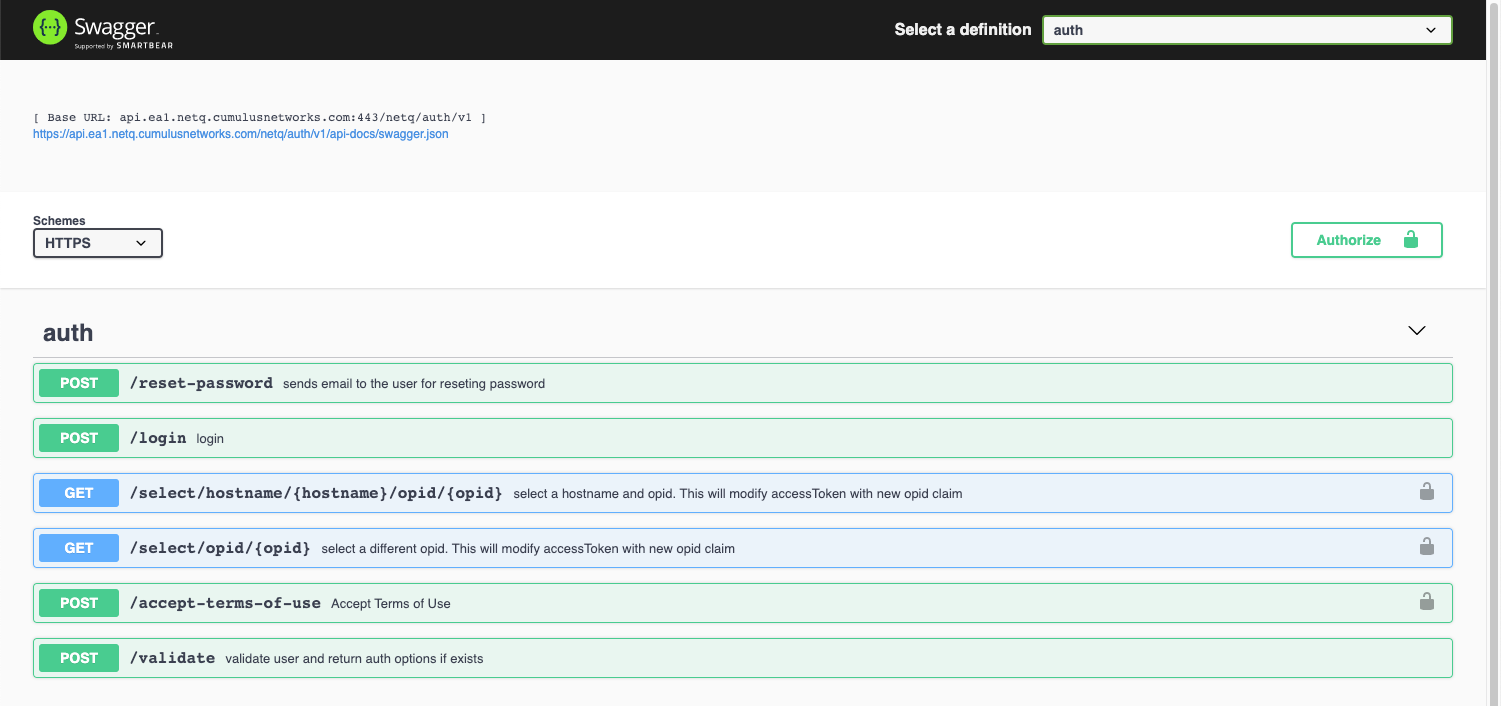
This opens the Swagger interface.
Select auth from the Select a definition dropdown at the top right of the window. This opens the authorization API.
Open a terminal window.
Continue to Log In instructions.
Log In
While you can view the API endpoints without authorization, you can only execute the API endpoints if you have been authorized.
You must first obtain an access key and then use that key to authorize your access to the API.
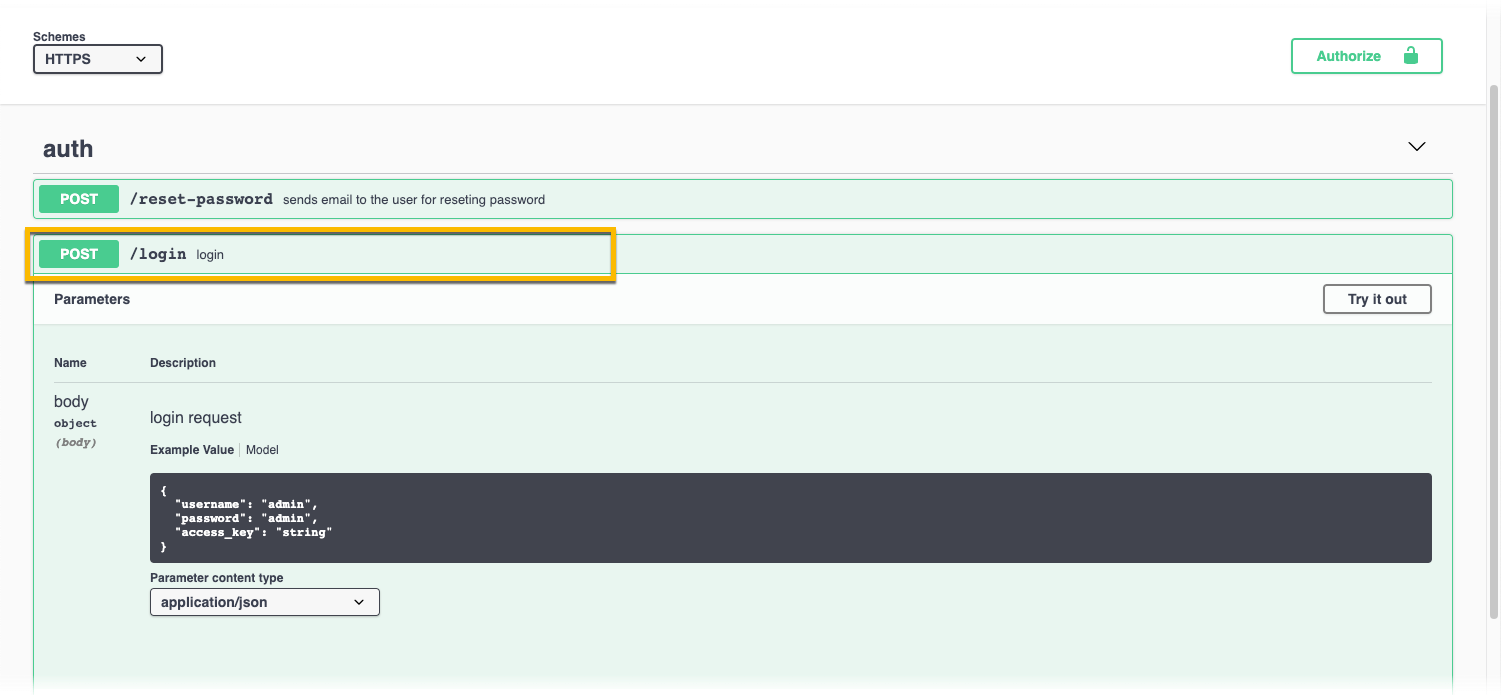
- Click POST/login.
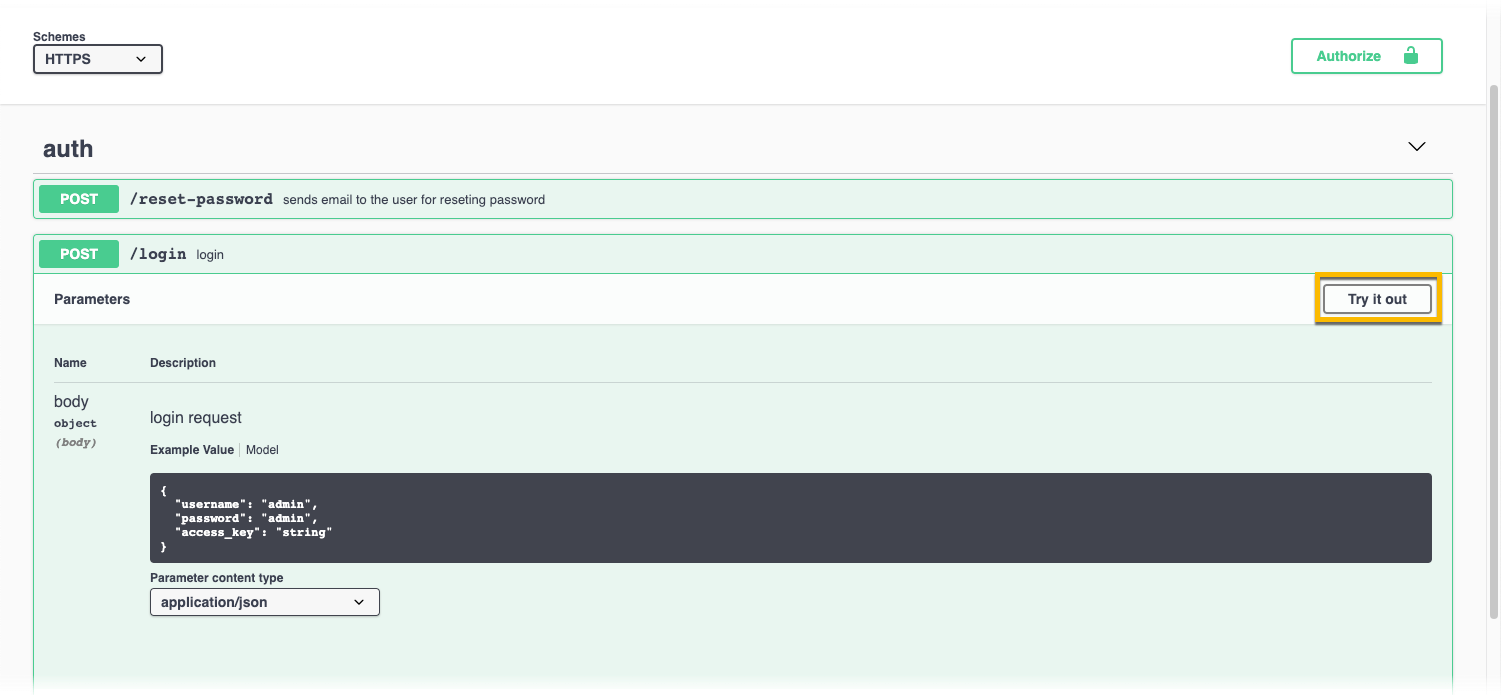
- Click Try it out.
- Enter the username and password you used to install NetQ. For this release, the default is username admin and password admin. Do not change the
access-keyvalue.
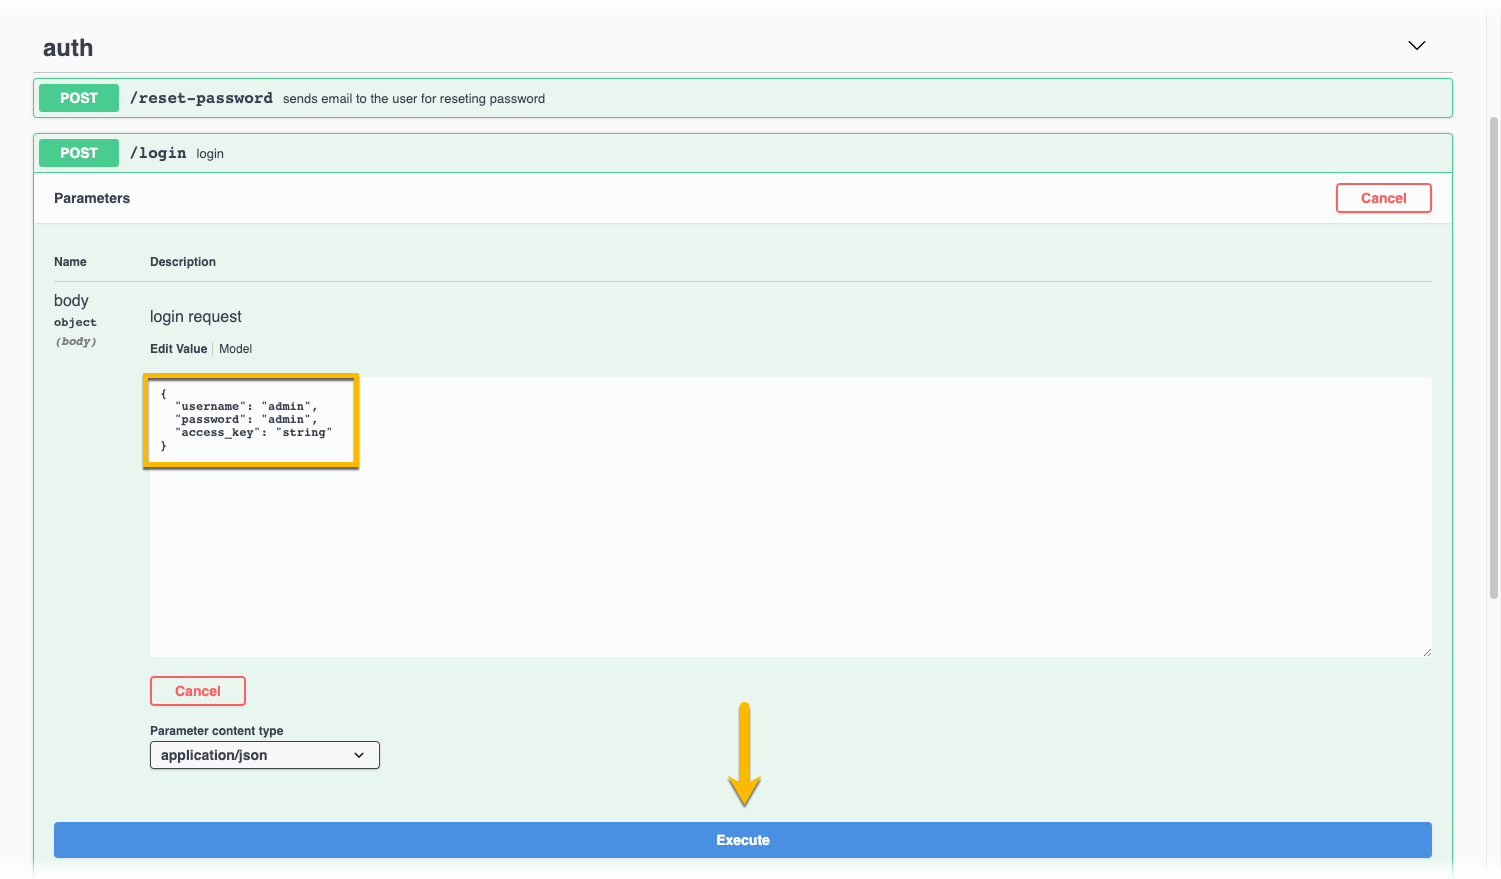
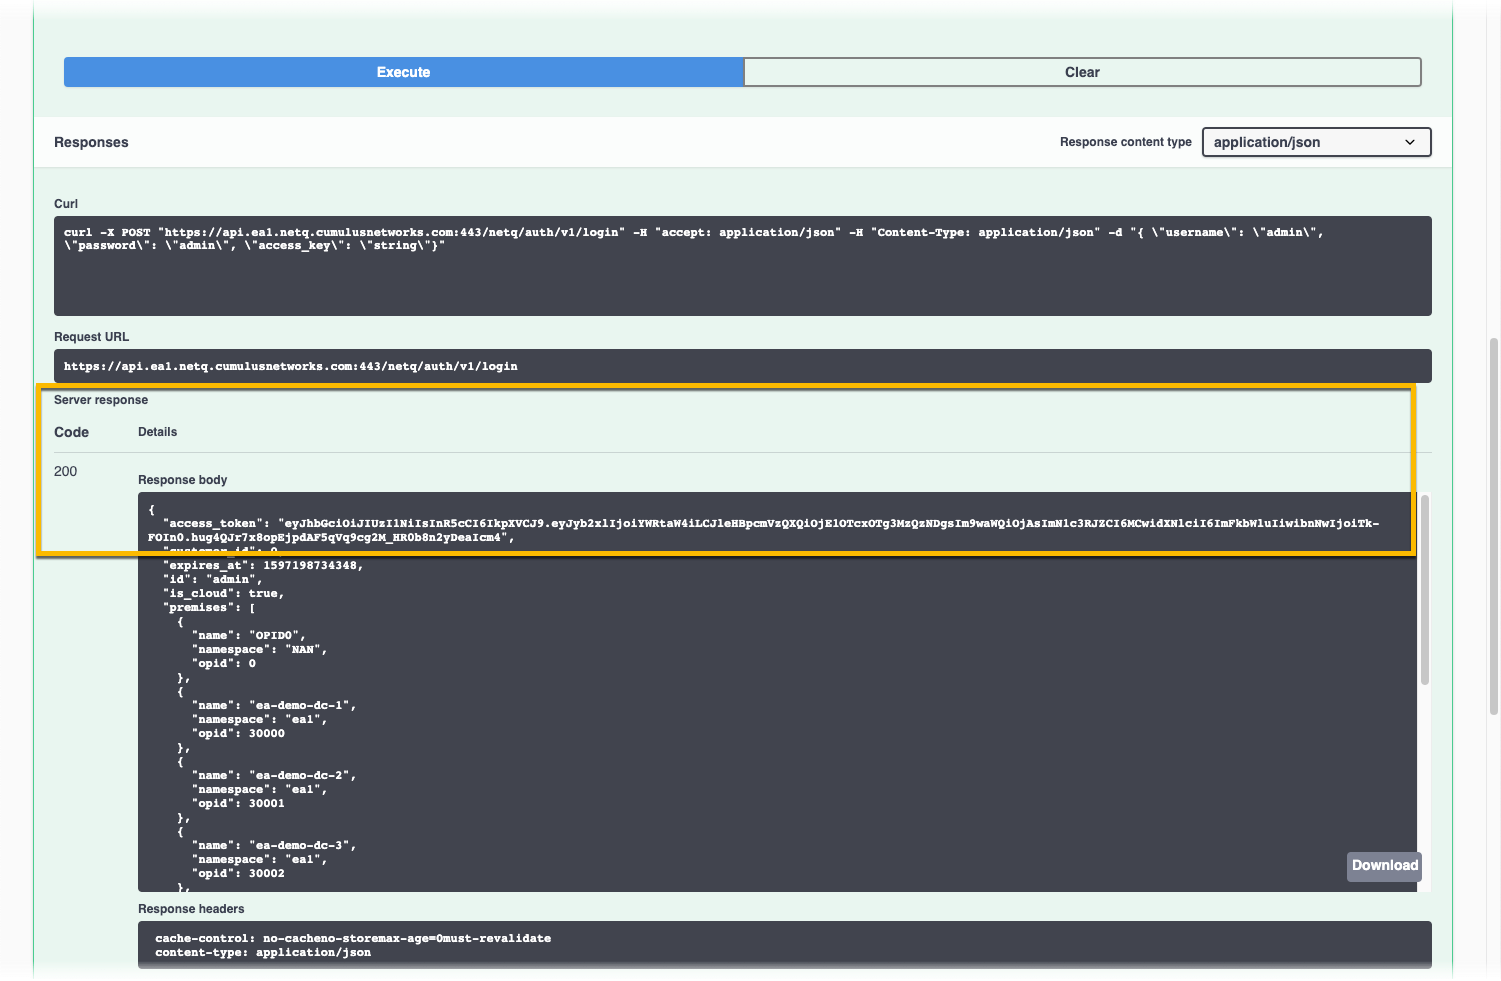
Click Execute.
Scroll down to view the Responses. In the Server response section, in the Response body of the 200 code response, copy the access token in the top line.
- Click Authorize.
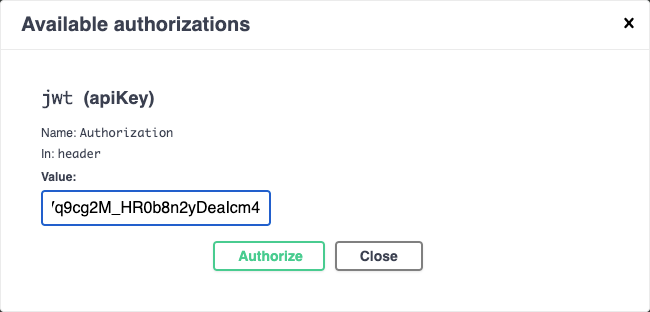
Paste the access key into the Value field, and click Authorize.
Click Close.
To log in and obtain authorization:
Open a terminal window.
Login to obtain the access token. You will need the following information:
- Hostname or IP address, and port (443 for Cloud deployments, 32708 for on-premises deployments) of your API gateway
- Your login credentials that were provided as part of the NetQ installation process. For this release, the default is username admin and password admin.
This example uses an IP address of 192.168.0.10, port of 443, and the default credentials:
<computer-name>:~ <username>$ curl -X POST "https://api.192.168.0.10.netq.nvidia.com:443/netq/auth/v1/login" -H "accept: application/json" -H "Content-Type: application/json" -d "{ \"username\": \"admin\", \"password\": \"admin\", \"access_key\": \"string\"}"The output provides the access token as the first parameter.
{"access_token":"eyJhbGciOiJIUzI1NiIsInR5cCI6IkpXVCJ9....","customer_id":0,"expires_at":1597200346504,"id":"admin","is_cloud":true,"premises":[{"name":"OPID0","namespace":"NAN","opid":0},{"name":"ea-demo-dc-1","namespace":"ea1","opid":30000},{"name":"ea-demo-dc-2","namespace":"ea1","opid":30001},{"name":"ea-demo-dc-3","namespace":"ea1","opid":30002},{"name":"ea-demo-dc-4","namespace":"ea1","opid":30003},{"name":"ea-demo-dc-5","namespace":"ea1","opid":30004},{"name":"ea-demo-dc-6","namespace":"ea1","opid":30005},{"name":"ea-demo-dc-7","namespace":"ea1","opid":80006},{"name":"Cumulus Data Center","namespace":"NAN","opid":1568962206}],"reset_password":false,"terms_of_use_accepted":true}Copy the access token to a text file for use in making API data requests.
You are now able to create and execute API requests against the endpoints.
By default, authorization is valid for 24 hours, after which users must sign in again and reauthorize their account.
API Requests
You can use either the Swagger UI or a terminal window with bash and curl commands to create and execute API requests.
API requests are easy to execute in the Swagger UI. Just select the endpoint of interest and try it out.
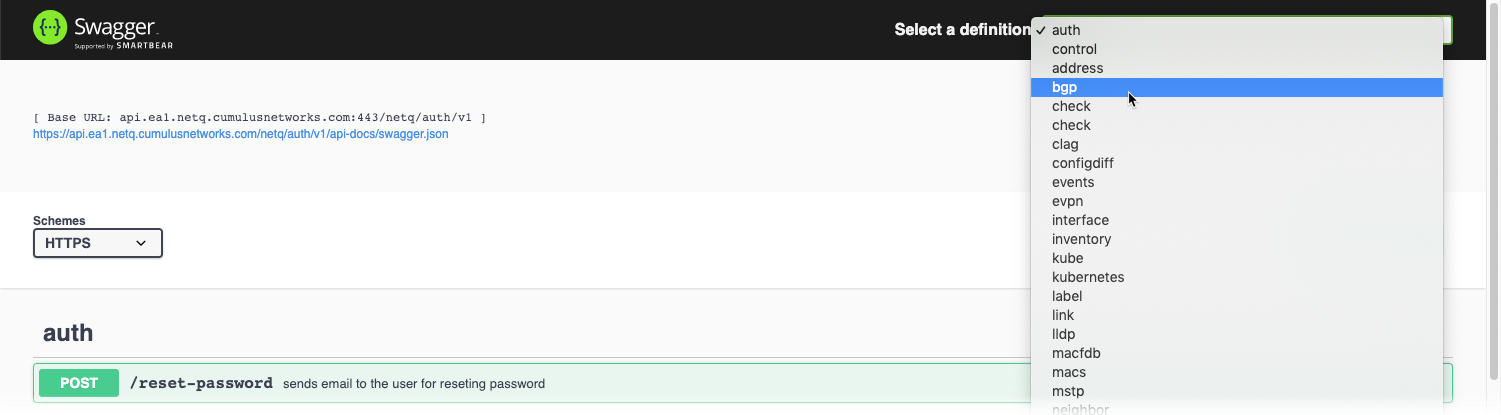
Select the endpoint from the definition dropdown at the top right of the application.
This example shows the BGP endpoint selected:
Select the endpoint object.
This example shows the results of selecting the GET bgp object:
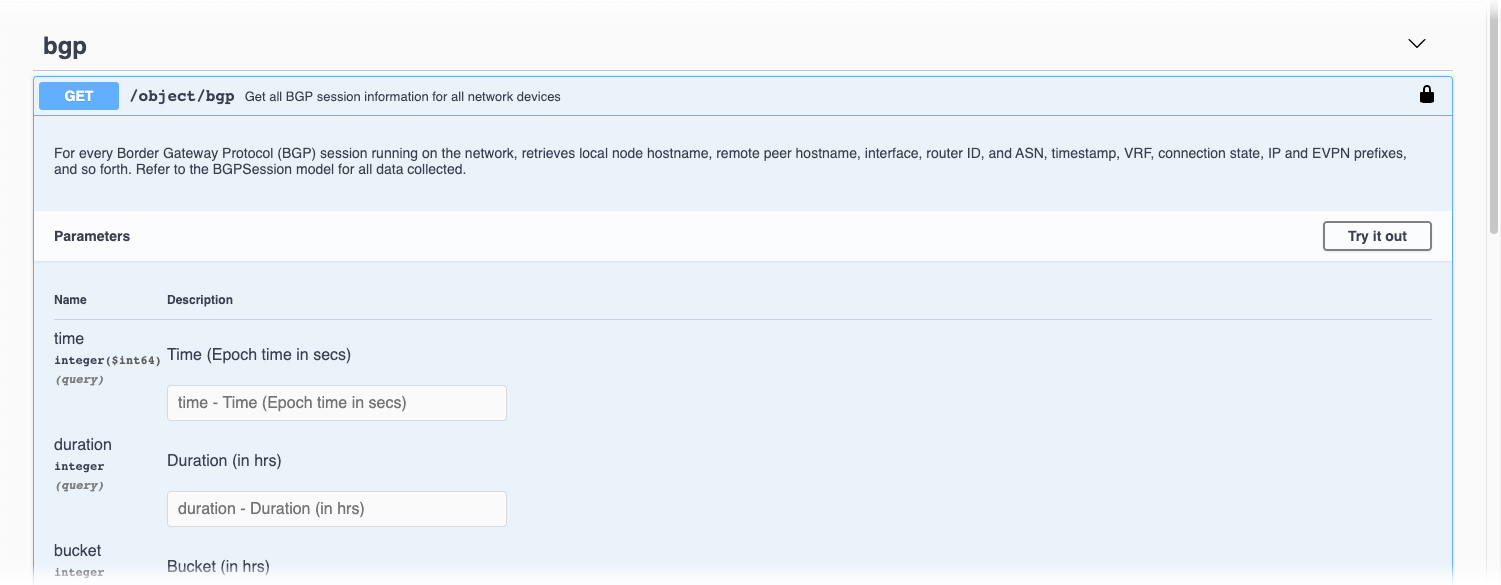
Click Try it out.
Enter values for the required parameters.
Click Execute.
In a terminal window, use bash plus curl to execute requests. Each request contains an API method (GET, POST, etc.), the address and API endpoint object to query, a variety of headers, and sometimes a body. For example, in the log in step above:
- API method = POST
- Address and API object = “https://<netq.domain>:443/netq/auth/v1/login”
- Headers = -H “accept: application/json” and -H “Content-Type: application/json”
- Body = -d “{ "username": "admin", "password": "admin", "access_key": "string"}”
API Responses
A NetQ API response is comprised of a status code, any relevant error codes (if unsuccessful), and the collected data (if successful).
The following HTTP status codes might be presented in the API responses:
| Code | Name | Description | Action |
|---|---|---|---|
| 200 | Success | Request was successfully processed. | Review response. |
| 400 | Bad Request | Invalid input was detected in request. | Check the syntax of your request and make sure it matches the schema. |
| 401 | Unauthorized | Authentication has failed or credentials were not provided. | Provide or verify your credentials, or request access from your administrator. |
| 403 | Forbidden | Request was valid, but user might not have the needed permissions. | Verify your credentials or request an account from your administrator. |
| 404 | Not Found | Requested resource could not be found. | Try the request again after a period of time or verify status of resource. |
| 409 | Conflict | Request cannot be processed due to conflict in current state of the resource. | Verify status of resource and remove conflict. |
| 500 | Internal Server Error | Unexpected condition has occurred. | Perform general troubleshooting and try the request again. |
| 503 | Service Unavailable | The service being requested is currently unavailable. | Verify the status of the NetQ Platform or Appliance, and the associated service. |
Example Requests and Responses
Some command requests and their responses are shown here, but feel free to run your own requests. To run a request, you will need your authorization token. When using the curl commands, the responses have been piped through a python tool to make them more readable. You can choose to do so as well.
Validate Networkwide Status of the BGP Service
Make your request to the bgp endpoint to obtain validate the operation of the BGP service on all nodes running the service.
- Open the check endpoint.

- Open the check object.
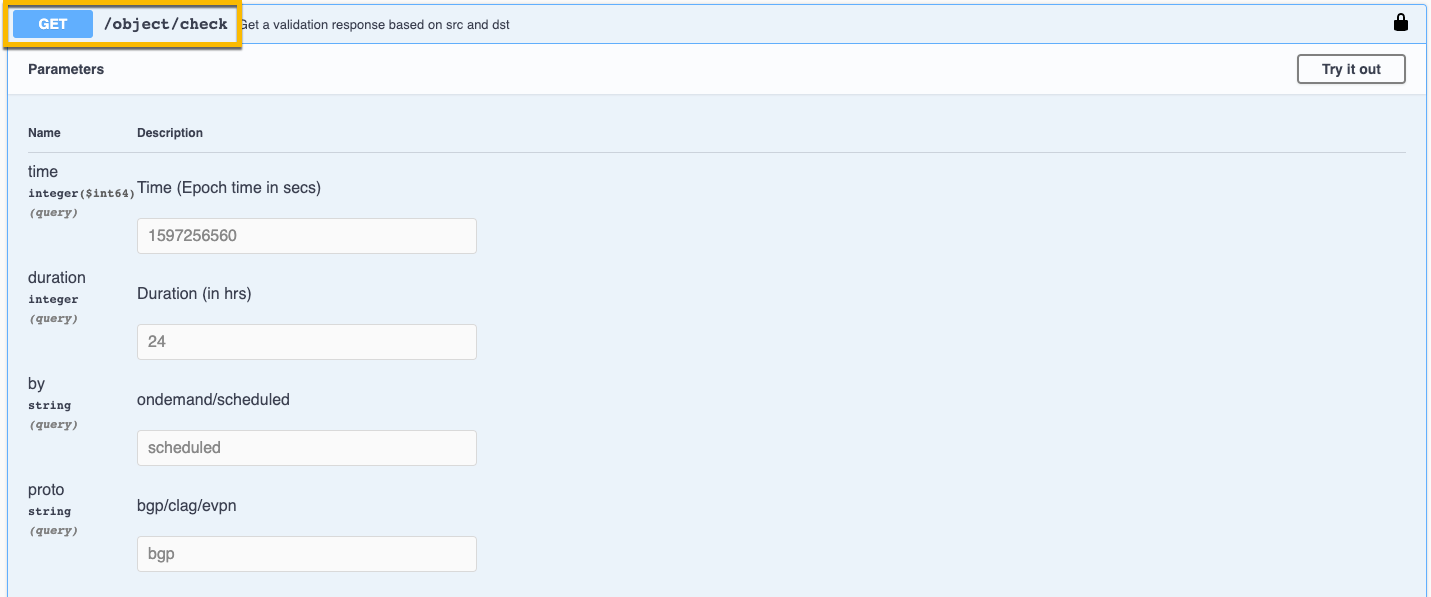
Click Try it out.
Enter values for
time,duration,by, andprotoparameters.In this example, time=1597256560, duration=24, by=scheduled, and proto=bgp.
Click Execute, then scroll down to see the results under Server response.
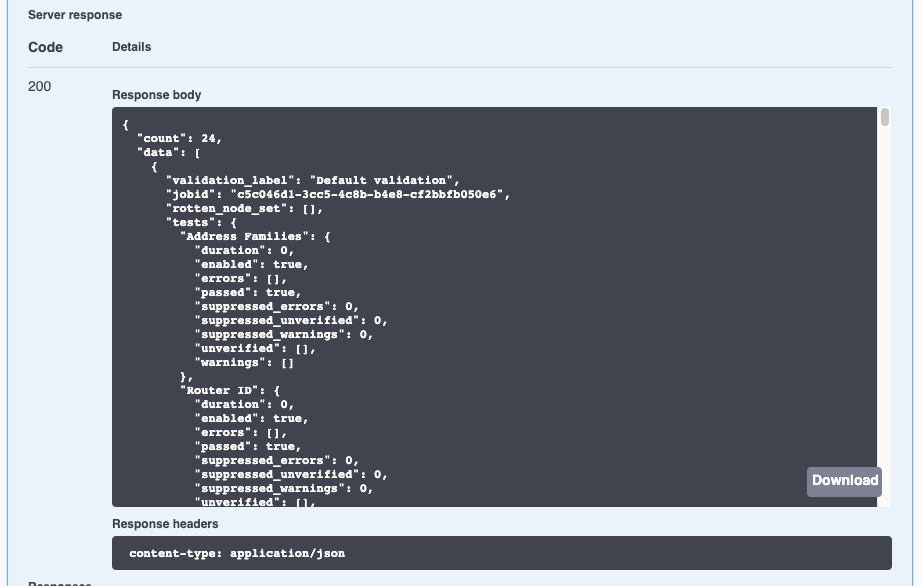
Run the following curl command, entering values for the various parameters. In this example, time=1597256560, duration=24 (hours), by=scheduled, and proto=bgp.
curl -X GET "<https://<netq.domain>:<port>/netq/telemetry/v1/object/check?time=1597256560&duration=24&by=scheduled&proto=bgp" -H "accept: application/json" -H "Authorization: <auth-token> " | python -m json.tool
  % Total    % Received % Xferd  Average Speed   Time    Time     Time  Current
                                 Dload  Upload   Total   Spent    Left  Speed
100 22869  100 22869    0     0  34235      0 --:--:-- --:--:-- --:--:-- 34183
{
    "count": 24,
    "data": [
        {
            "additional_summary": {
                "failed_sessions": 0,
                "total_sessions": 0
            },
            "failed_node_set": [],
            "jobid": "c5c046d1-3cc5-4c8b-b4e8-cf2bbfb050e6",
            "res_timestamp": 1597254743280,
            "rotten_node_set": [],
            "summary": {
                "checkedNodeCount": 0,
                "failedNodeCount": 0,
                "failedSessionCount": 0,
                "rottenNodeCount": 0,
                "totalNodeCount": 0,
                "totalSessionCount": 0,
                "warningNodeCount": 0
            },
...
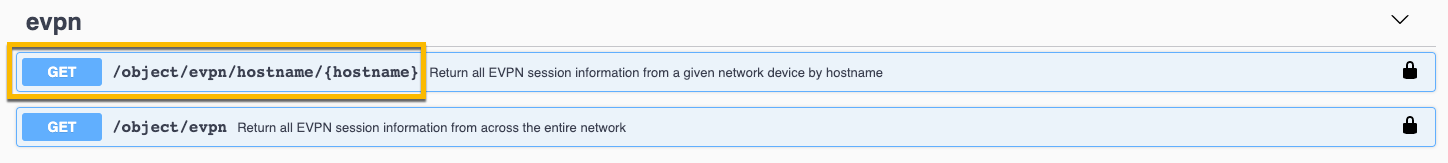
Get Status of EVPN on a Specific Switch
Make your request to the evpn/hostname endpoint to view the status of all EVPN sessions running on that node.
This example uses the server01 switch.
- Open the EVPN endpoint.

- Open the hostname object.
Click Try it out.
Enter a value for
hostname, and optional values foreq_timestamp,count, andoffsetparameters.In this example, time=1597256560, duration=24, by=scheduled, and proto=bgp.
Click Execute, then scroll down to see the results under Server response.
This example uses the server01 switch in an on-premises network deployment.
curl -X GET "https://<netq.domain>:32708/netq/telemetry/v1/object/evpn/hostname/spine01" -H "accept: application/json" -H "Authorization: <auth-token>" | python -m json.tool
  % Total    % Received % Xferd  Average Speed   Time    Time     Time  Current
                                 Dload  Upload   Total   Spent    Left  Speed
100     2    0     2    0     0      3      0 --:--:-- --:--:-- --:--:--     3
[]


<!-- old output -->

[
    {
    "import_rt": "[\"197:42\"]",
    "vni": 42,
    "rd": "27.0.0.22:2",
    "hostname": "server01",
    "timestamp": 1556037403853,
    "adv_all_vni": true,
    "export_rt": "[\"197:42\"]",
    "db_state": "Update",
    "in_kernel": true,
    "adv_gw_ip": "Disabled",
    "origin_ip": "27.0.0.22",
    "opid": 0,
    "is_l3": false
    },
    {
    "import_rt": "[\"197:37\"]",
    "vni": 37,
    "rd": "27.0.0.22:8",
    "hostname": "server01",
    "timestamp": 1556037403811,
    "adv_all_vni": true,
    "export_rt": "[\"197:37\"]",
    "db_state": "Update",
    "in_kernel": true,
    "adv_gw_ip": "Disabled",
    "origin_ip": "27.0.0.22",
    "opid": 0,
    "is_l3": false
    },
    {
    "import_rt": "[\"197:4001\"]",
    "vni": 4001,
    "rd": "6.0.0.194:5",
    "hostname": "server01",
    "timestamp": 1556036360169,
    "adv_all_vni": true,
    "export_rt": "[\"197:4001\"]",
    "db_state": "Refresh",
    "in_kernel": true,
    "adv_gw_ip": "Disabled",
    "origin_ip": "27.0.0.22",
    "opid": 0,
    "is_l3": true
    },
...
Get Status on All Interfaces at a Given Time
Make your request to the interfaces endpoint to view the status of all interfaces. By specifying the eq-timestamp option and entering a date and time in epoch format, you indicate the data for that time (versus in the last hour by default), as follows:
curl -X GET "https://<netq.domain>:32708/netq/telemetry/v1/object/interface?eq_timestamp=1556046250" -H "Content-Type: application/json" -H "Authorization: <auth-token>" | python -m json.tool

[
  {
    "hostname": "exit-1",
    "timestamp": 1556046270494,
    "state": "up",
    "vrf": "DataVrf1082",
    "last_changed": 1556037405259,
    "ifname": "swp3.4",
    "opid": 0,
    "details": "MTU: 9202",
    "type": "vlan"
  },
  {
    "hostname": "exit-1",
    "timestamp": 1556046270496,
    "state": "up",
    "vrf": "DataVrf1081",
    "last_changed": 1556037405320,
    "ifname": "swp7.3",
    "opid": 0,
    "details": "MTU: 9202",
    "type": "vlan"
  },
  {
    "hostname": "exit-1",
    "timestamp": 1556046270497,
    "state": "up",
    "vrf": "DataVrf1080",
    "last_changed": 1556037405310,
    "ifname": "swp7.2",
    "opid": 0,
    "details": "MTU: 9202",
    "type": "vlan"
  },
  {
    "hostname": "exit-1",
    "timestamp": 1556046270499,
    "state": "up",
    "vrf": "",
    "last_changed": 1556037405315,
    "ifname": "DataVrf1081",
    "opid": 0,
    "details": "table: 1081, MTU: 65536, Members:  swp7.3,  DataVrf1081,  swp4.3,  swp6.3,  swp5.3,  swp3.3, ",
    "type": "vrf"
  },
...
Get a List of All Devices Being Monitored
Make your request to the inventory endpoint to get a listing of all monitored nodes and their configuration information, as follows:
curl -X GET "https://<netq.domain>:32708/netq/telemetry/v1/object/inventory" -H "Content-Type: application/json" -H "Authorization: <auth-token>" | python -m json.tool

[
  {
    "hostname": "border01",
    "timestamp": 1556037425658,
    "asic_model": "A-Z",
    "agent_version": "3.2.0-cl4u30~1601403318.104fb9ed",
    "os_version": "A.2.0",
    "disk_total_size": "10 GB",
    "os_version_id": "A.2.0",
    "platform_model": "A_VX",
    "memory_size": "2048.00 MB",
    "asic_vendor": "AA Inc",
    "cpu_model": "A-SUBLEQ",
    "asic_model_id": "N/A",
    "platform_vendor": "A Systems",
    "asic_ports": "N/A",
    "cpu_arch": "x86_64",
    "cpu_nos": "2",
    "platform_mfg_date": "N/A",
    "platform_label_revision": "N/A",
    "agent_state": "fresh",
    "cpu_max_freq": "N/A",
    "platform_part_number": "3.7.6",
    "asic_core_bw": "N/A",
    "os_vendor": "CL",
    "platform_base_mac": "00:01:00:00:01:00",
    "platform_serial_number": "00:01:00:00:01:00"
  },
  {
    "hostname": "exit-2",
    "timestamp": 1556037432361,
    "asic_model": "C-Z",
    "agent_version": "3.2.0-cl4u30~1601403318.104fb9ed",
    "os_version": "C.2.0",
    "disk_total_size": "30 GB",
    "os_version_id": "C.2.0",
    "platform_model": "C_VX",
    "memory_size": "2048.00 MB",
    "asic_vendor": "CC Inc",
    "cpu_model": "C-CRAY",
    "asic_model_id": "N/A",
    "platform_vendor": "C Systems",
    "asic_ports": "N/A",
    "cpu_arch": "x86_64",
    "cpu_nos": "2",
    "platform_mfg_date": "N/A",
    "platform_label_revision": "N/A",
    "agent_state": "fresh",
    "cpu_max_freq": "N/A",
    "platform_part_number": "3.7.6",
    "asic_core_bw": "N/A",
    "os_vendor": "CL",
    "platform_base_mac": "00:01:00:00:02:00",
    "platform_serial_number": "00:01:00:00:02:00"
  },
  {
    "hostname": "firewall-1",
    "timestamp": 1556037438002,
    "asic_model": "N/A",
    "agent_version": "2.1.0-ub16.04u15~1555608012.1d98892",
    "os_version": "16.04.1 LTS (Xenial Xerus)",
    "disk_total_size": "3.20 GB",
    "os_version_id": "(hydra-poc-01 /tmp/purna/Kleen-Gui1/)\"16.04",
    "platform_model": "N/A",
    "memory_size": "4096.00 MB",
    "asic_vendor": "N/A",
    "cpu_model": "QEMU Virtual  version 2.2.0",
    "asic_model_id": "N/A",
    "platform_vendor": "N/A",
    "asic_ports": "N/A",
    "cpu_arch": "x86_64",
    "cpu_nos": "2",
    "platform_mfg_date": "N/A",
    "platform_label_revision": "N/A",
    "agent_state": "fresh",
    "cpu_max_freq": "N/A",
    "platform_part_number": "N/A",
    "asic_core_bw": "N/A",
    "os_vendor": "Ubuntu",
    "platform_base_mac": "N/A",
    "platform_serial_number": "N/A"
  },
...