PTP
PTP monitoring is only supported on Spectrum switches running Cumulus Linux version 5.0 and above and NetQ Agent 4.5 and above.
Use the UI or CLI to monitor Precision Time Protocol (PTP), including clock hierarchies and priorities, synchronization thresholds, and accuracy rates.
PTP Commands
Monitor PTP with the following commands. See the command line reference for additional options, definitions, and examples.
   netq show ptp clock-details
   netq show ptp counters (tx | rx)
   netq show ptp global-config
   netq show ptp port-status
   netq show events message_type ptp
Access the PTP Dashboard
Select
 Menu.
Menu.Under the Network section, select PTP.
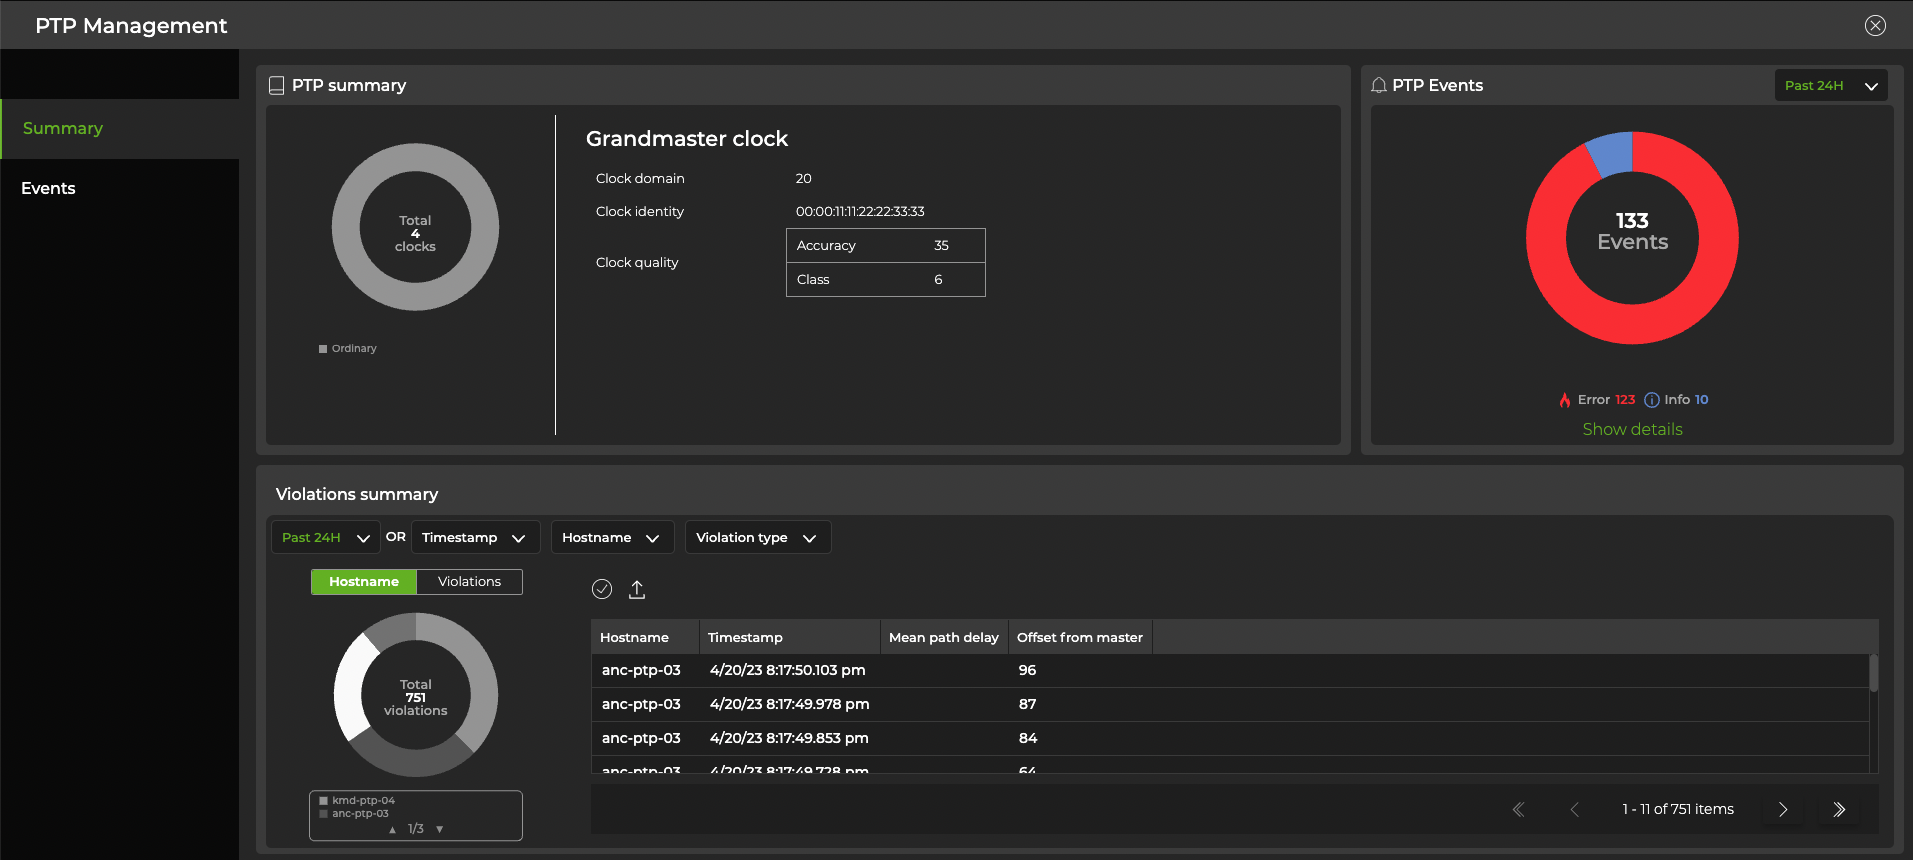
The PTP summary dashboard displays:
- clock count, type, and distribution
- an overview of PTP-related events
- a summary of PTP violations (mean path delay and offset from master)
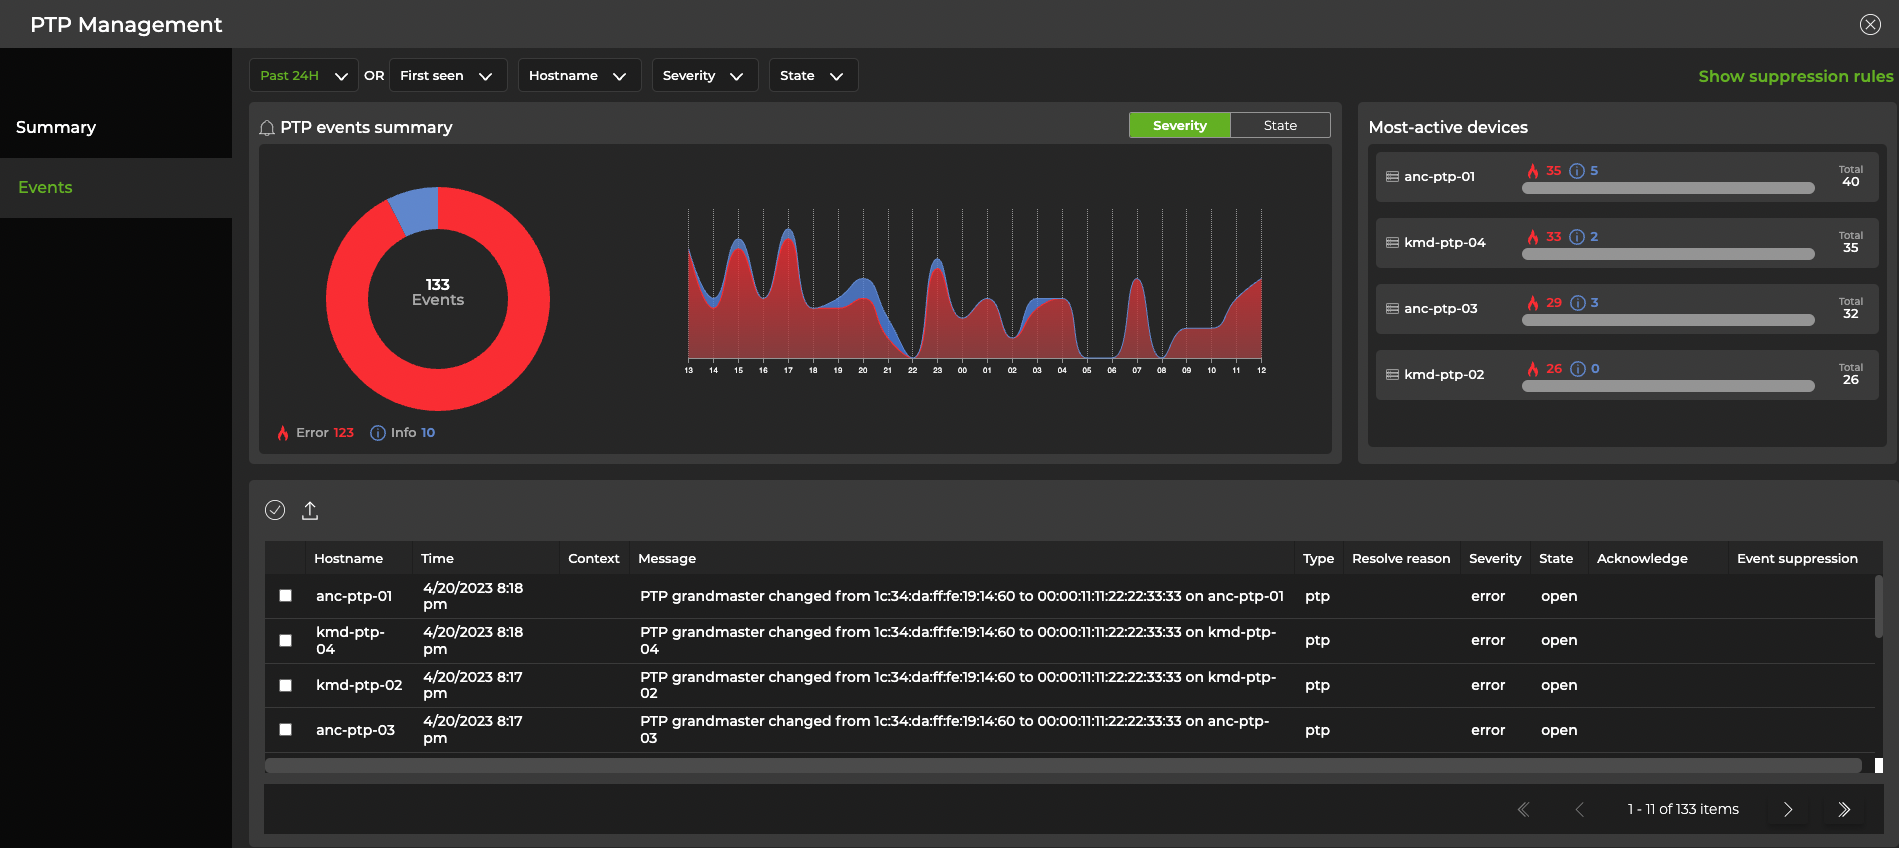
Navigate to the Events tab to view, filter, and sort PTP-related events:
View PTP on a Switch
Select
 Devices in the workbench header, then click Open a device card.
Select a switch from the dropdown and specify the large card.
Hover over the top of the card and select the PTP icon
 :
:
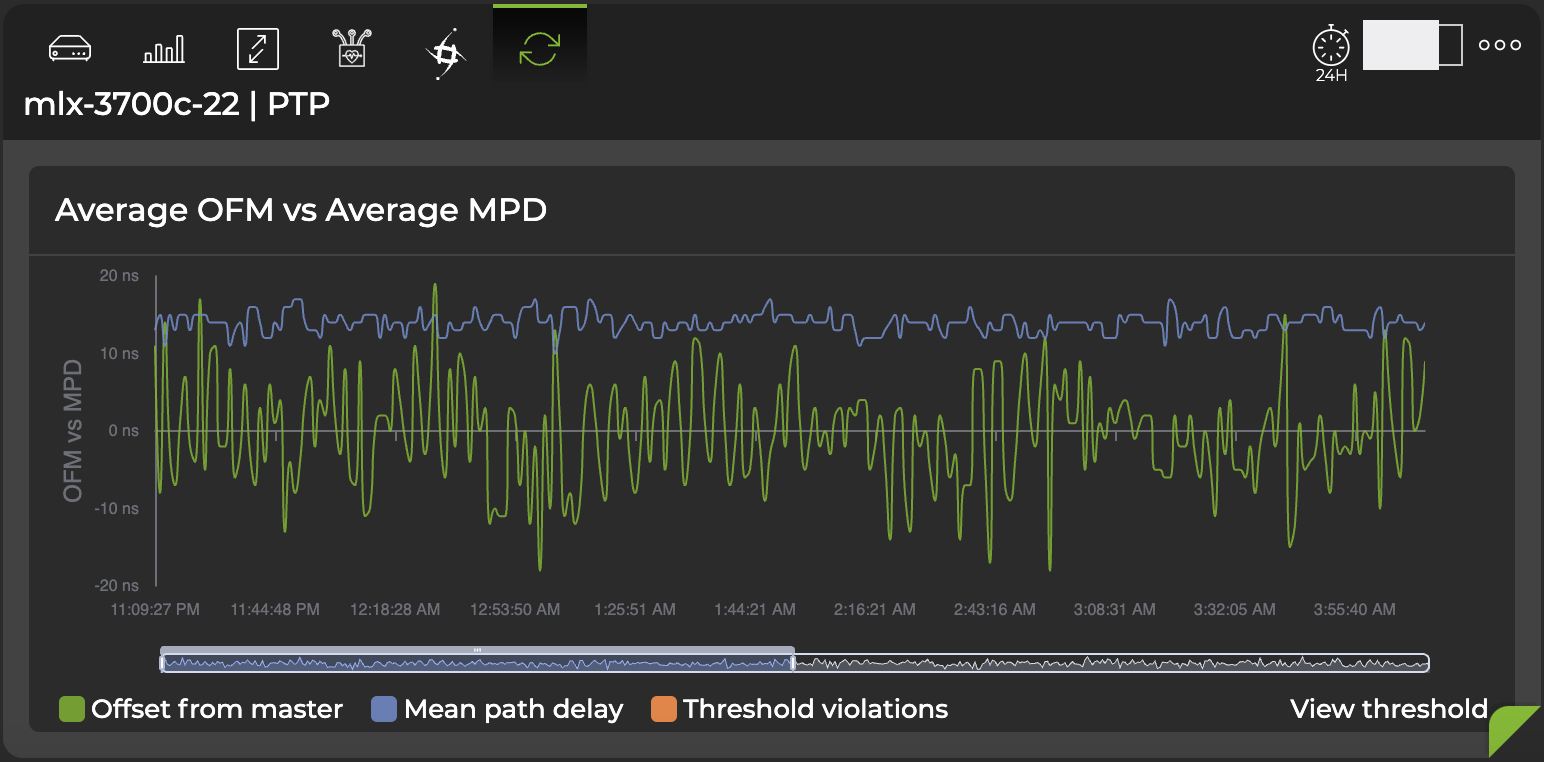
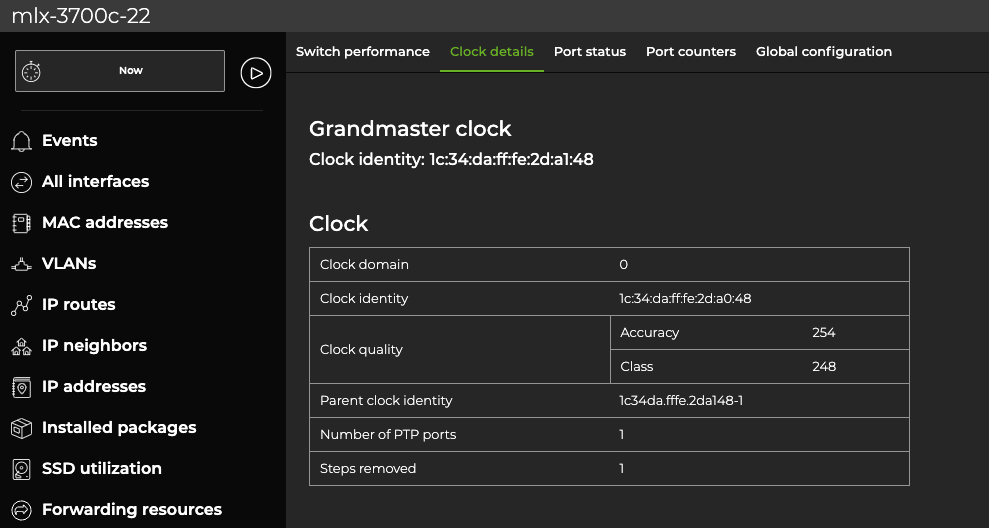
- For more granular data, expand the card to full-size and navigate to PTP:
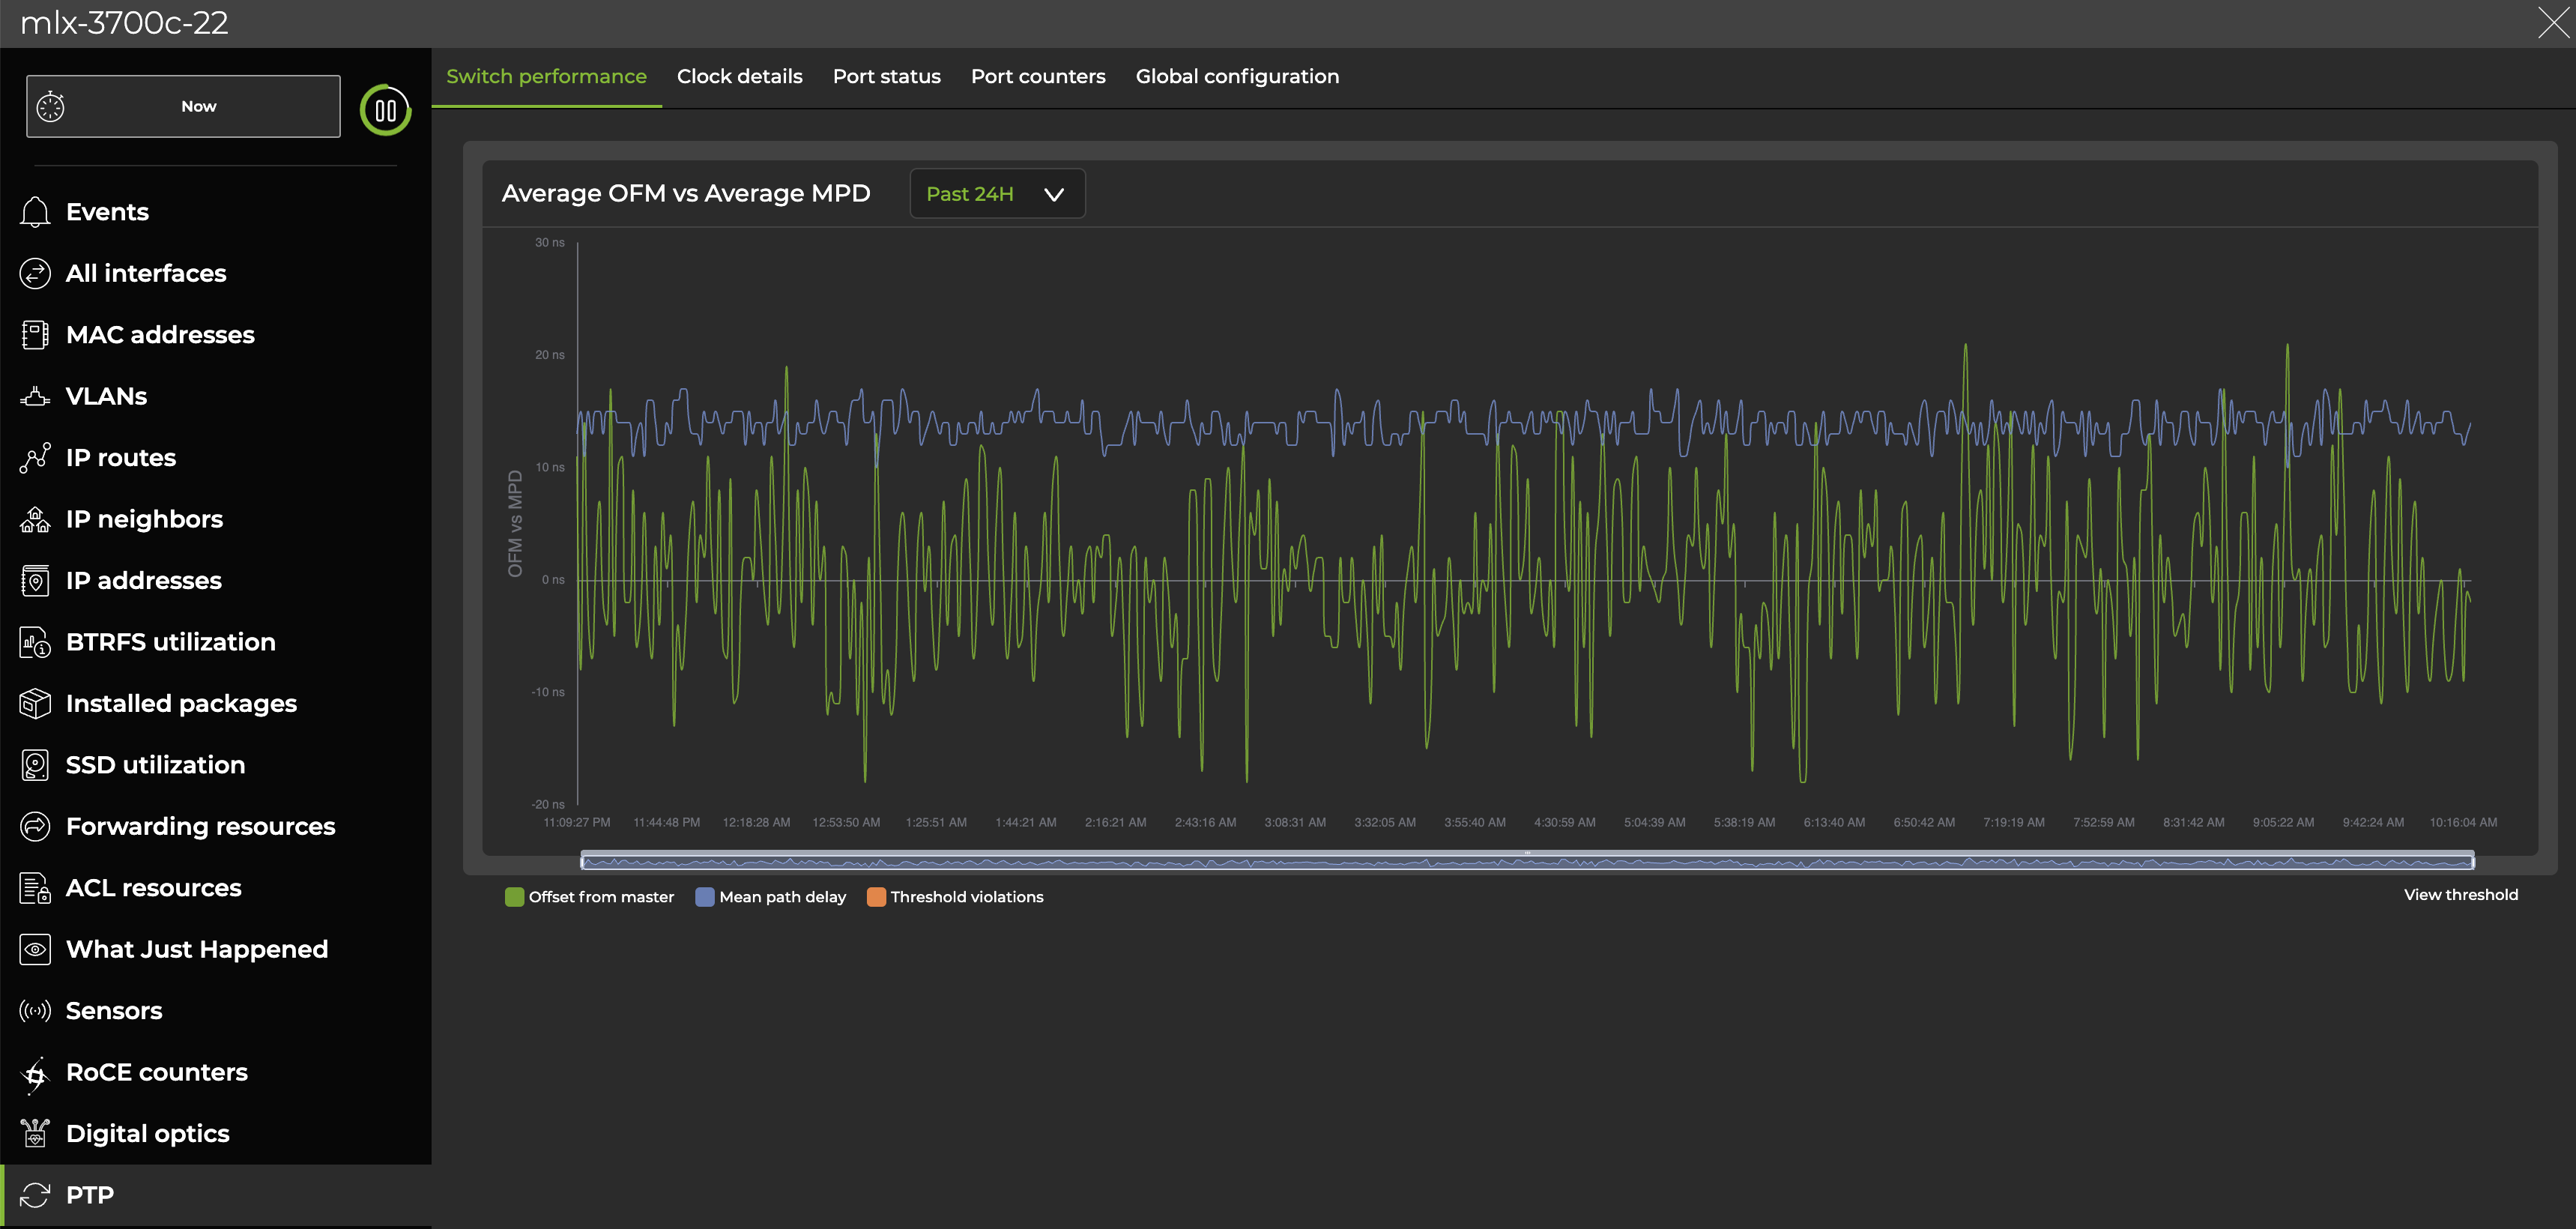
Hover over the chart at any point to display timestamped mean-path-delay and offset-from-master data. You can drag the bottom bar to expand and compress the period of time displayed in the graph.
Select the tabs above the chart to display information about domains, clocks, ports, and configurations: