Switches
With the NetQ UI and NetQ CLI, you can monitor the health of individual switches, including interface performance and resource utilization.
NetQ reports switch performance metrics for the following categories:
- System configuration: events, interfaces, IP and MAC addresses, VLANs, IP routes, IP neighbors, and installed software packages
- Utilization statistics: CPU, memory, disk, ACL and forwarding resources, SSD, and BTRFS
- Physical sensing: digital optics and switch sensors
- RoCE and Precision Time Protocol
For switch inventory information (ASIC, platform, CPU, memory, disk, and OS), refer to Switch Inventory.
View Switch Metrics and Attributes in the UI
To view events, metrics, and attributes per switch, open the Switch card:
In the header, select
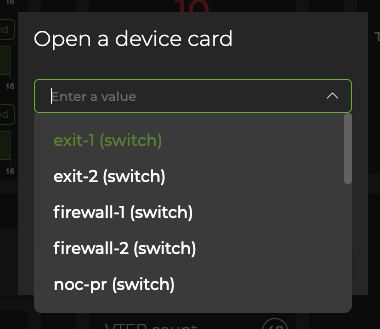
 Devices, then click Open a device card.
Select a switch from the list:
Click Add.
Adjust the card’s size to view information at different levels of granularity.
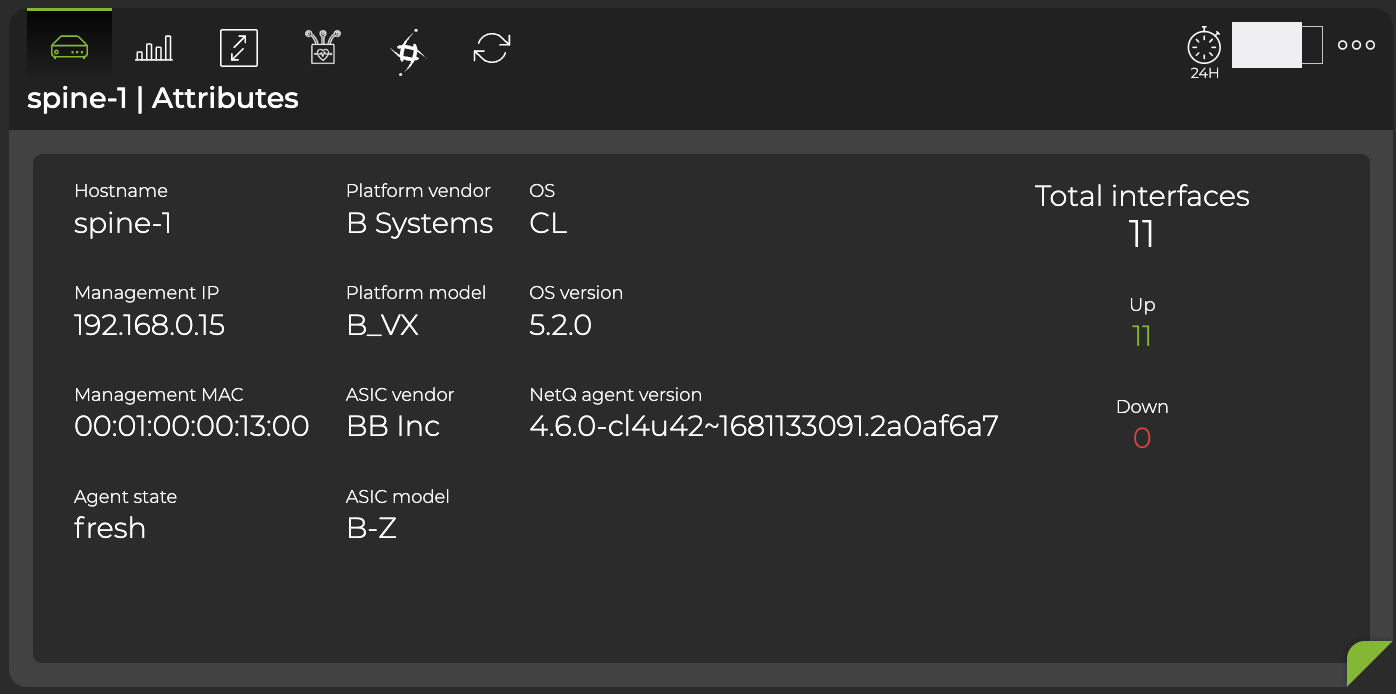
Attributes are displayed as the default tab on the large Switch card. You can view the static information about the switch, including its hostname, addresses, server and ASIC vendors and models, OS and NetQ software information. You can also view the state of the interfaces and NetQ Agent on the switch.
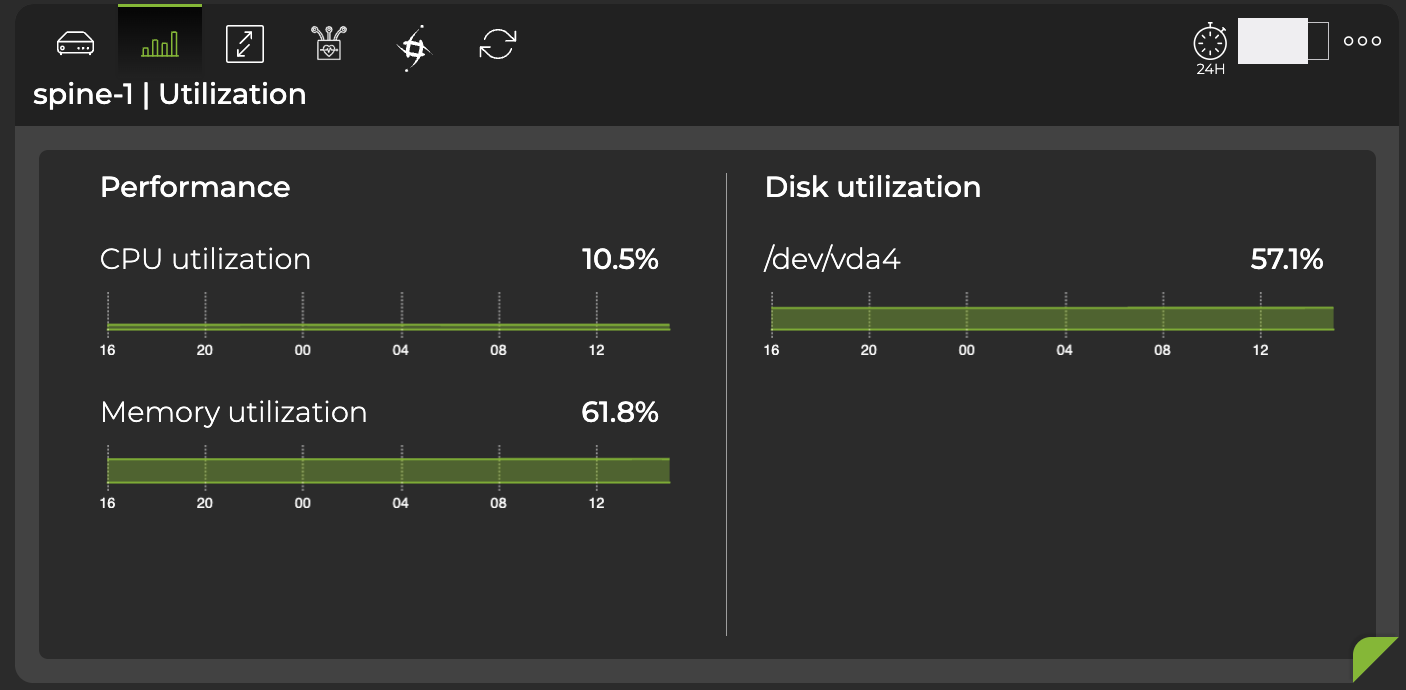
Hover over the top of the card, then select the appropriate icon to view utilization info, interface statistics, digital optics info, RoCe metrics, and PTP clock graphs. This example displays utilization information, including CPU, memory, and disk utilization from the past 24 hours:
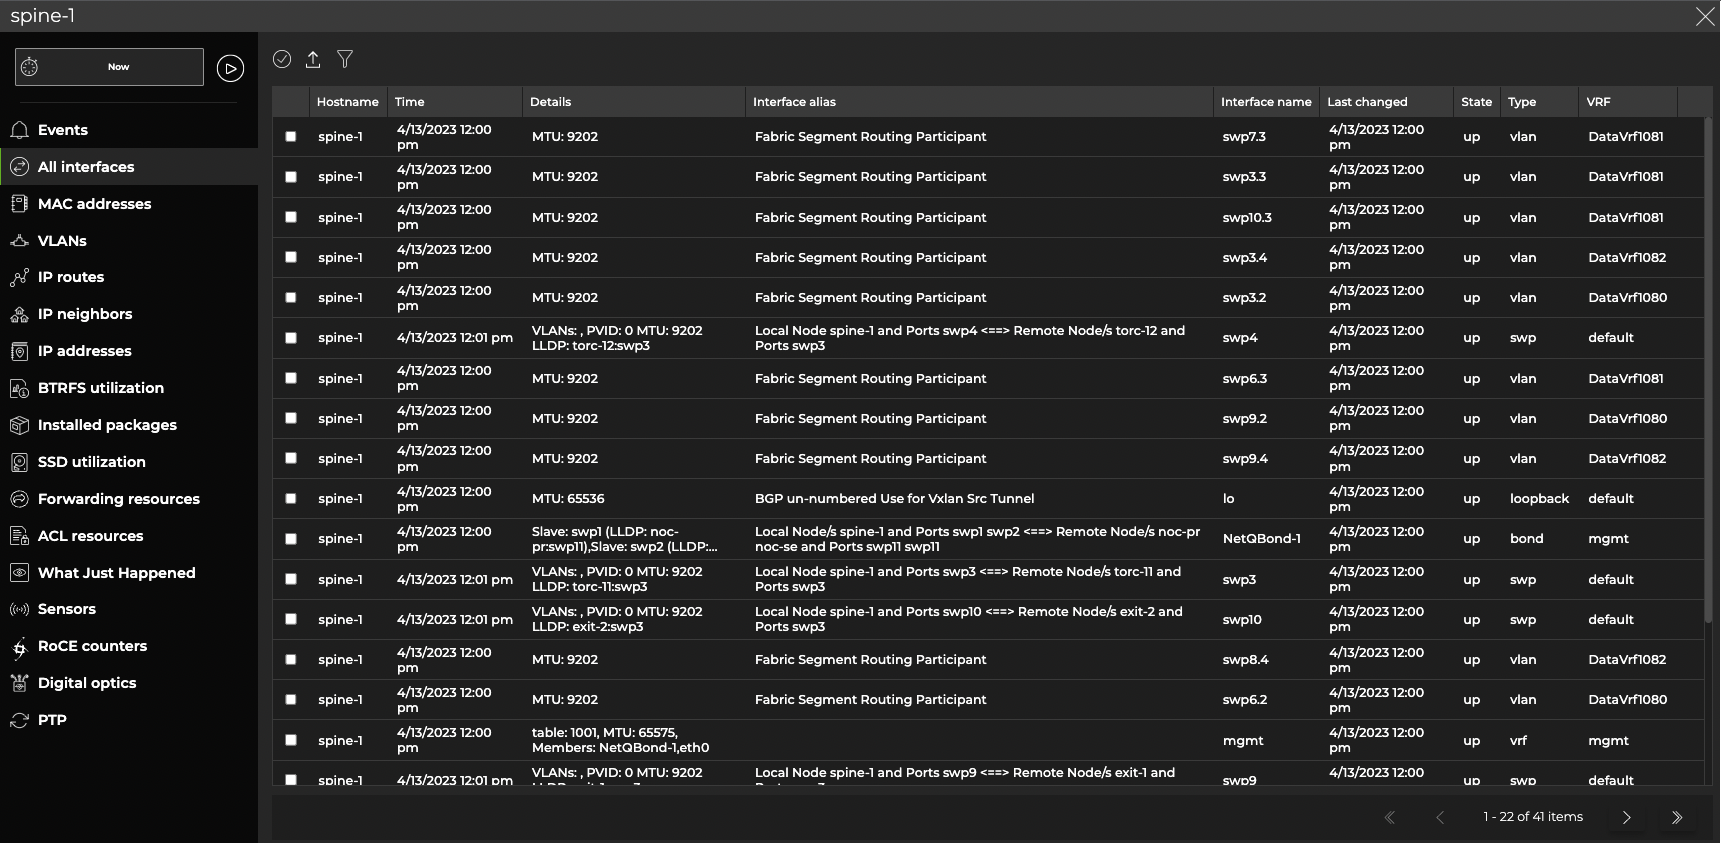
Expand the Switch card to full-screen to view, filter or export information about events, interfaces, MAC addresses, VLANs, IP routes, IP neighbors, IP addresses, BTRFS utilization, software packages, SSD utilization, forwarding resources, ACL resources, What Just Happened events, sensors, RoCE counters, digital optics, and PTP:
Switch Commands
The information available in the UI can also be displayed via the CLI with a corresponding netq show command. Each command that begins with netq show includes the option <hostname>. When the <hostname> option is included in the command, the output displays results limited to the switch or host you specified.
For example, you can view all events across your network with the netq show events command. To view all events on a particular switch, specify its name in the <hostname> field in netq <hostname> show events. The following example displays all events on the leaf01 switch:
cumulus@switch:~$ netq leaf01 show events

Matching events records:
Hostname          Message Type             Severity         Message                             Timestamp
----------------- ------------------------ ---------------- ----------------------------------- -------------------------
leaf01            btrfsinfo                error            data storage efficiency : space lef Wed Sep  2 20:34:31 2020
                                                            t after allocation greater than chu
                                                            nk size 0.57 GB
leaf01            btrfsinfo                error            data storage efficiency : space lef Wed Sep  2 20:04:30 2020
                                                            t after allocation greater than chu
                                                            nk size 0.57 GB
Refer to the command line reference for a comprehensive list of netq show commands.