MLAG
You use Multi-Chassis Link Aggregation (MLAG) to enable a server or switch with a two-port bond (such as a link aggregation group/LAG, EtherChannel, port group or trunk) to connect those ports to different switches and operate as if they have a connection to a single, logical switch. This provides greater redundancy and greater system throughput. Dual-connected devices can create LACP bonds that contain links to each physical switch. Therefore, NetQ supports active-active links from the dual-connected devices even though each switch connects to a different physical switch. For an overview and how to configure MLAG in your network, refer to Multi-Chassis Link Aggregation - MLAG.
MLAG or CLAG?
Other vendors refer to the Cumulus Linux implementation of MLAG as MLAG, MC-LAG or VPC. The NetQ UI uses the MLAG terminology predominantly. However, the management daemon, named clagd, and other options in the code, such as clag-id, remain for historical purposes.
Any prior scripts or automation that use the older netq show clag command continue to work as the command still exists in the operating system.
MLAG Commands
Monitor MLAG with the following commands. See the command line reference for additional options, definitions, and examples.
netq show mlag
netq show events message_type mlag
The netq check mlag command verifies MLAG session consistency by identifying all MLAG peers with errors or misconfigurations in the NetQ domain.
netq check mlag
View MLAG in the UI
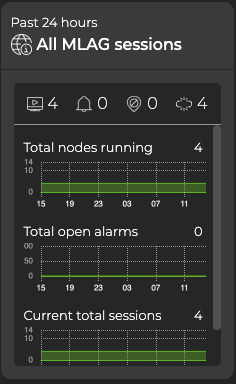
To add the MLAG card to your workbench, navigate to the header and select ![]() Add card > Network services > All MLAG Sessions card > Open cards. This example shows the following for the last 24 hours:
Add card > Network services > All MLAG Sessions card > Open cards. This example shows the following for the last 24 hours:
- Four nodes have been running the MLAG protocol with no changes in that number
- Four sessions were established and remained so
- No MLAG-related events have occurred
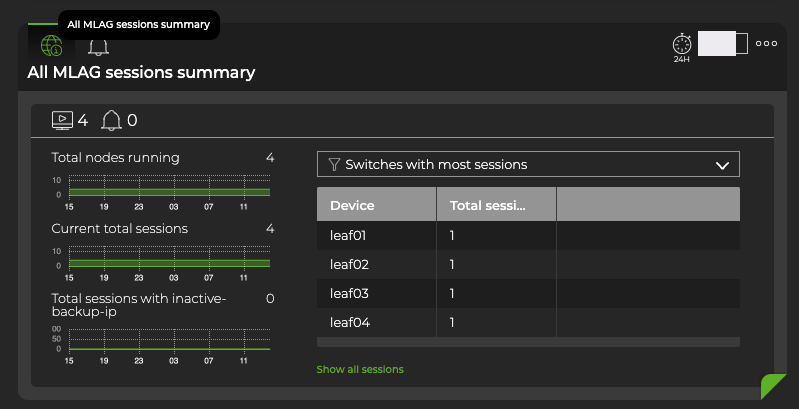
Expand to the large card for additional MLAG info. By default, the card displays the Sessions summary tab. From here you can see which devices are handling the most MLAG sessions, or select the dropdown to view nodes with the most unestablished MLAG sessions. You can view MLAG-related events by selecting the ![]() Events tab.
Events tab.
Expand the MLAG card to full-screen to view, filter, or export:
- the number of bonds with only a single link (single bond)
- the number of bonds with two links (dual bonds)
- whether MLAG sessions have been assigned a backup IP address
- sessions with conflicted bonds (bonds that conflict with existing bond relationships)
- the MLAG configuration for a given device
- all MLAG-related events
- the attributes of all switches running MLAG in your network
- the attributes of all MLAG sessions in your network
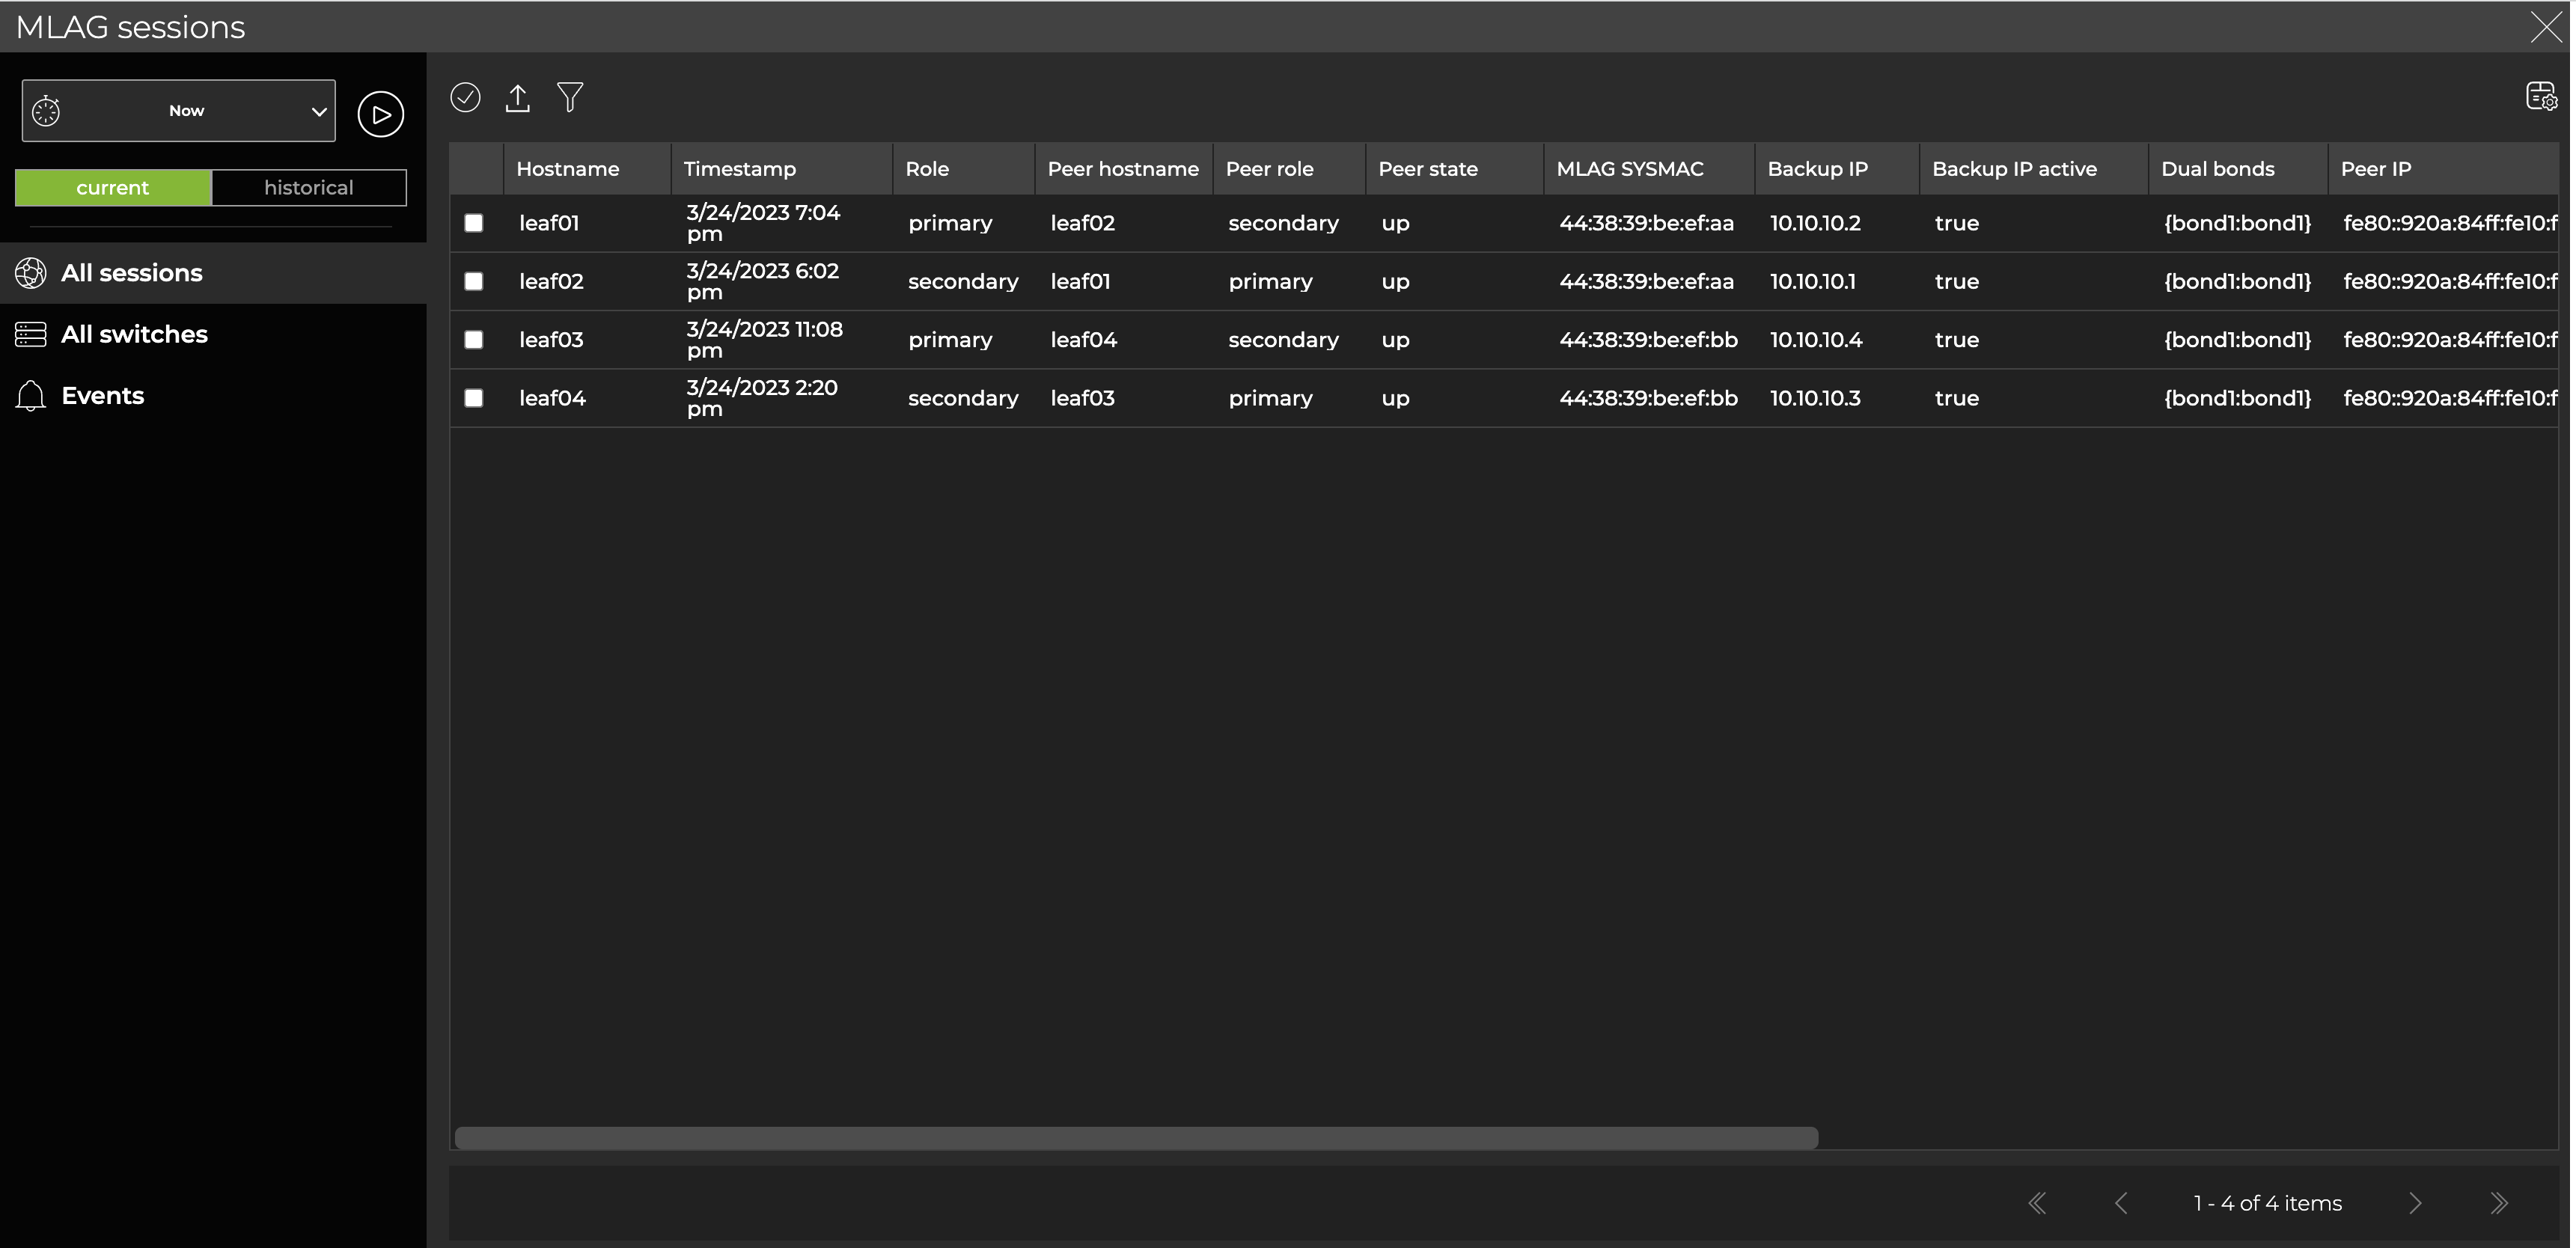
From this table, you can select a row, then click ![]() Add card above the table.
Add card above the table.
NetQ adds a new, MLAG ‘single-session’ card to your workbench. From this card, you can monitor the number of nodes running the MLAG service, view switches with the most peers alive and not alive, and view events triggered by the MLAG service.
Monitor a Single MLAG Session
The MLAG single-session card displays a summary of the MLAG session. In this example, the leaf01 switch plays the primary role in this session with leaf02 and the session is in good health. The heat map tells us that the peer switch has been alive for the entire 24-hour period.
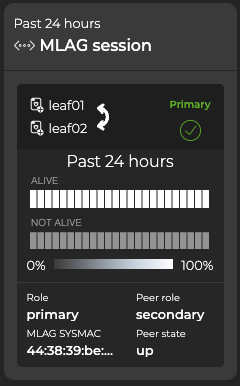
From this card, you can also view the node role, peer role and state, and MLAG system MAC address which identify the session in further detail.
Granularity of Data Shown Based on Time Period
On the medium and large single MLAG session cards, vertically stacked heat maps represent the status of the peers; one for peers that are reachable (alive), and one for peers that are unreachable (not alive). Depending on the time period of data on the card, the number of smaller time blocks used to indicate the status varies. A vertical stack of time blocks, one from each map, includes the results from all checks during that time. The amount of saturation for each block indicates how many peers were alive. If all peers during that time period were alive for the entire time block, then the top block is 100% saturated (white) and the not alive block is zero percent saturated (gray). As peers that are not alive increase in saturation, the amount of saturation diminishes proportionally for peers that are in the alive block. The following table lists the most common time periods, their corresponding number of blocks, and the amount of time represented by one block:
| Time Period | Number of Runs | Number Time Blocks | Amount of Time in Each Block |
|---|---|---|---|
| 6 hours | 18 | 6 | 1 hour |
| 12 hours | 36 | 12 | 1 hour |
| 24 hours | 72 | 24 | 1 hour |
| 1 week | 504 | 7 | 1 day |
| 1 month | 2,086 | 30 | 1 day |
| 1 quarter | 7,000 | 13 | 1 week |
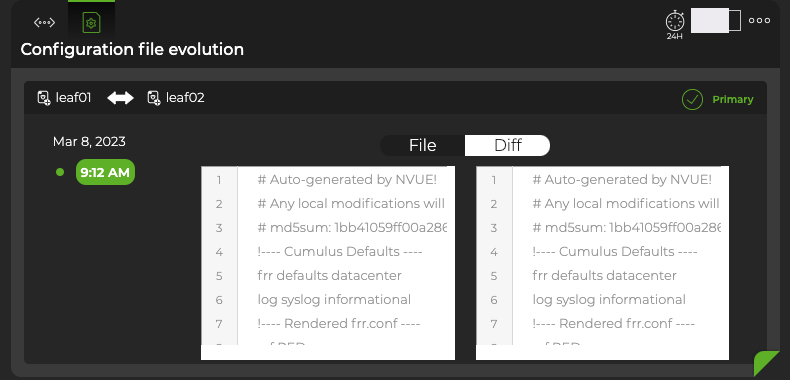
View Changes to the MLAG Service Configuration File
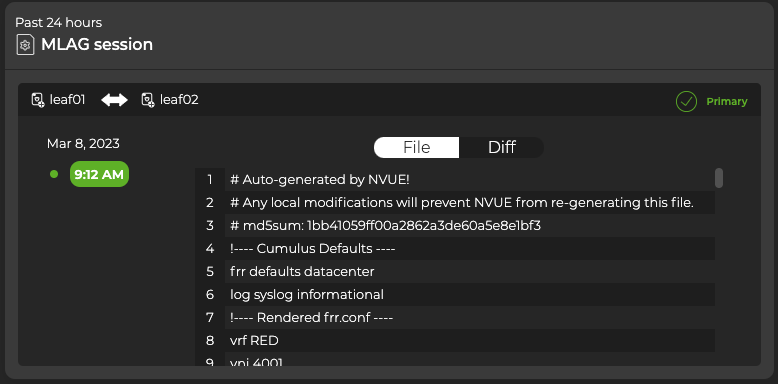
Each time a change is made to the configuration file for the MLAG service, NetQ logs the change and enables you to compare it with the last version using the NetQ UI. This can be useful when you are troubleshooting potential causes for alarms or sessions losing their connections.
From the large single-session card, select the
 MLAG Configuration File Evolution tab.
Select the time.
Choose between the File view and the Diff view.
The File view displays the content of the file:
The Diff view highlights the changes (if any) between this version (on left) and the most recent version (on right) side by side: