OSPF
Use the UI or CLI to monitor Open Shortest Path First (OSPF) on your switches and hosts. For each device, you can view its associated interfaces, areas, peers, state, and type of OSPF running (numbered or unnumbered).
OSPF Commands
Monitor OSPF with the following commands. See the command line reference for additional options, definitions, and examples.
netq show ospf
netq show events message_type ospf
netq show events-config message_type ospf
The netq check ospf command checks for consistency across OSPF sessions in your network fabric.
netq check ospf
View OSPF in the UI
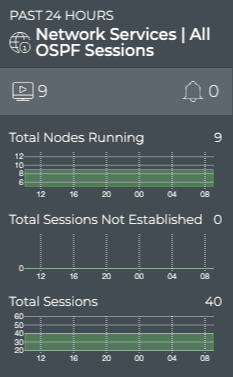
To add the OSPF card to your workbench, navigate to the header and select ![]() Add card > Network services > All OSPF Sessions card > Open cards. In this example, there are 9 nodes running the service with a total of 40 sessions.
Add card > Network services > All OSPF Sessions card > Open cards. In this example, there are 9 nodes running the service with a total of 40 sessions.
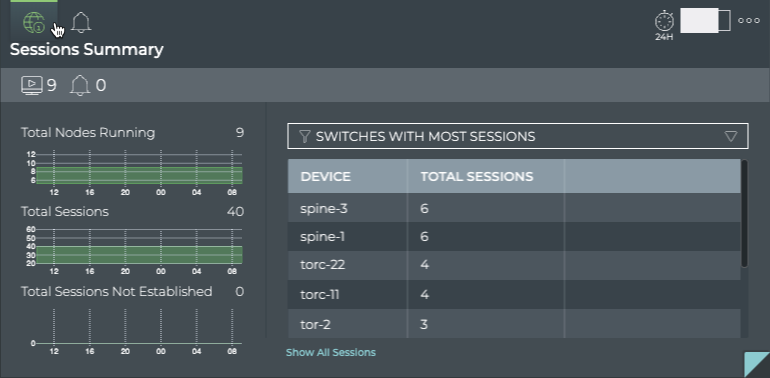
Expand to the large card to display which switches are handling the most OSPF traffic. By default, the card displays the Sessions summary tab and lists switches with established sessions. Select the dropdown to view nodes with the most unestablished OSPF sessions. You can view OSPF-related events by selecting the ![]() Events tab.
Events tab.
Expand the OSPF card to full-screen to view, filter, or export all stored attributes of all switches and hosts running OSPF in your network.
From this table, you can select a row, then click ![]() Add card above the table.
Add card above the table.
NetQ adds a new, OSPF ‘single-session’ card to your workbench. From this card, you can view session state changes and compare them with events, and monitor the running OSPF configuration and changes to the configuration file.
Monitor a Single OSPF Session
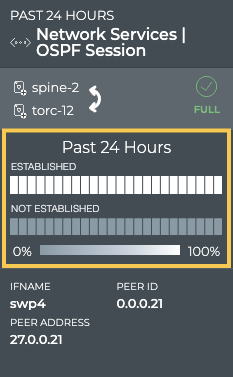
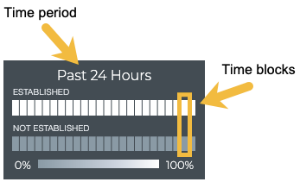
The OSPF single-session card displays the interface name, peer address, and peer ID that identifies the session. The heat map indicates the stability of the OSPF session between two devices over a period of time. In this example, the session has been established throughout the past 24 hours:
Understanding the Heat Map
On the medium and large single OSPF session cards, vertically stacked heat maps represent the status of the sessions; one for established sessions, and one for unestablished sessions. Depending on the time period of data on the card, the number of smaller time blocks used to indicate the status varies. A vertical stack of time blocks, one from each map, includes the results from all checks during that time. The results appear by how saturated the color is for each block. If all sessions during that time period were established for the entire time block, then the top block is 100% saturated (white) and the unestablished block is zero percent saturated (gray). As sessions that are not established increase in saturation, the sessions that are established block is proportionally reduced in saturation. The following example heat map is for a time period of 24 hours, with the most common time periods in the table showing the resulting time blocks.
| Time Period | Number of Runs | Number Time Blocks | Amount of Time in Each Block |
|---|---|---|---|
| 6 hours | 18 | 6 | 1 hour |
| 12 hours | 36 | 12 | 1 hour |
| 24 hours | 72 | 24 | 1 hour |
| 1 week | 504 | 7 | 1 day |
| 1 month | 2,086 | 30 | 1 day |
| 1 quarter | 7,000 | 13 | 1 week |
View Changes to the OSPF Service Configuration File
Each time a change is made to the configuration file for the OSPF service, NetQ logs the change and lets you compare it with the previous version. This can be useful when you are troubleshooting potential causes for events or sessions losing their connections.
To view the configuration file changes:
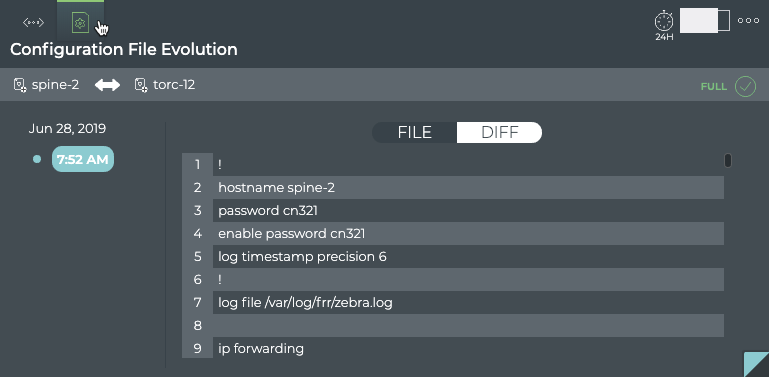
From the large single-session card, select the
 Configuration File Evolution tab.
Select the time.
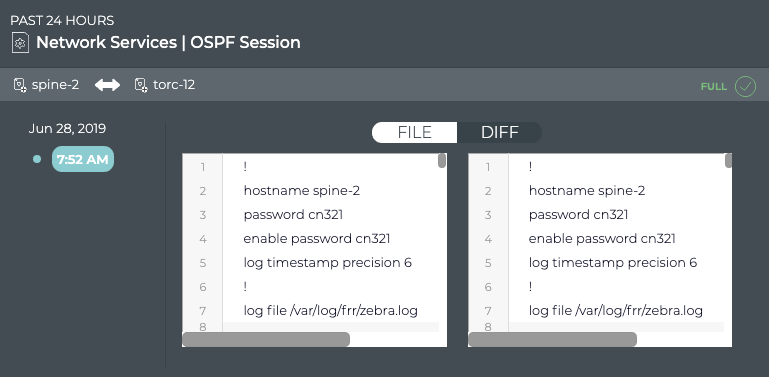
Choose between the File view and the Diff view.
The File view displays the content of the file:
The Diff view highlights the changes (if any) between this version (on left) and the most recent version (on right) side by side: