Validate Overall Network Health
The Validation Summary card in the NetQ UI lets you view the overall health of your network at a glance, giving you a high-level understanding of how well your network is operating. Successful validation results determine overall network health shown in this card.
View Key Metrics of Network Health
Overall network health in the NetQ UI is a calculated average of several key health metrics: system, network services, and interface health.
System health represents the NetQ Agent and sensor health validations. In all cases, validation checks are performed on the agents. If you are monitoring platform sensors, the validation checks include these as well.
Network service health represents the individual network protocol and services validation checks. In all cases, checks are performed on NTP. If you are running BGP, EVPN, MLAG, OSPF, or VXLAN protocols the validation checks include these as well.
Interface health represents the interfaces, VLAN, and link MTU validation checks.
To view network health metrics:
Open or locate the Validation Summary card on your workbench.
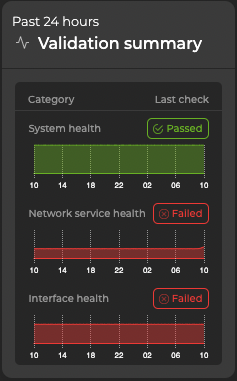
Each metric displays a distribution of the validation results for each category. Hover over the individual categories to view detailed metrics for specific validation checks.
In this example, system health is good, but network services and interface health display validation failures:
View Detailed Network Health
To view details about your network’s health, open or locate the large Validation Summary card on your workbench. To view devices with the most issues or recent issues, select the Most failures tab or Recent failures tab, respectively. You can unselect one or more services on the left side of the card to display devices affected by the selected services on the right side of the card.
By default, the System health tab is displayed.
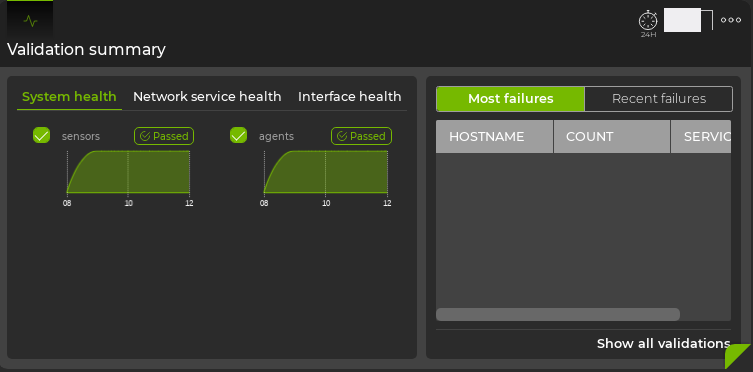
The health of agents and sensors is represented on the left side of the card. Hover over the chart for each type of validation to see detailed results. The right side of the card displays devices with failures related to agents and sensors.
Click the Network service health tab.
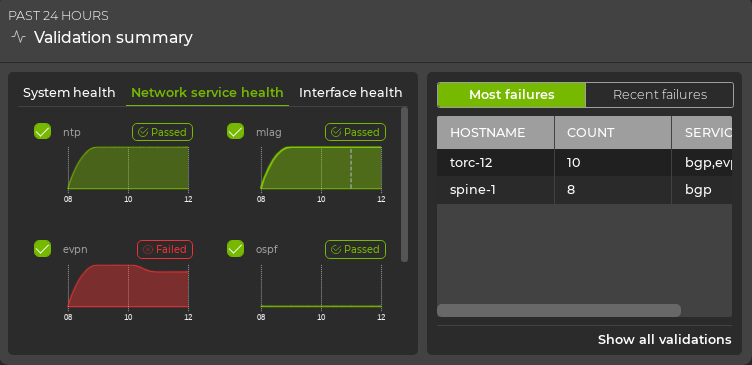
The health of each network protocol or service is represented on the left side of the card. Hover over the chart for each type of validation to see detailed results. The right side of the card displays devices with failures related to these protocols and services.
Click the Interface health tab.
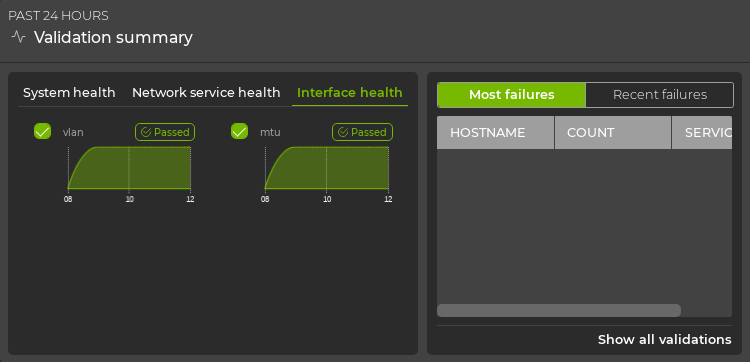
The health of interfaces, VLANs, and link MTUs is represented on the left side of the card. Hover over the chart for each type of validation to see detailed results. The right side of the card displays devices with failures related to interfaces, VLANs, and link MTUs.
View Details of a Particular Service
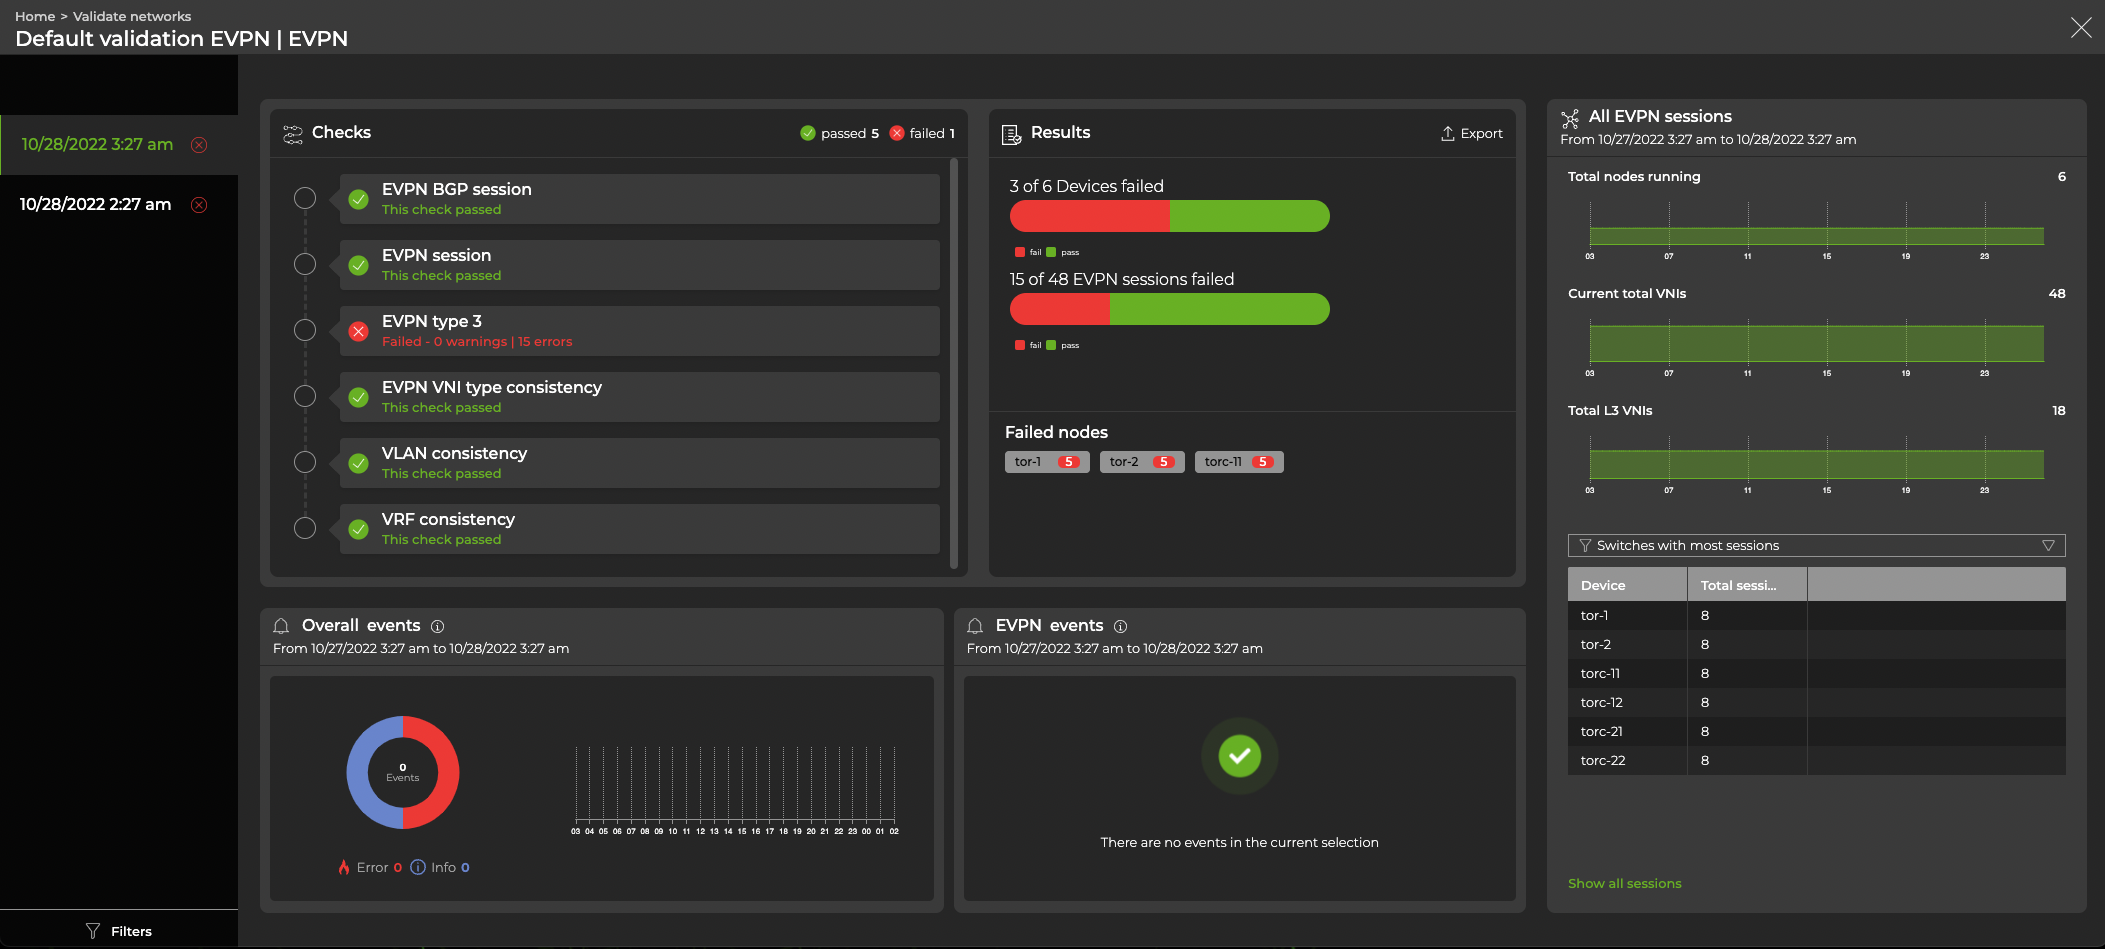
From the relevant tab (System Health, Network Service Health, or Interface Health) on the large Validation Summary card, you can select a chart to open a full-screen view of the validation data for that service.
The following example shows the EVPN chart:
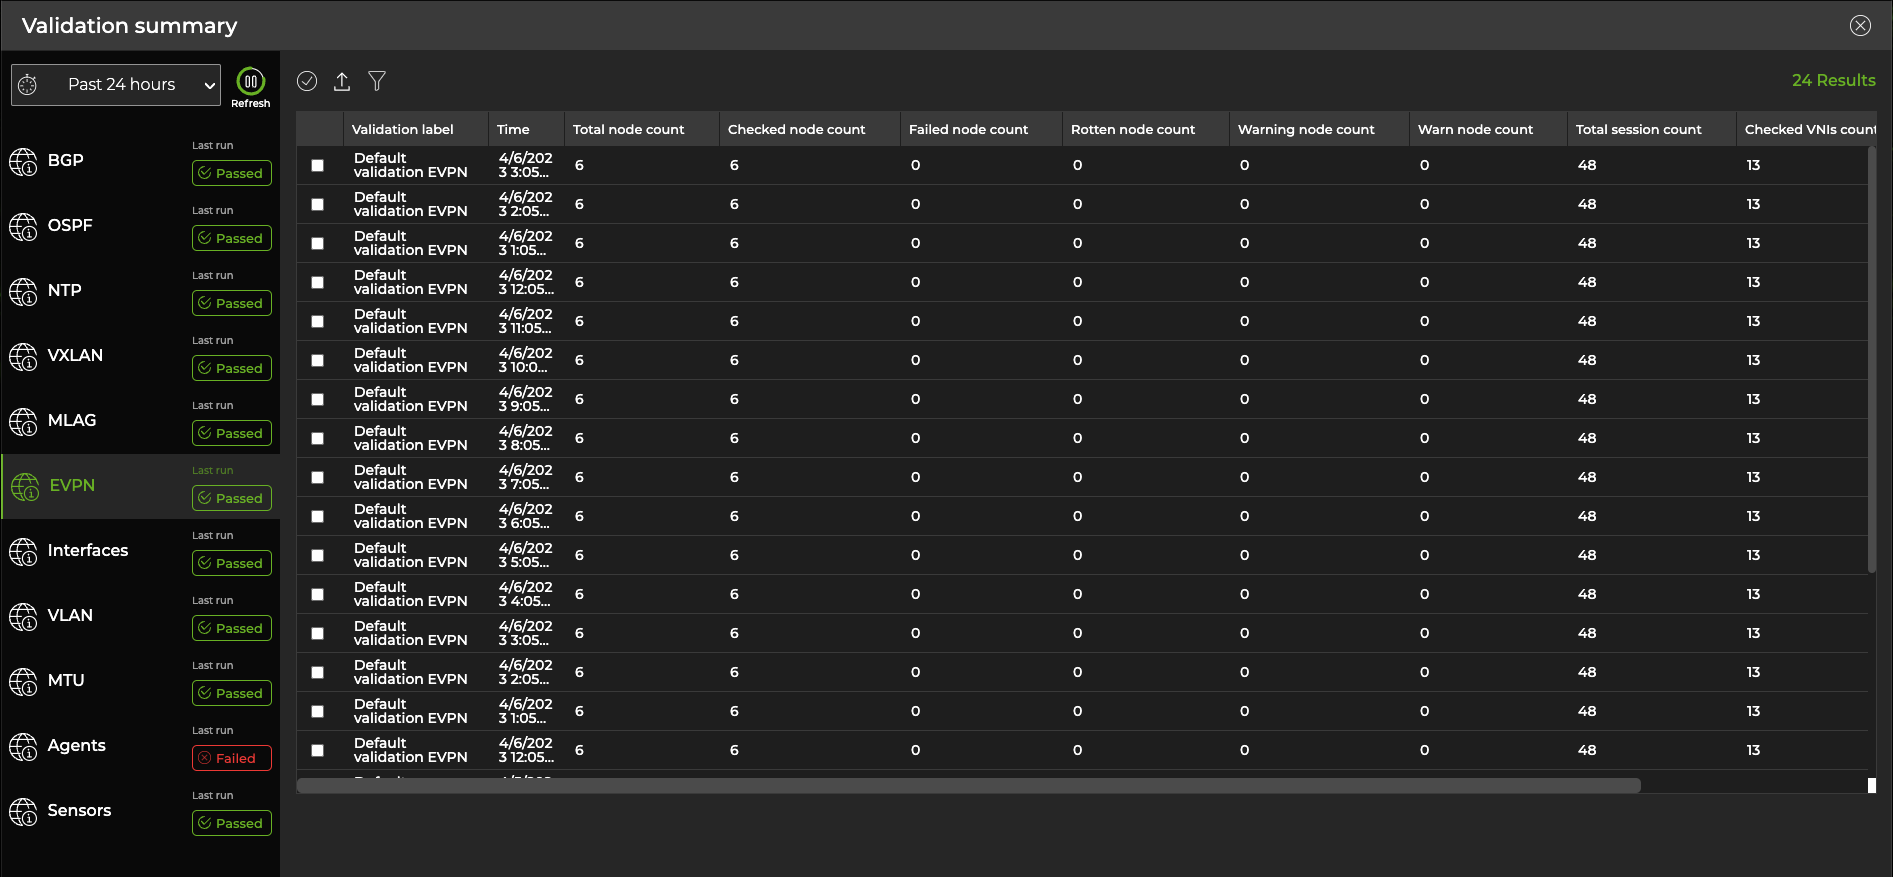
View All Network Protocol and Service Validation Results
Expand the Validation Summary card to full-screen to view all validation check results for all network protocols and services during a designated time period.