Integrate NetQ with Grafana
Switches collect statistics about the performance of their interfaces. The NetQ Agent on each switch collects these statistics every 15 seconds and then sends them to your NetQ appliance or virtual machine.
NetQ collects statistics for physical interfaces; it does not collect statistics for virtual interfaces, such as bonds, bridges, and VXLANs.
NetQ displays:
- Transmit with tx_ prefix: bytes, carrier, colls, drop, errs, packets
- Receive with rx_ prefix: bytes, drop, errs, frame, multicast, packets
You can use Grafana, an open source analytics and monitoring tool, to view these statistics. The fastest way to achieve this is by installing Grafana on an application server or locally per user, and then installing the NetQ plugin.
If you do not have Grafana installed already, refer to grafana.com for instructions on installing and configuring the Grafana tool.
Install NetQ Plugin for Grafana
Use the Grafana CLI to install the NetQ plugin. For more detail about this command, refer to the Grafana CLI documentation.
The Grafana plugin comes unsigned. Before you can install it, you need to update the grafana.ini file then restart the Grafana service:
Edit the
/etc/grafana/grafana.inifile and addallow_loading_unsigned_plugins = netq-dashboardunderplugins:cumulus@netq-appliance:~$ sudo nano /etc/grafana/grafana.ini ... allow_loading_unsigned_plugins = netq-dashboard ...If you are using Grafana v11.0 or later, add support for AngularJS to the same file under
security:cumulus@netq-appliance:~$ sudo nano /etc/grafana/grafana.ini ... angular_support_enabled = true ...Restart the Grafana service:
cumulus@netq-appliance:~$ sudo systemctl restart grafana-server.service
Then install the plugin:
cumulus@netq-appliance:~$ grafana-cli --pluginUrl https://netq-grafana-dsrc.s3-us-west-2.amazonaws.com/NetQ-DSplugin-3.3.1-plus.zip plugins install netq-dashboard
installing netq-dashboard @
from: https://netq-grafana-dsrc.s3-us-west-2.amazonaws.com/NetQ-DSplugin-3.3.1-plus.zip
into: /usr/local/var/lib/grafana/plugins

✔ Installed netq-dashboard successfully
After installing the plugin, you must restart Grafana, following the steps specific to your implementation.
Set Up the NetQ Data Source
Now that you have the plugin installed, you need to configure access to the NetQ data source.
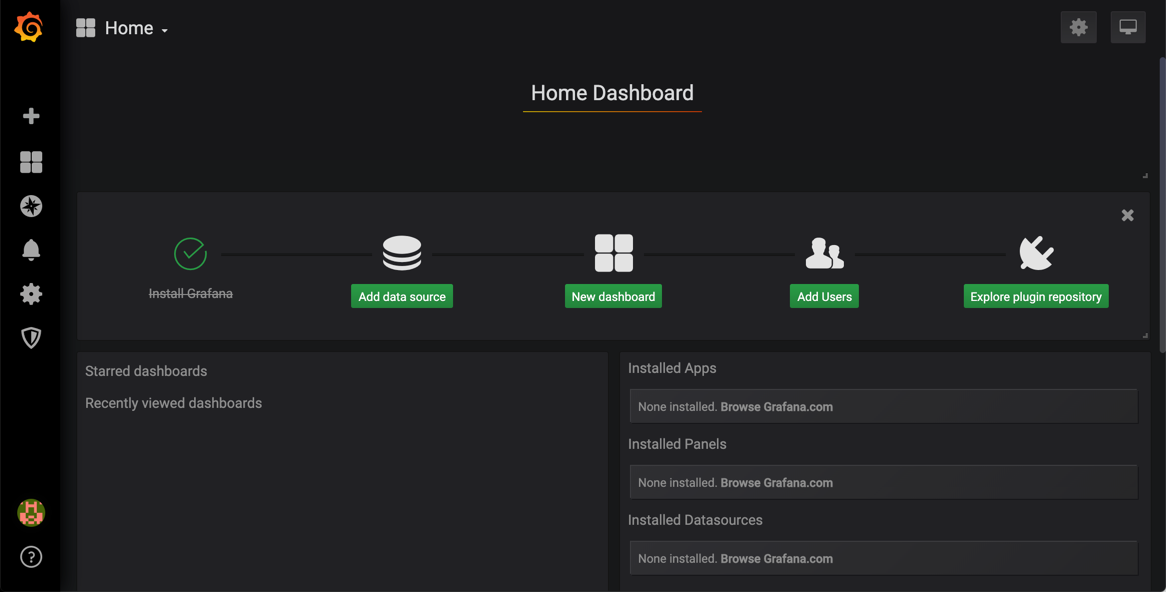
Open the Grafana user interface and log in. Navigate to the Home Dashboard:
Click Add data source or
 > Data Sources.
Enter Net-Q in the search box. Alternately, scroll down to the Other category, and select it from there.
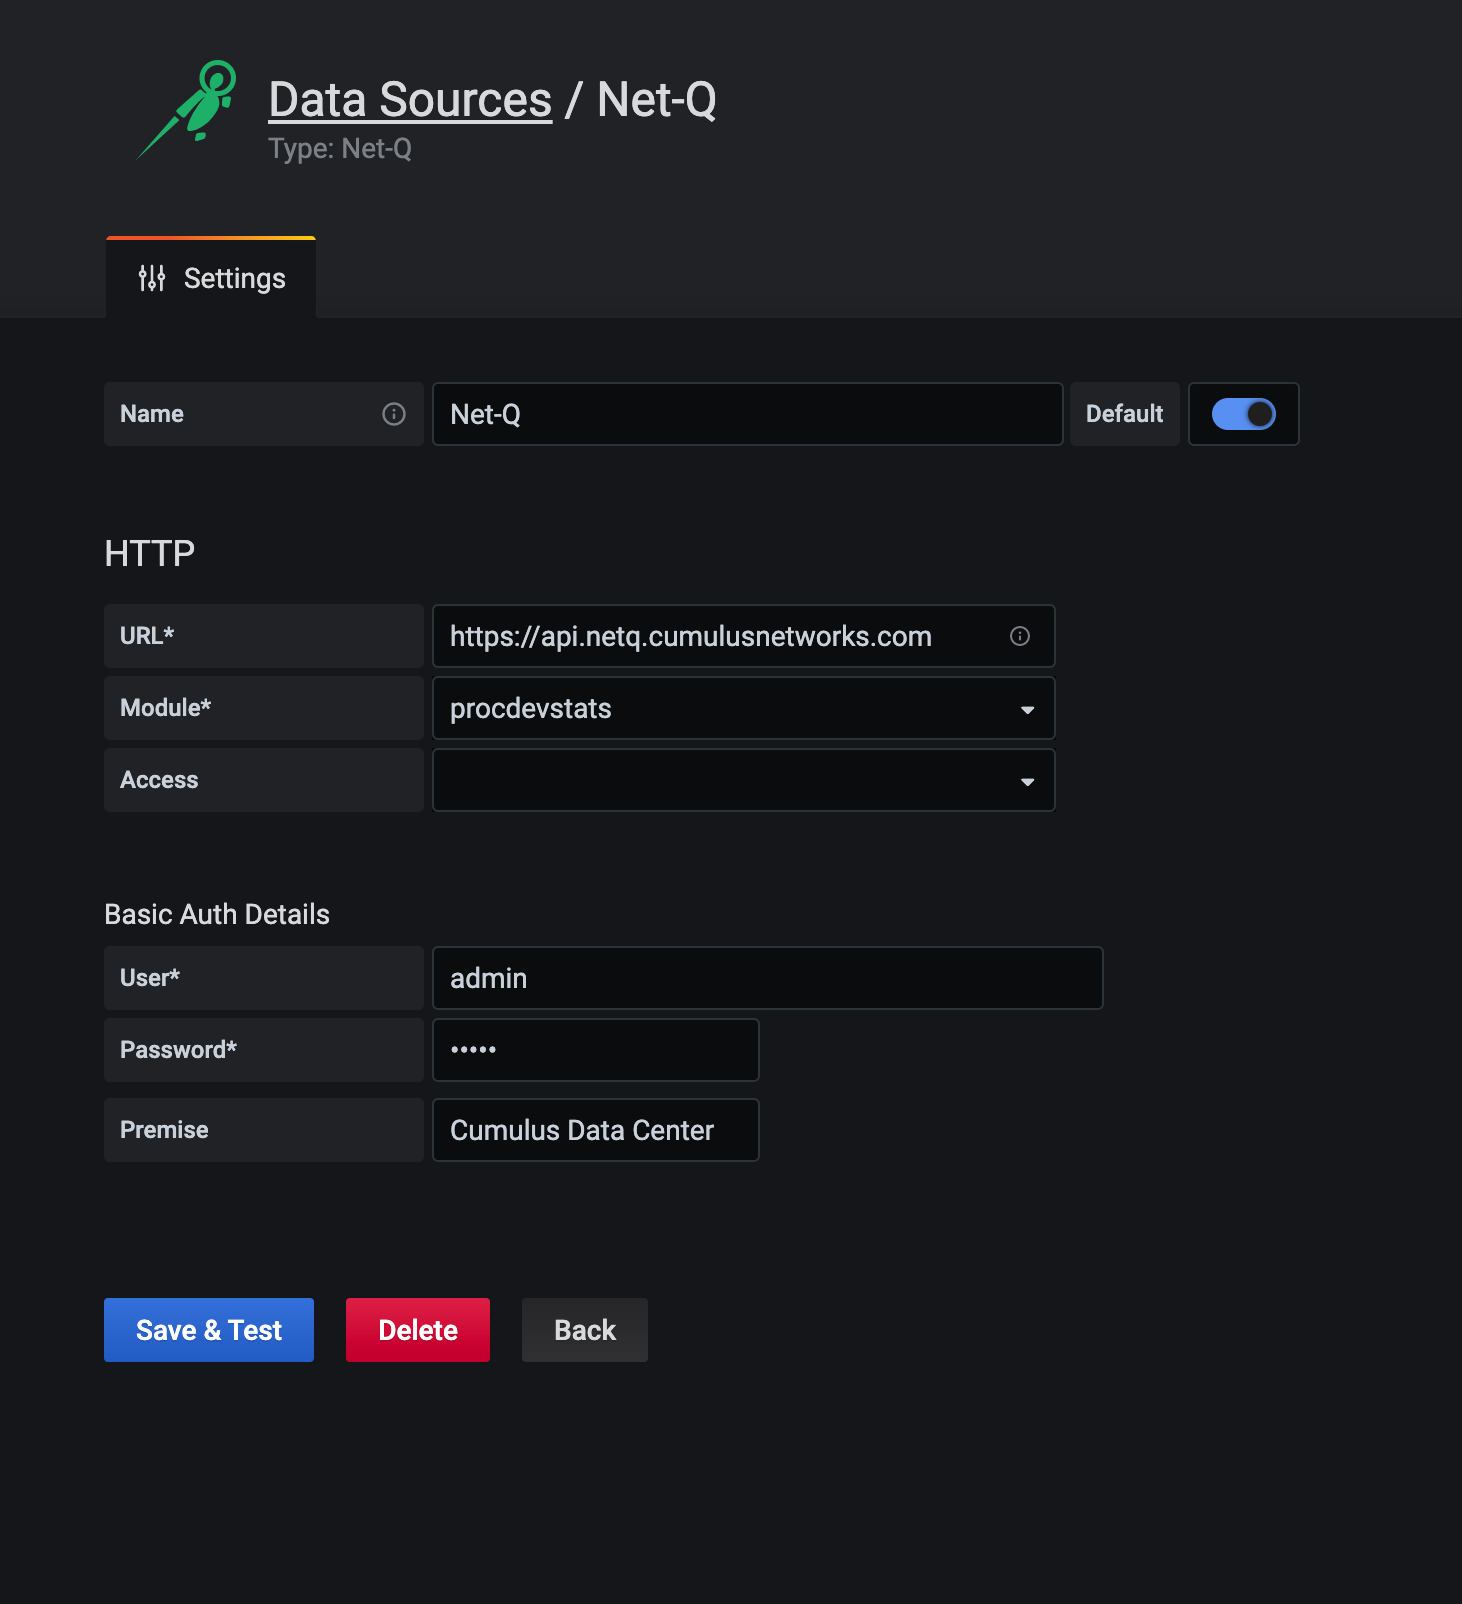
Enter Net-Q into the Name field.
Enter the URL used to access the database:
- Cloud: https://plugin.prod.netq.nvidia.com
- On-premises: http://<hostname-or-ipaddr-of-netq-appl-or-vm>/plugin
- Cumulus in the Cloud (CITC): plugin.air.netq.nvidia.com
From the Module dropdown, select procdevstats.
Enter your credentials (the ones used to log in).
For NetQ cloud deployments only, if you have more than one premises configured, you can select the premises you want to view, as follows:
- If you leave the Premises field blank, the first premises name is selected by default.
- If you enter a premises name, that premises is selected for viewing.
- If multiple premises are configured with the same name, then the first listed premises is displayed.
- Select Save & Test.
Create Your NetQ Dashboard
After you configure the data source, you can create a customizable dashboard with transmit and receive statistics.
Create a Dashboard
Click
 to open a blank dashboard.
Click
(Dashboard Settings) at the top of the dashboard.
Add Variables
Click Variables.
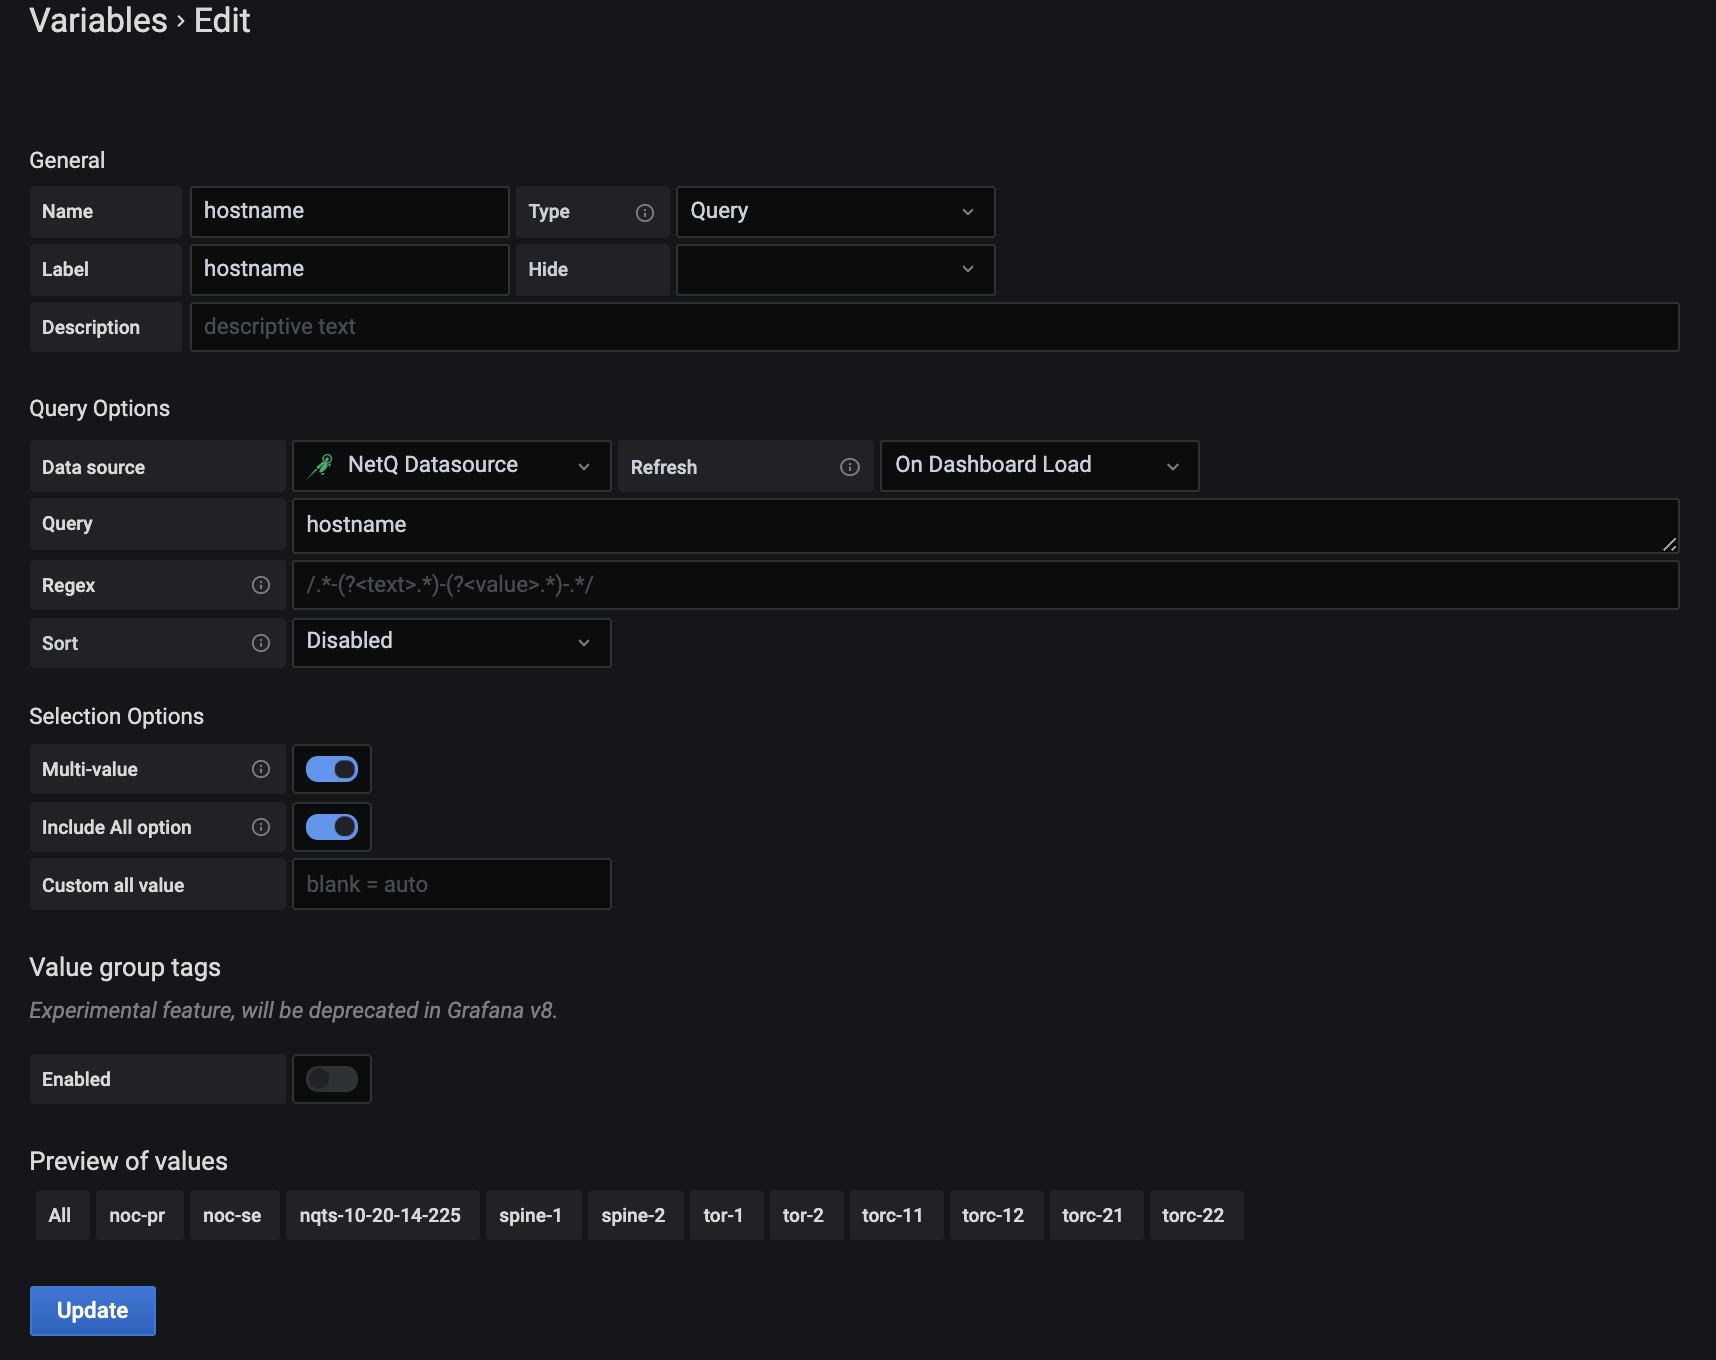
In the Name field, enter hostname.
In the Label field, enter hostname.
From the Data source list, select Net-Q.
From the Refresh list, select On Dashboard Load.
In the Query field, enter hostname.
Click Add.
You should see a preview at the bottom of the hostname values.
Click Variables to add another variable for the interface name.
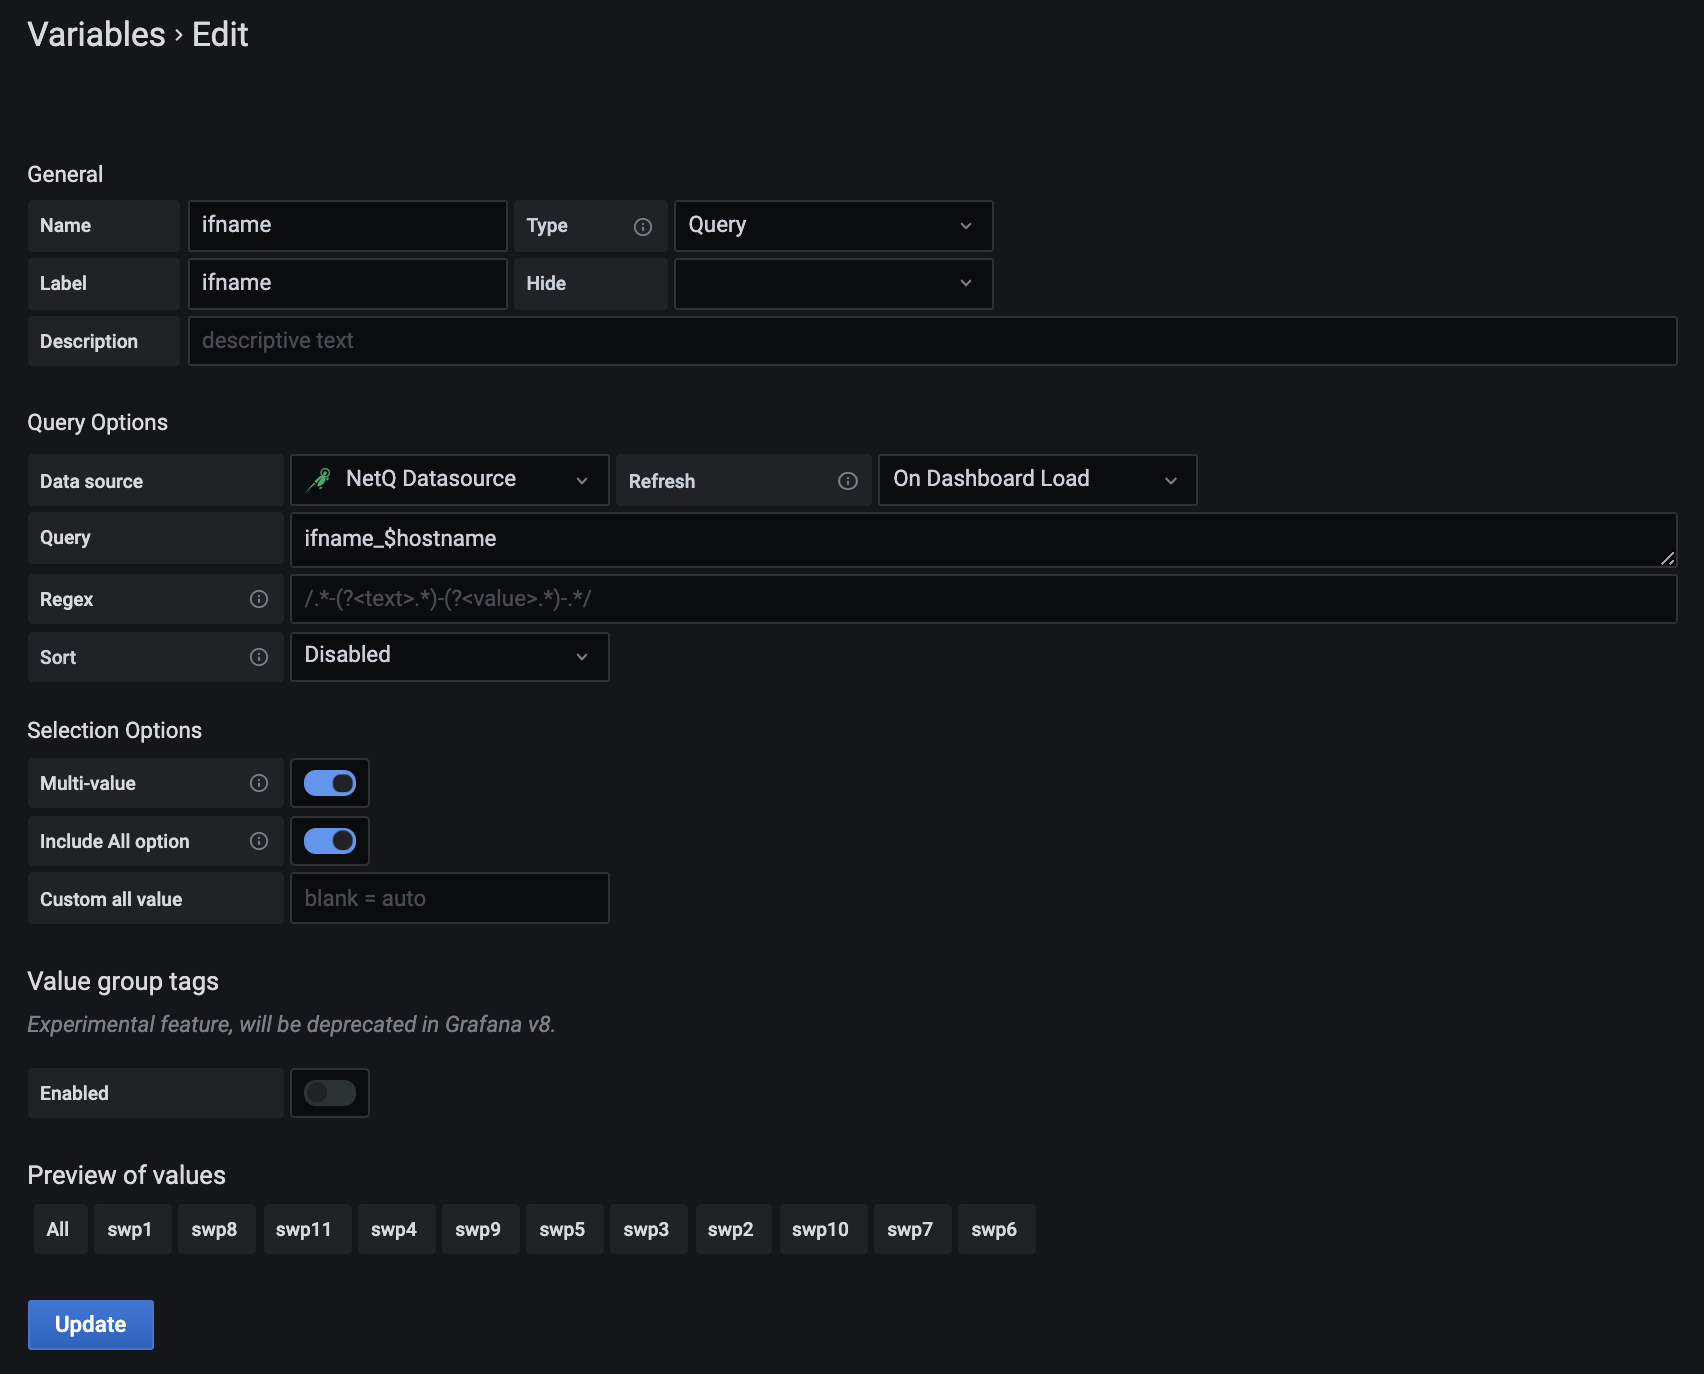
In the Name field, enter ifname.
In the Label field, enter ifname.
From the Data source list, select Net-Q.
From the Refresh list, select On Dashboard Load.
In the Query field, enter ifname.
Click Add.
You should see a preview at the bottom of the ifname values.
Click Variables to add a variable for metrics.
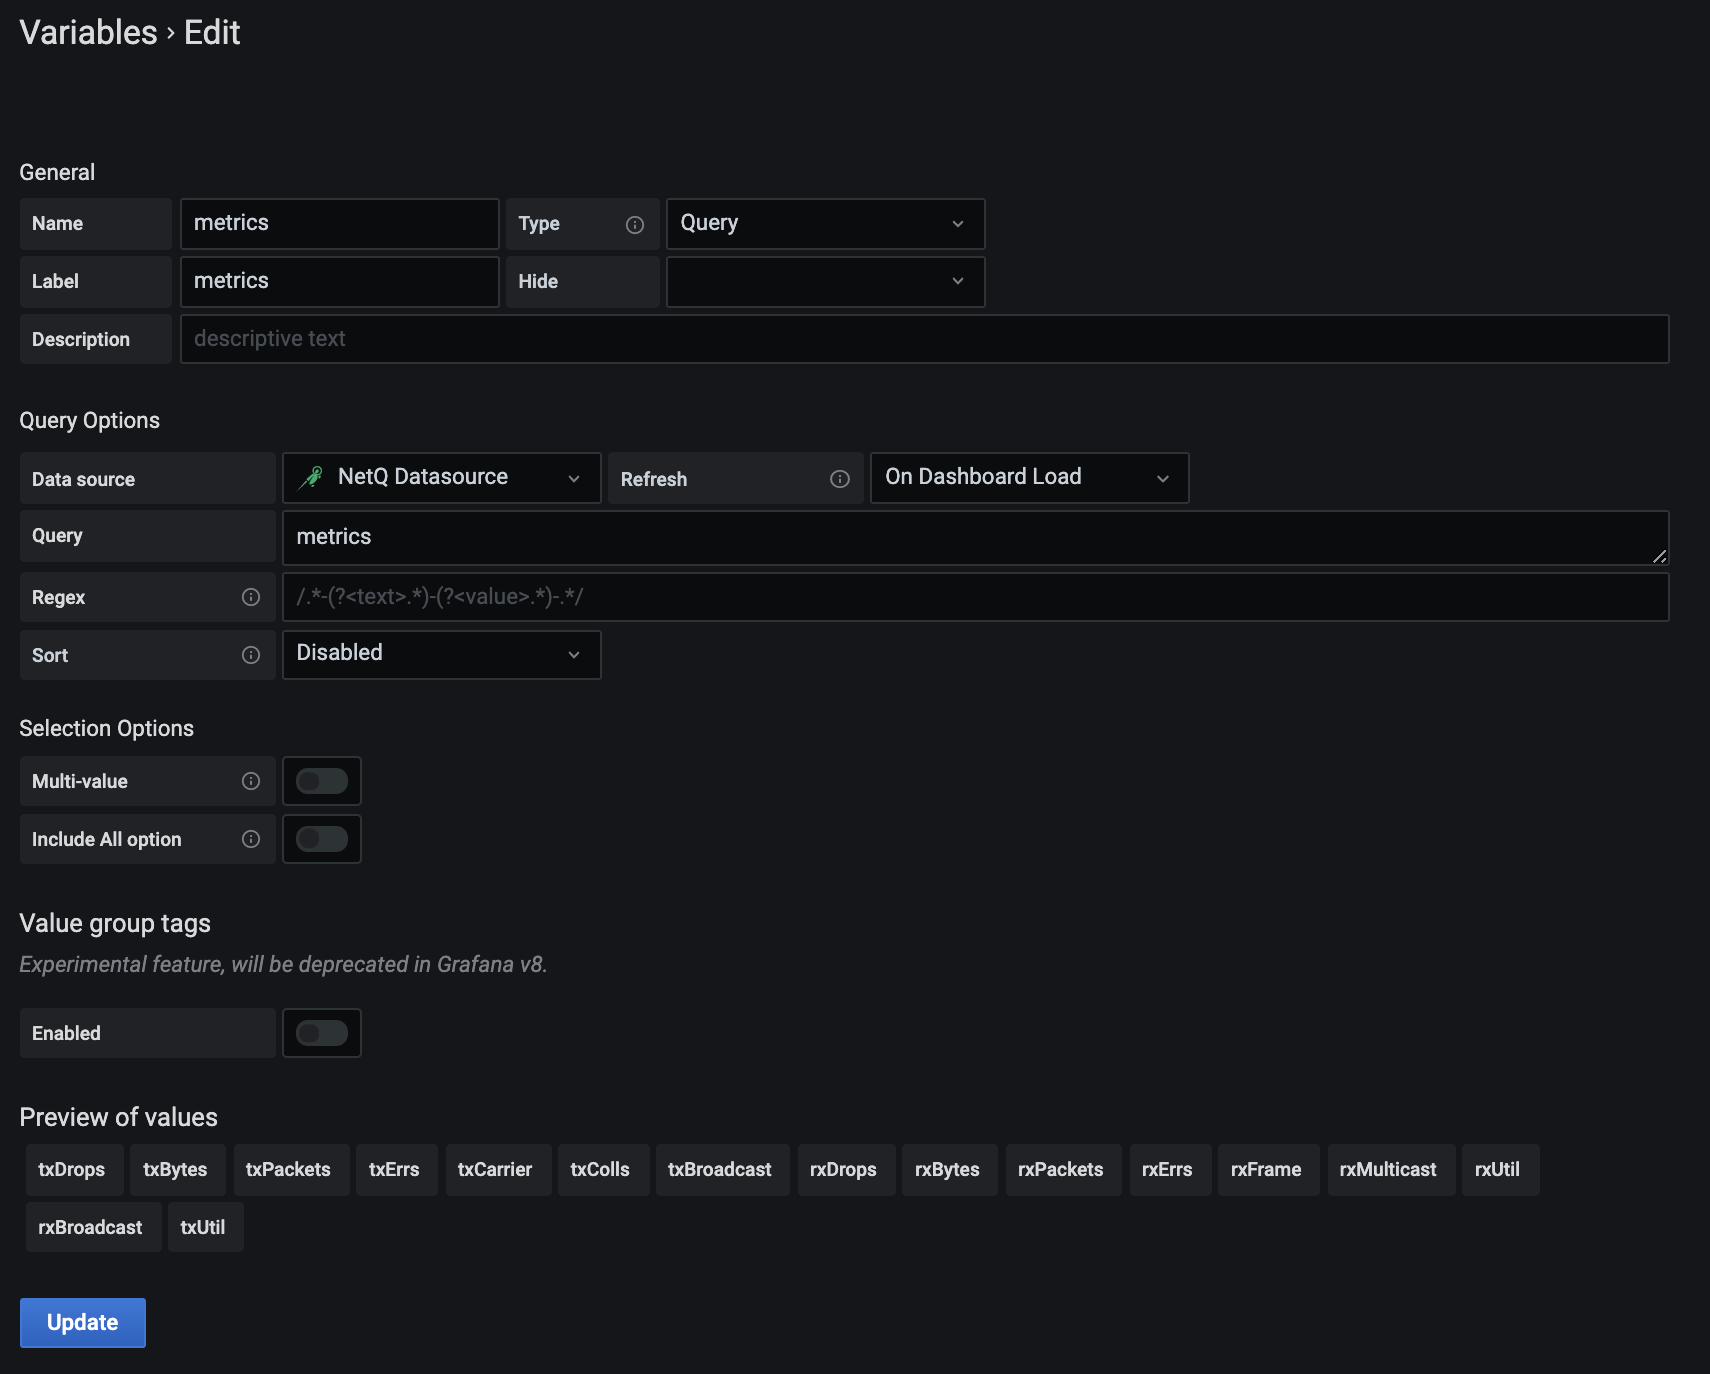
In the Name field, enter metrics.
In the Label field, enter metrics.
From the Data source list, select Net-Q.
From the Refresh list, select On Dashboard Load.
In the Query field, enter metrics.
Click Add.
You should see a preview at the bottom of the metrics values.
Add Charts
Now that the variables are defined, click
 to return to the new dashboard.
Click Add Query.
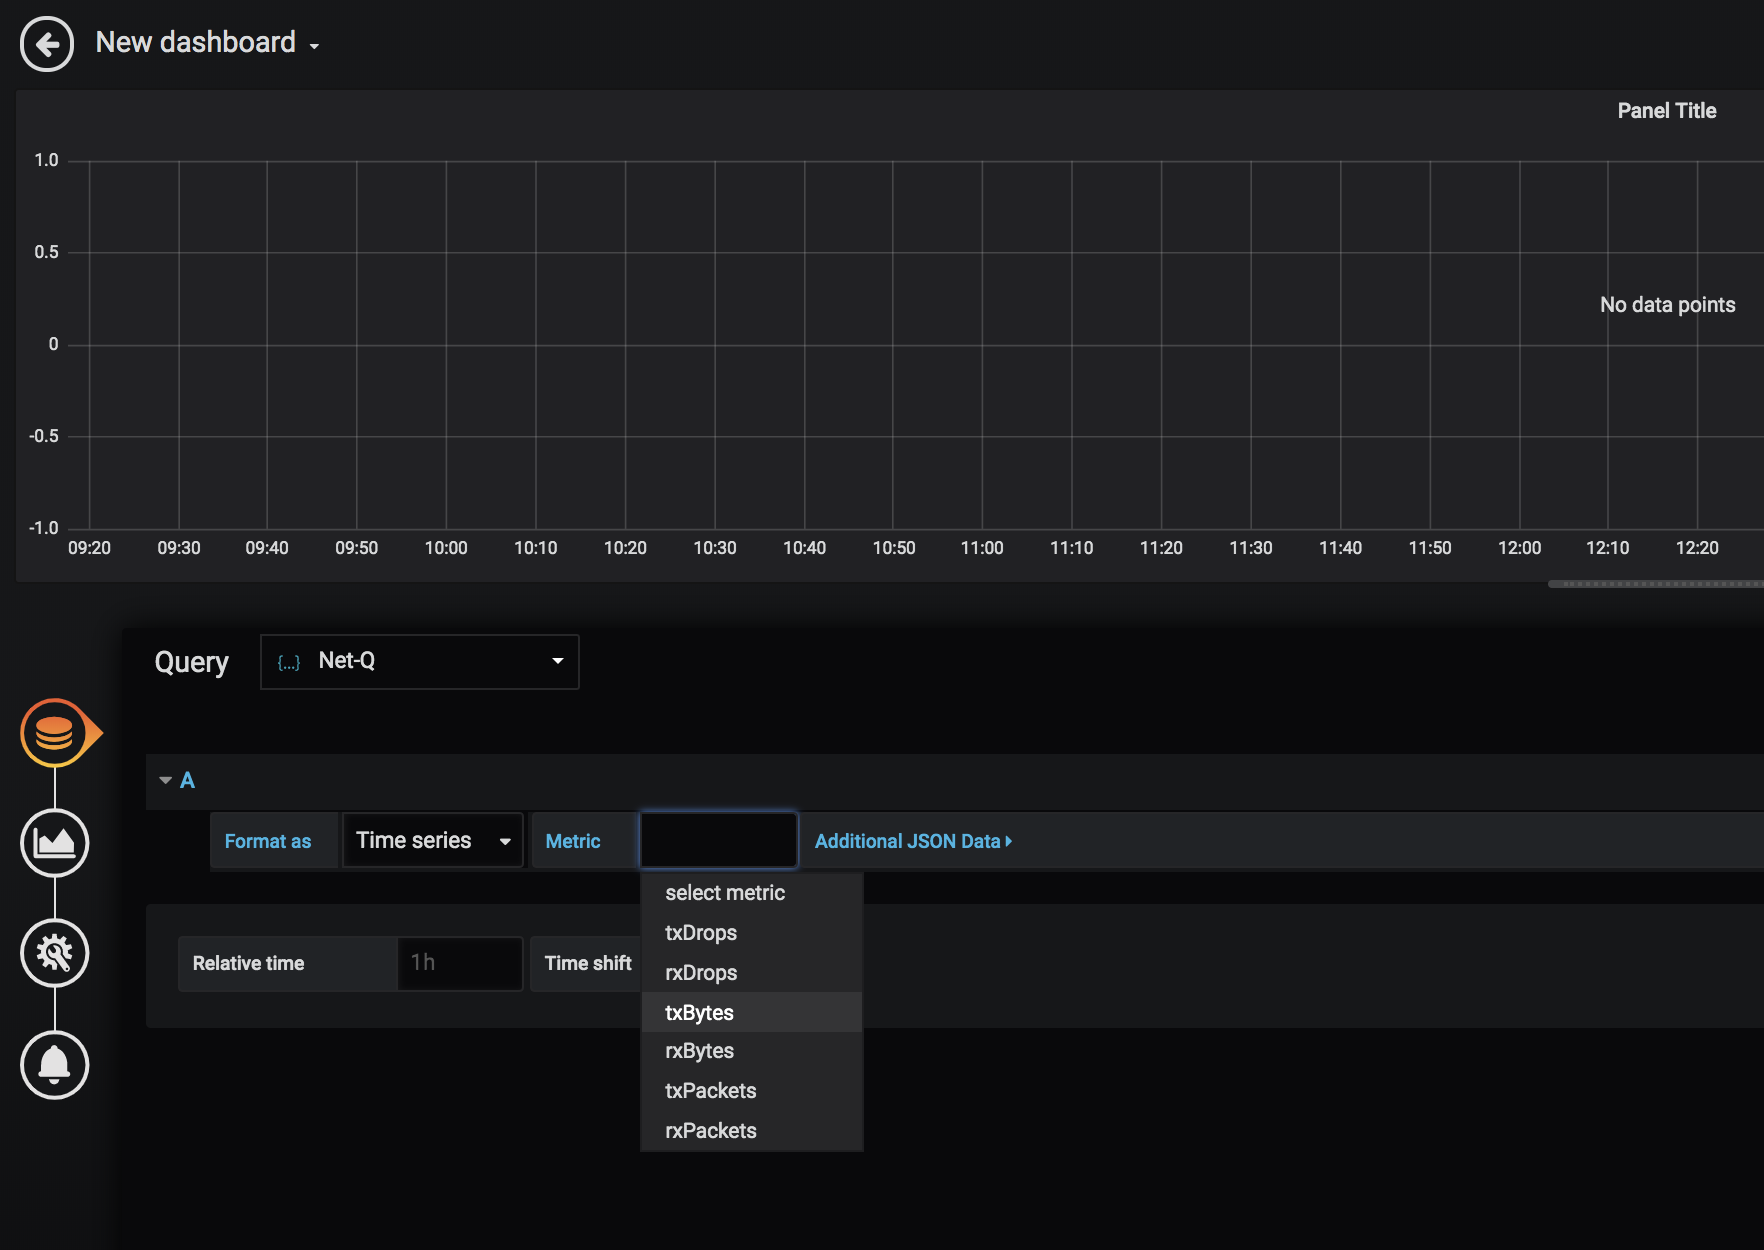
From the Query source list, select Net-Q.
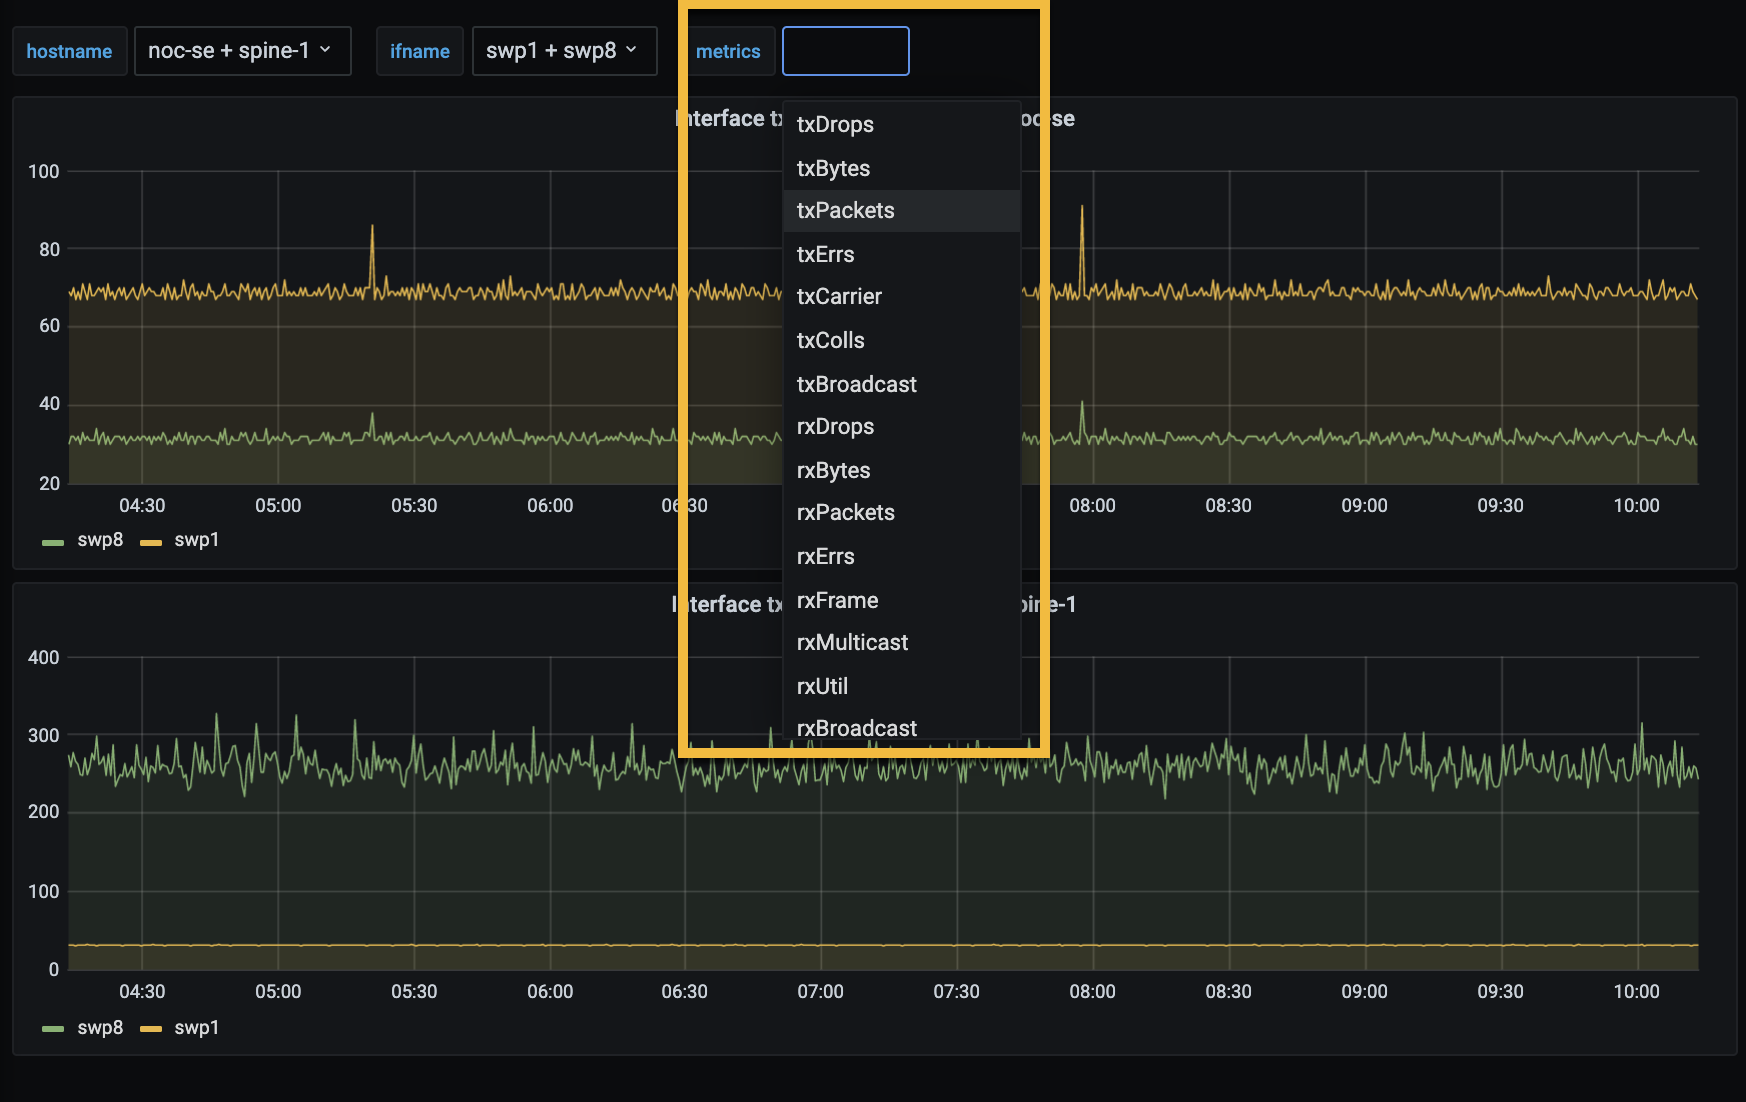
Select the interface statistic you want to view from the Metric list.
Click the General icon.
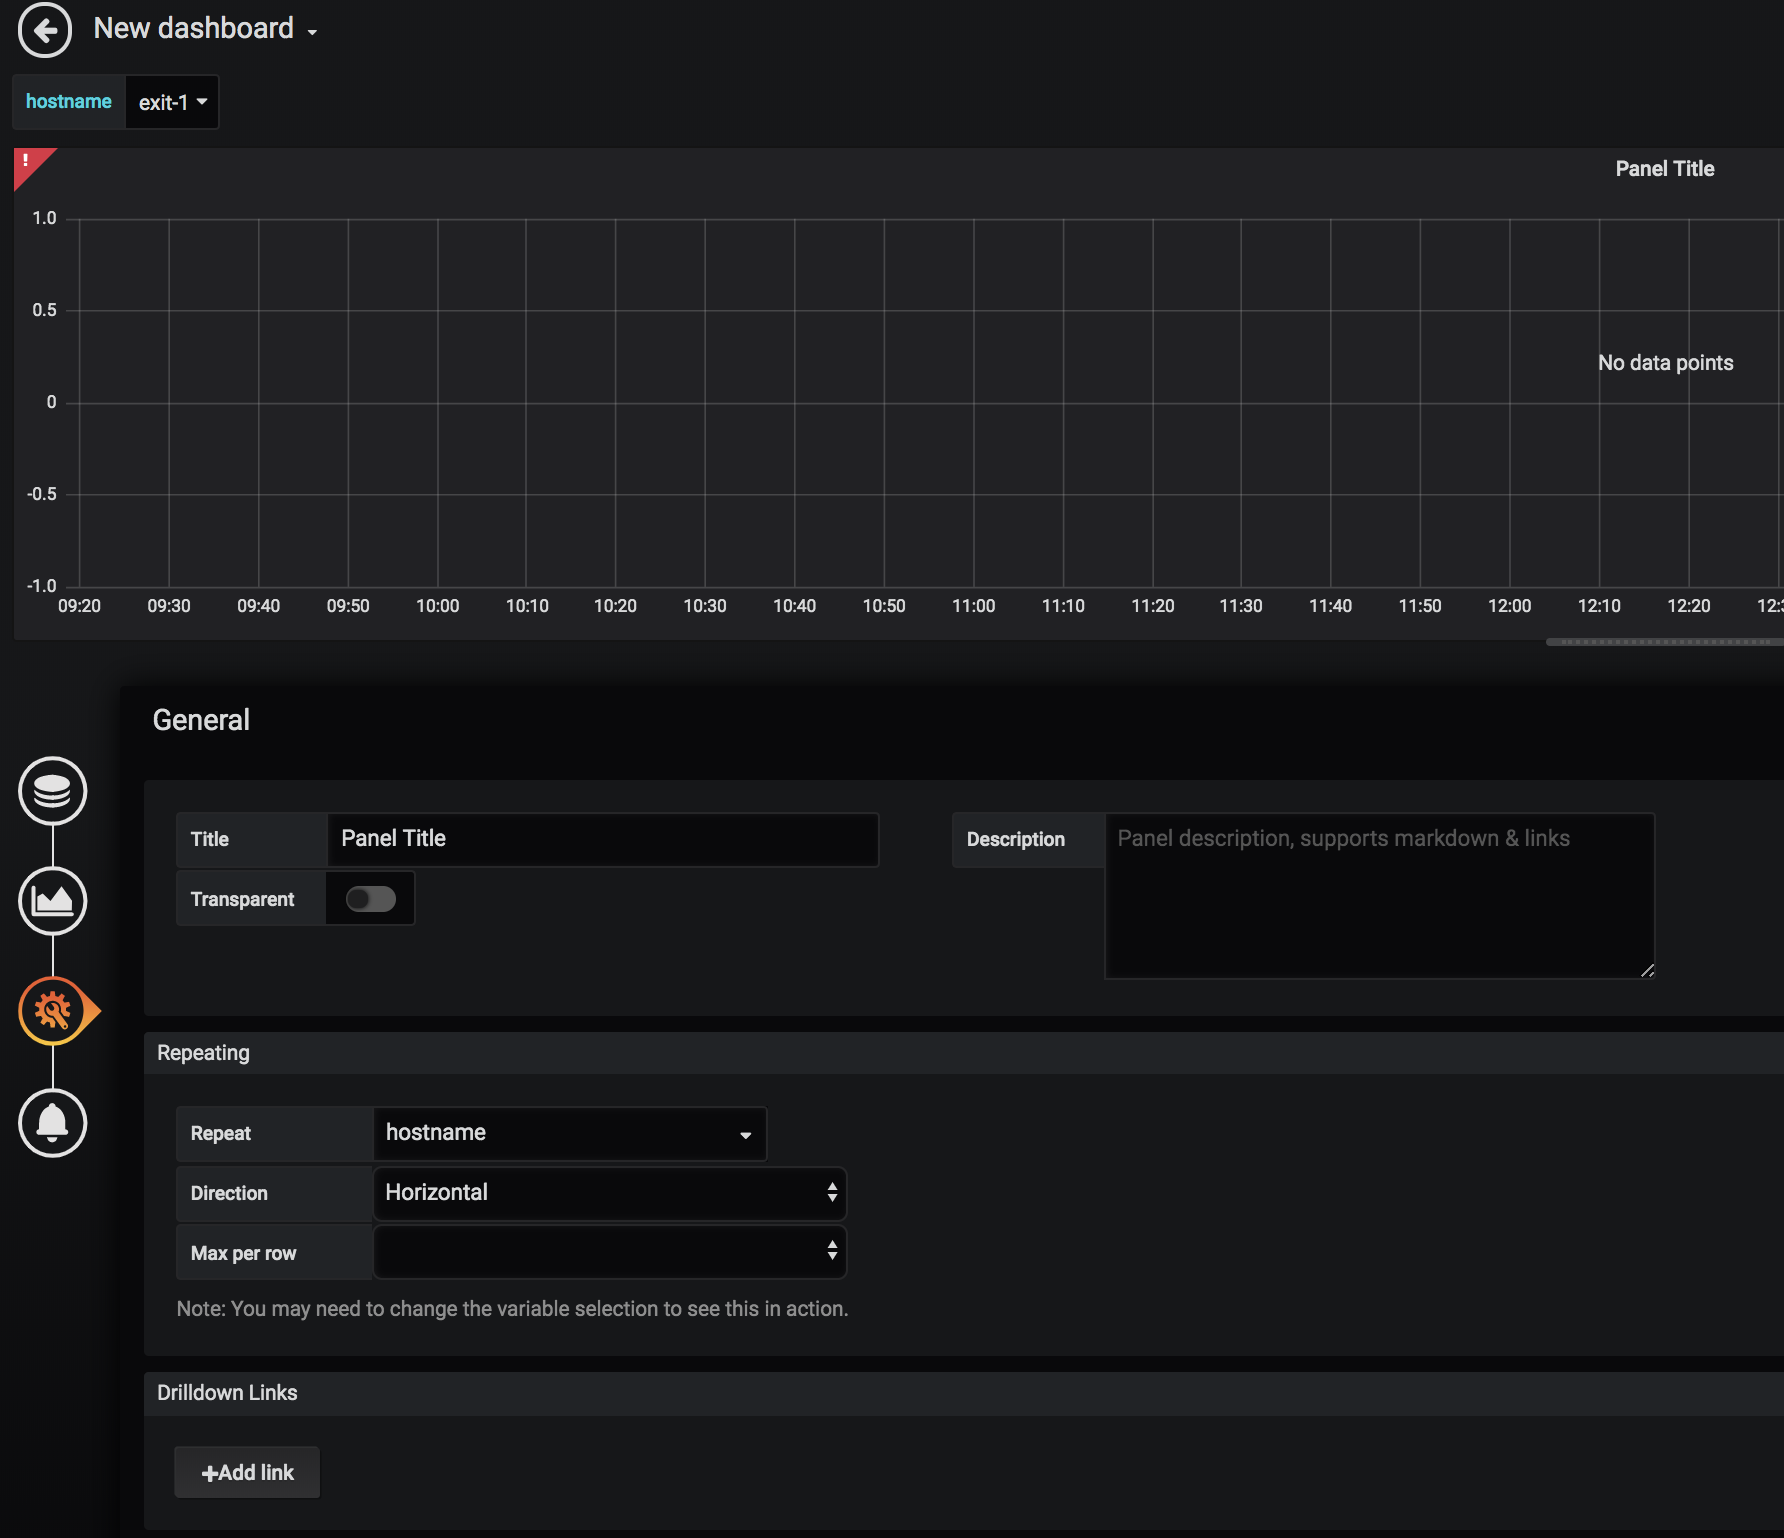
From the Repeat list, select hostname.
Set any other parameters around how to display the data.
Return to the dashboard.
Select one or more hostnames from the hostname list.
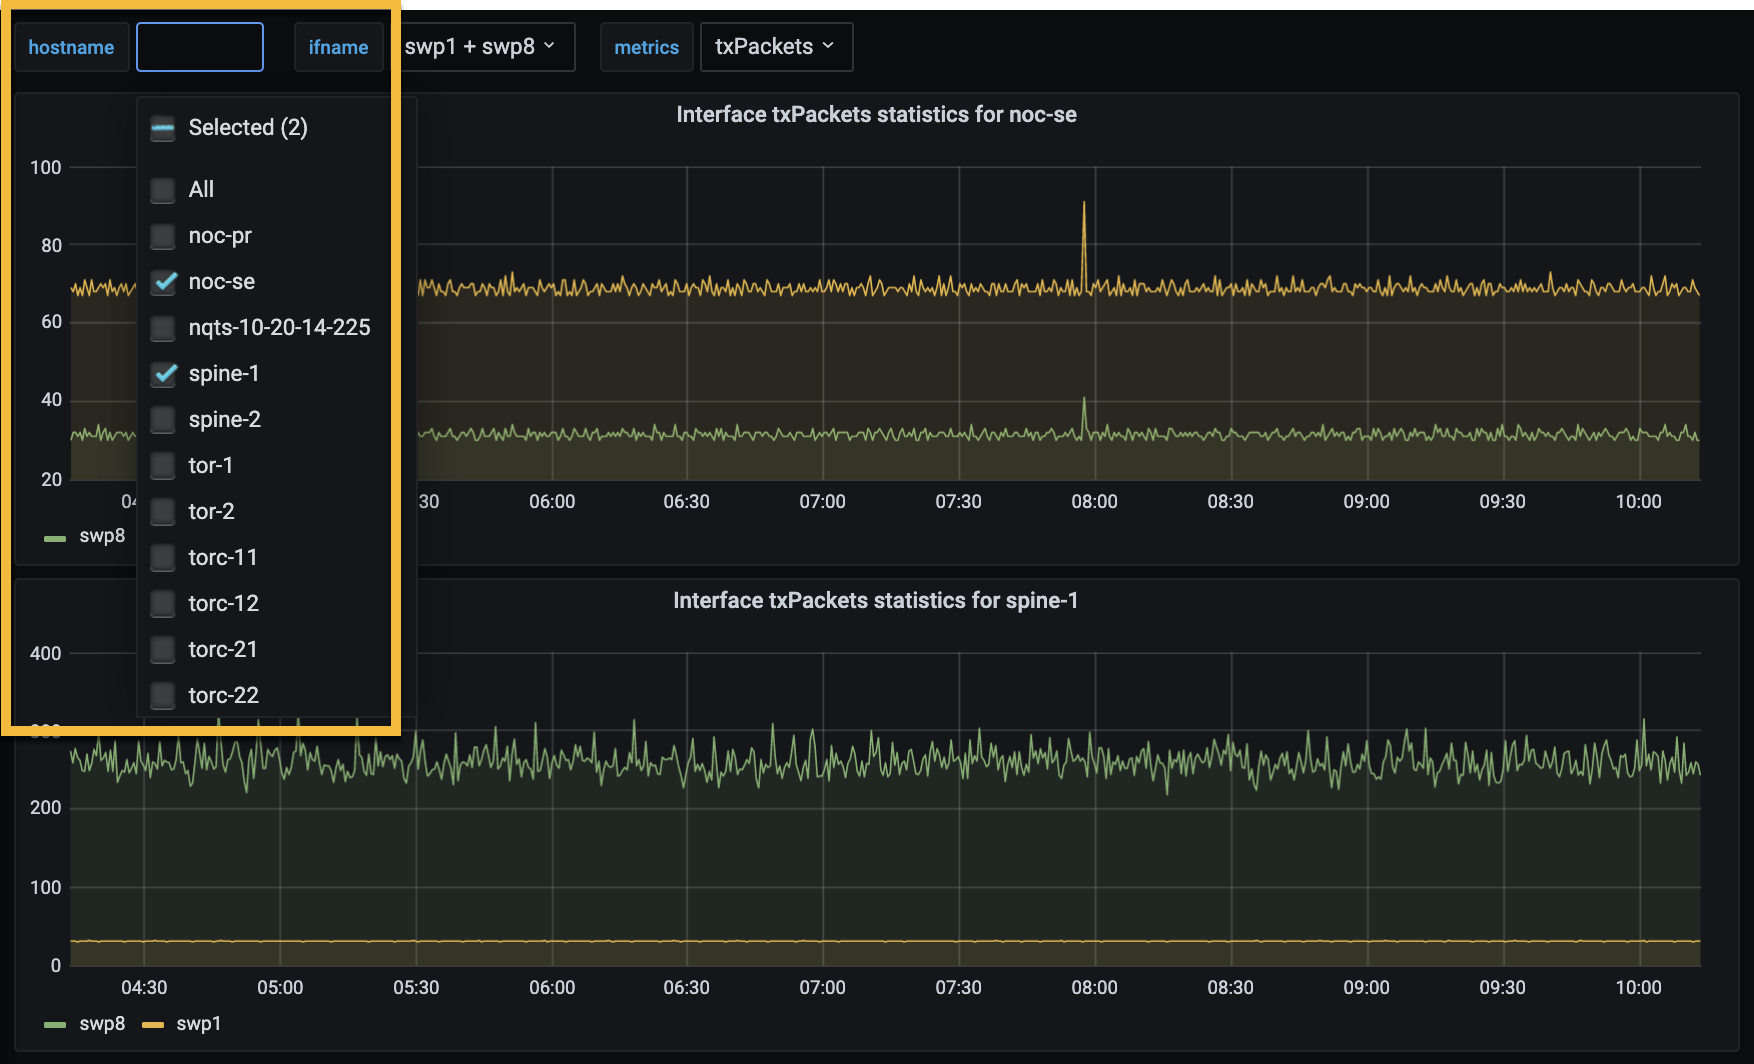
Select one or more interface names from the ifname list.
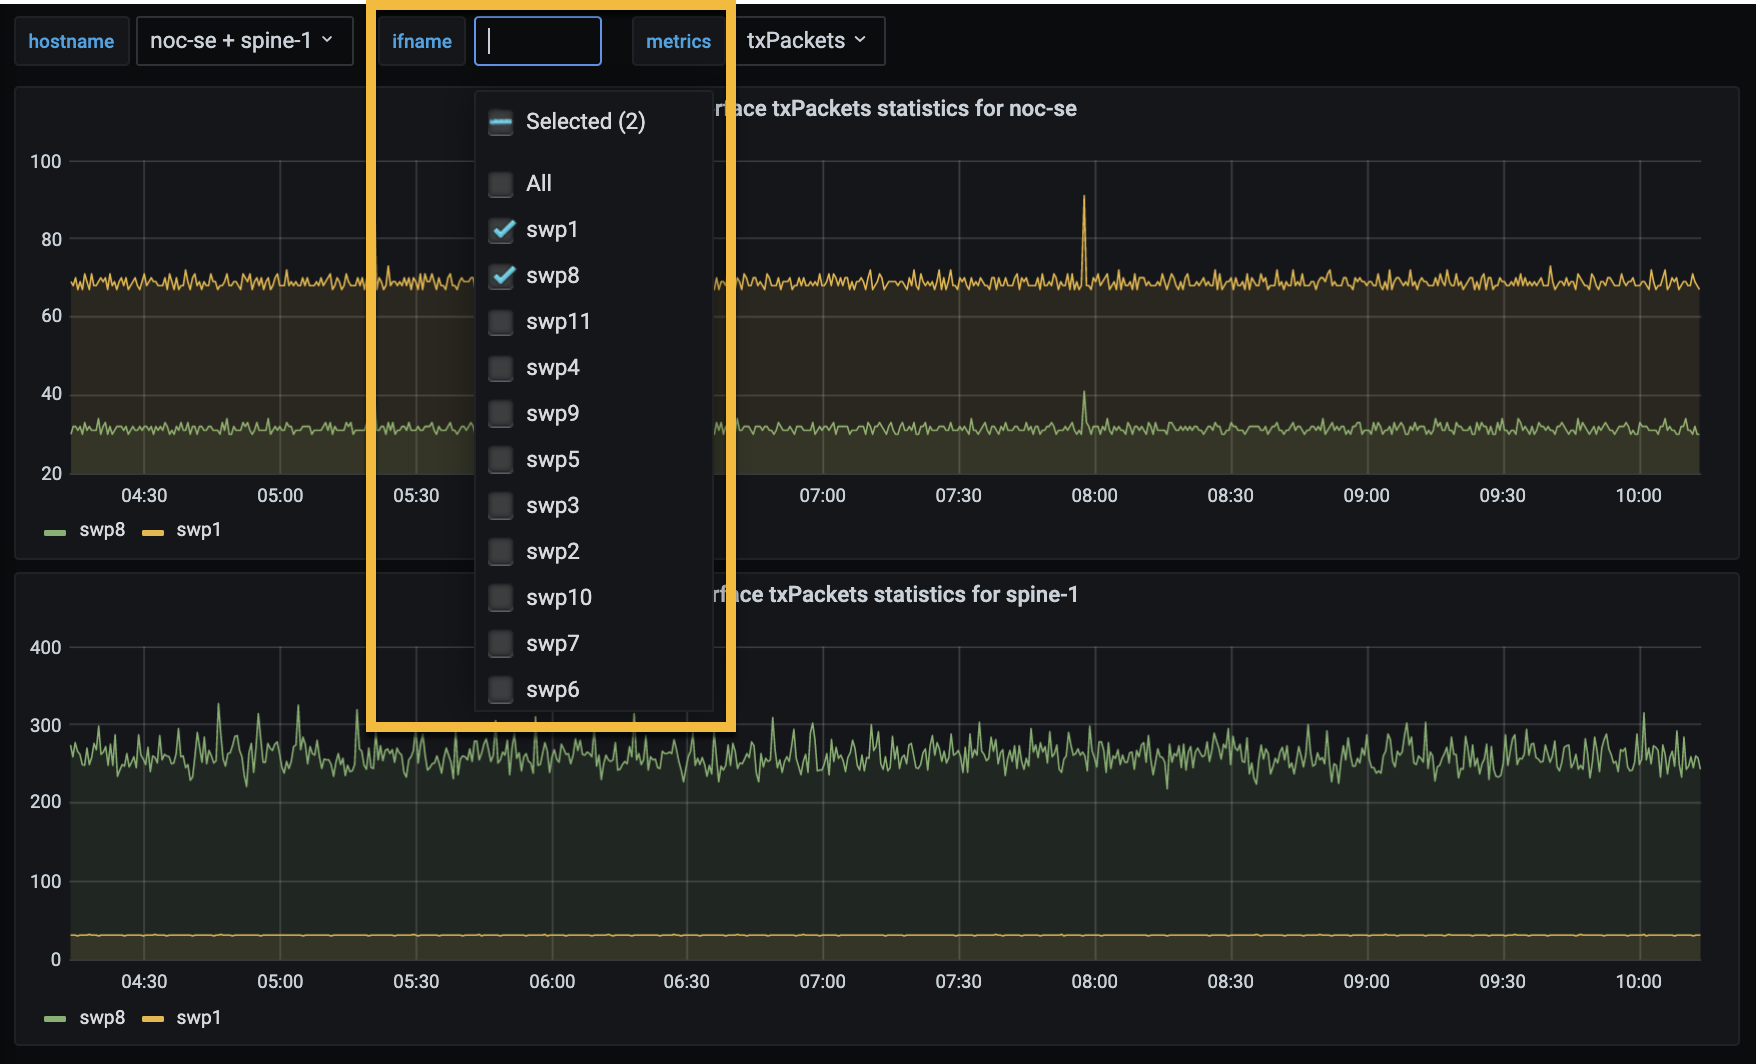
Select one or more metrics to display for these hostnames and interfaces from the metrics list.
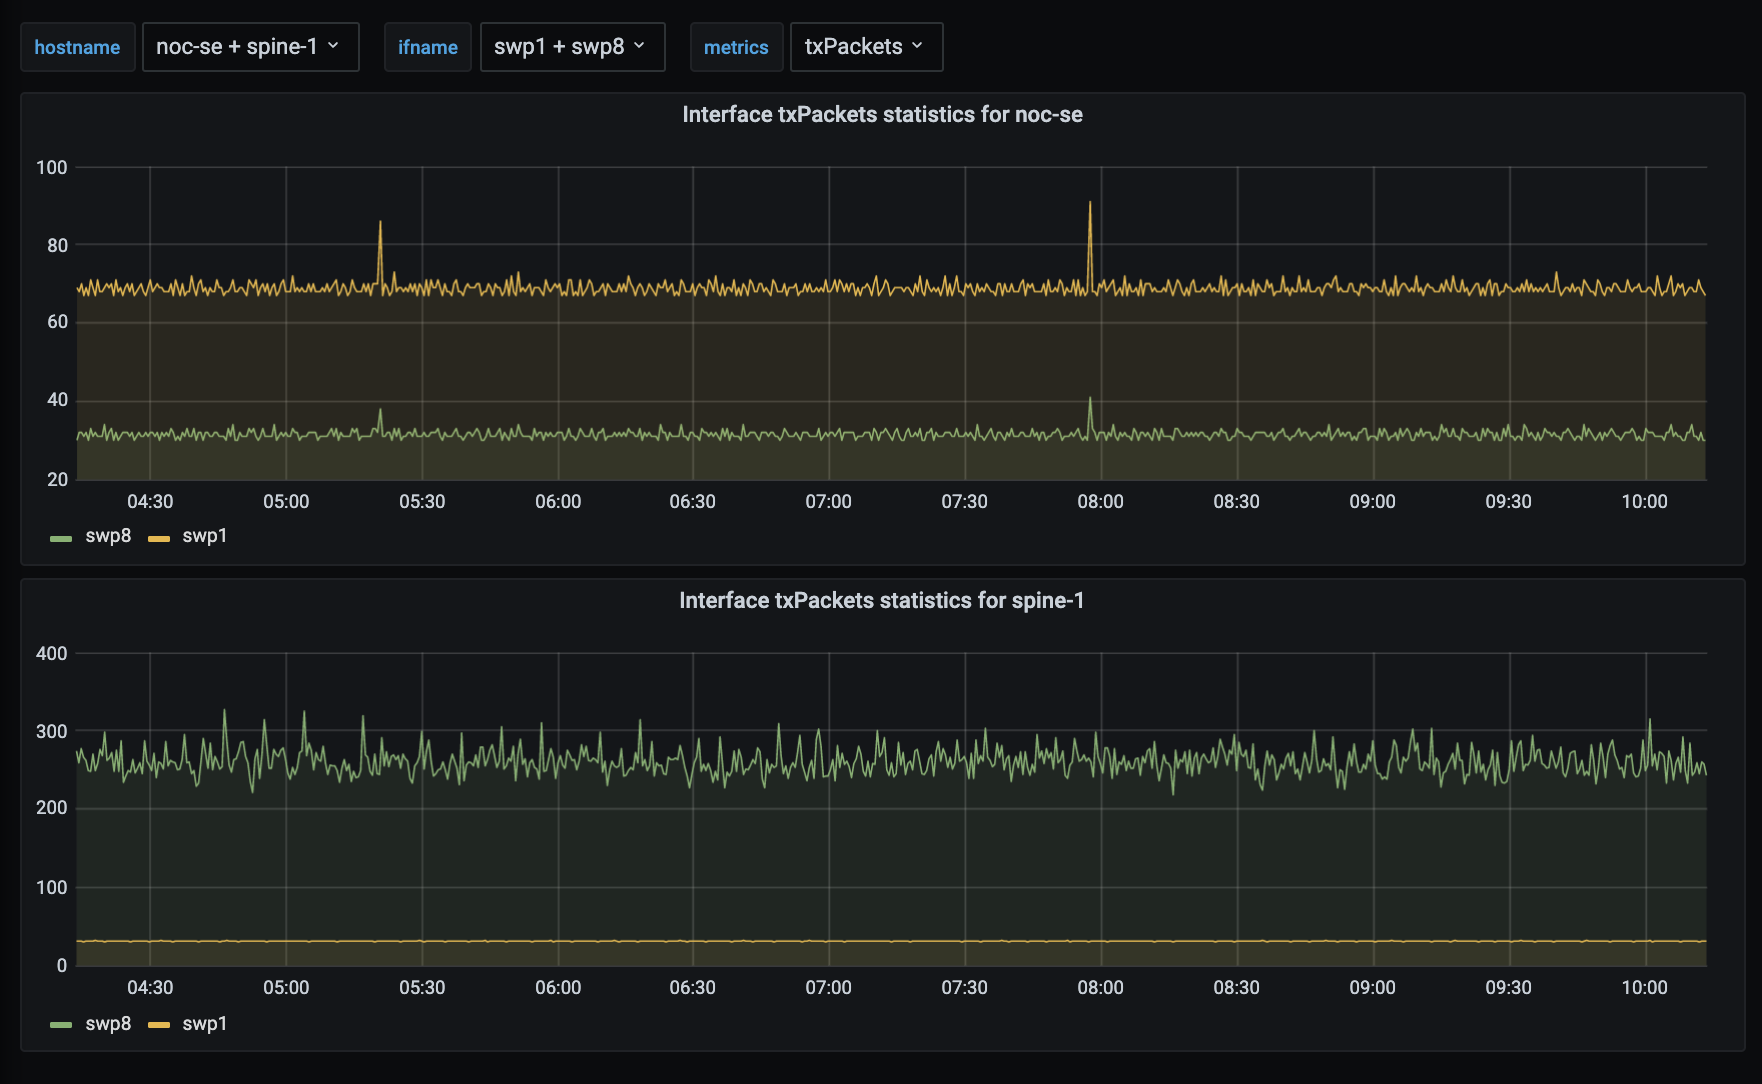
The following example shows a dashboard with two hostnames, two interfaces, and one metric selected. The more values you select from the variable options, the more charts appear on your dashboard.
Analyze the Data
After you have configured the dashboard, you can start analyzing the data. You can explore the data by modifying the viewing parameters in one of several ways using the dashboard tool set:
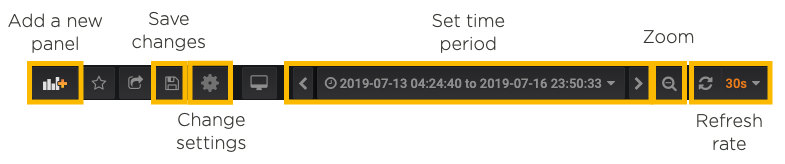
- Select a different time period for the data by clicking the forward or back arrows. The default time range is dependent on the width of your browser window.
- Zoom in on the dashboard by clicking the magnifying glass.
- Manually refresh the dashboard data, or set an automatic refresh rate for the dashboard from the down arrow.
- Add additional panels.
- Click any chart title to edit or remove it from the dashboard.
- Rename the dashboard by clicking the cog wheel and entering the new name.