Adaptive Routing
Adaptive routing is a load balancing feature that improves network utilization for eligible IP packets by selecting forwarding paths dynamically based on the state of the switch, such as queue occupancy and port utilization. You can use the adaptive routing dashboard to view switches with adaptive routing capabilities, events related to adaptive routing, RoCE settings, and egress queue lengths in the form of histograms.
Adaptive routing monitoring is supported on Spectrum-4 switches. It requires a switch fabric running Cumulus Linux 5.5.0 or above. This feature is in beta.
Requirements
To display adaptive routing data, you must have adaptive routing configured on the switch; it can be either enabled or disabled. Switches without an adaptive routing configuration will not appear in the UI or CLI. Additionally, RoCE lossless mode must be enabled to display adaptive routing data. Switches with RoCE lossy mode enabled will appear in the UI and CLI, but will not display adaptive routing data.
Adaptive Routing Commands
Monitor adaptive routing with the netq show adaptive-routing config command.
netq show adaptive-routing config global
netq show adaptive-routing config interface
Access the Adaptive Routing Dashboard
Select
Menu.
Under the Network section, select Adaptive routing.
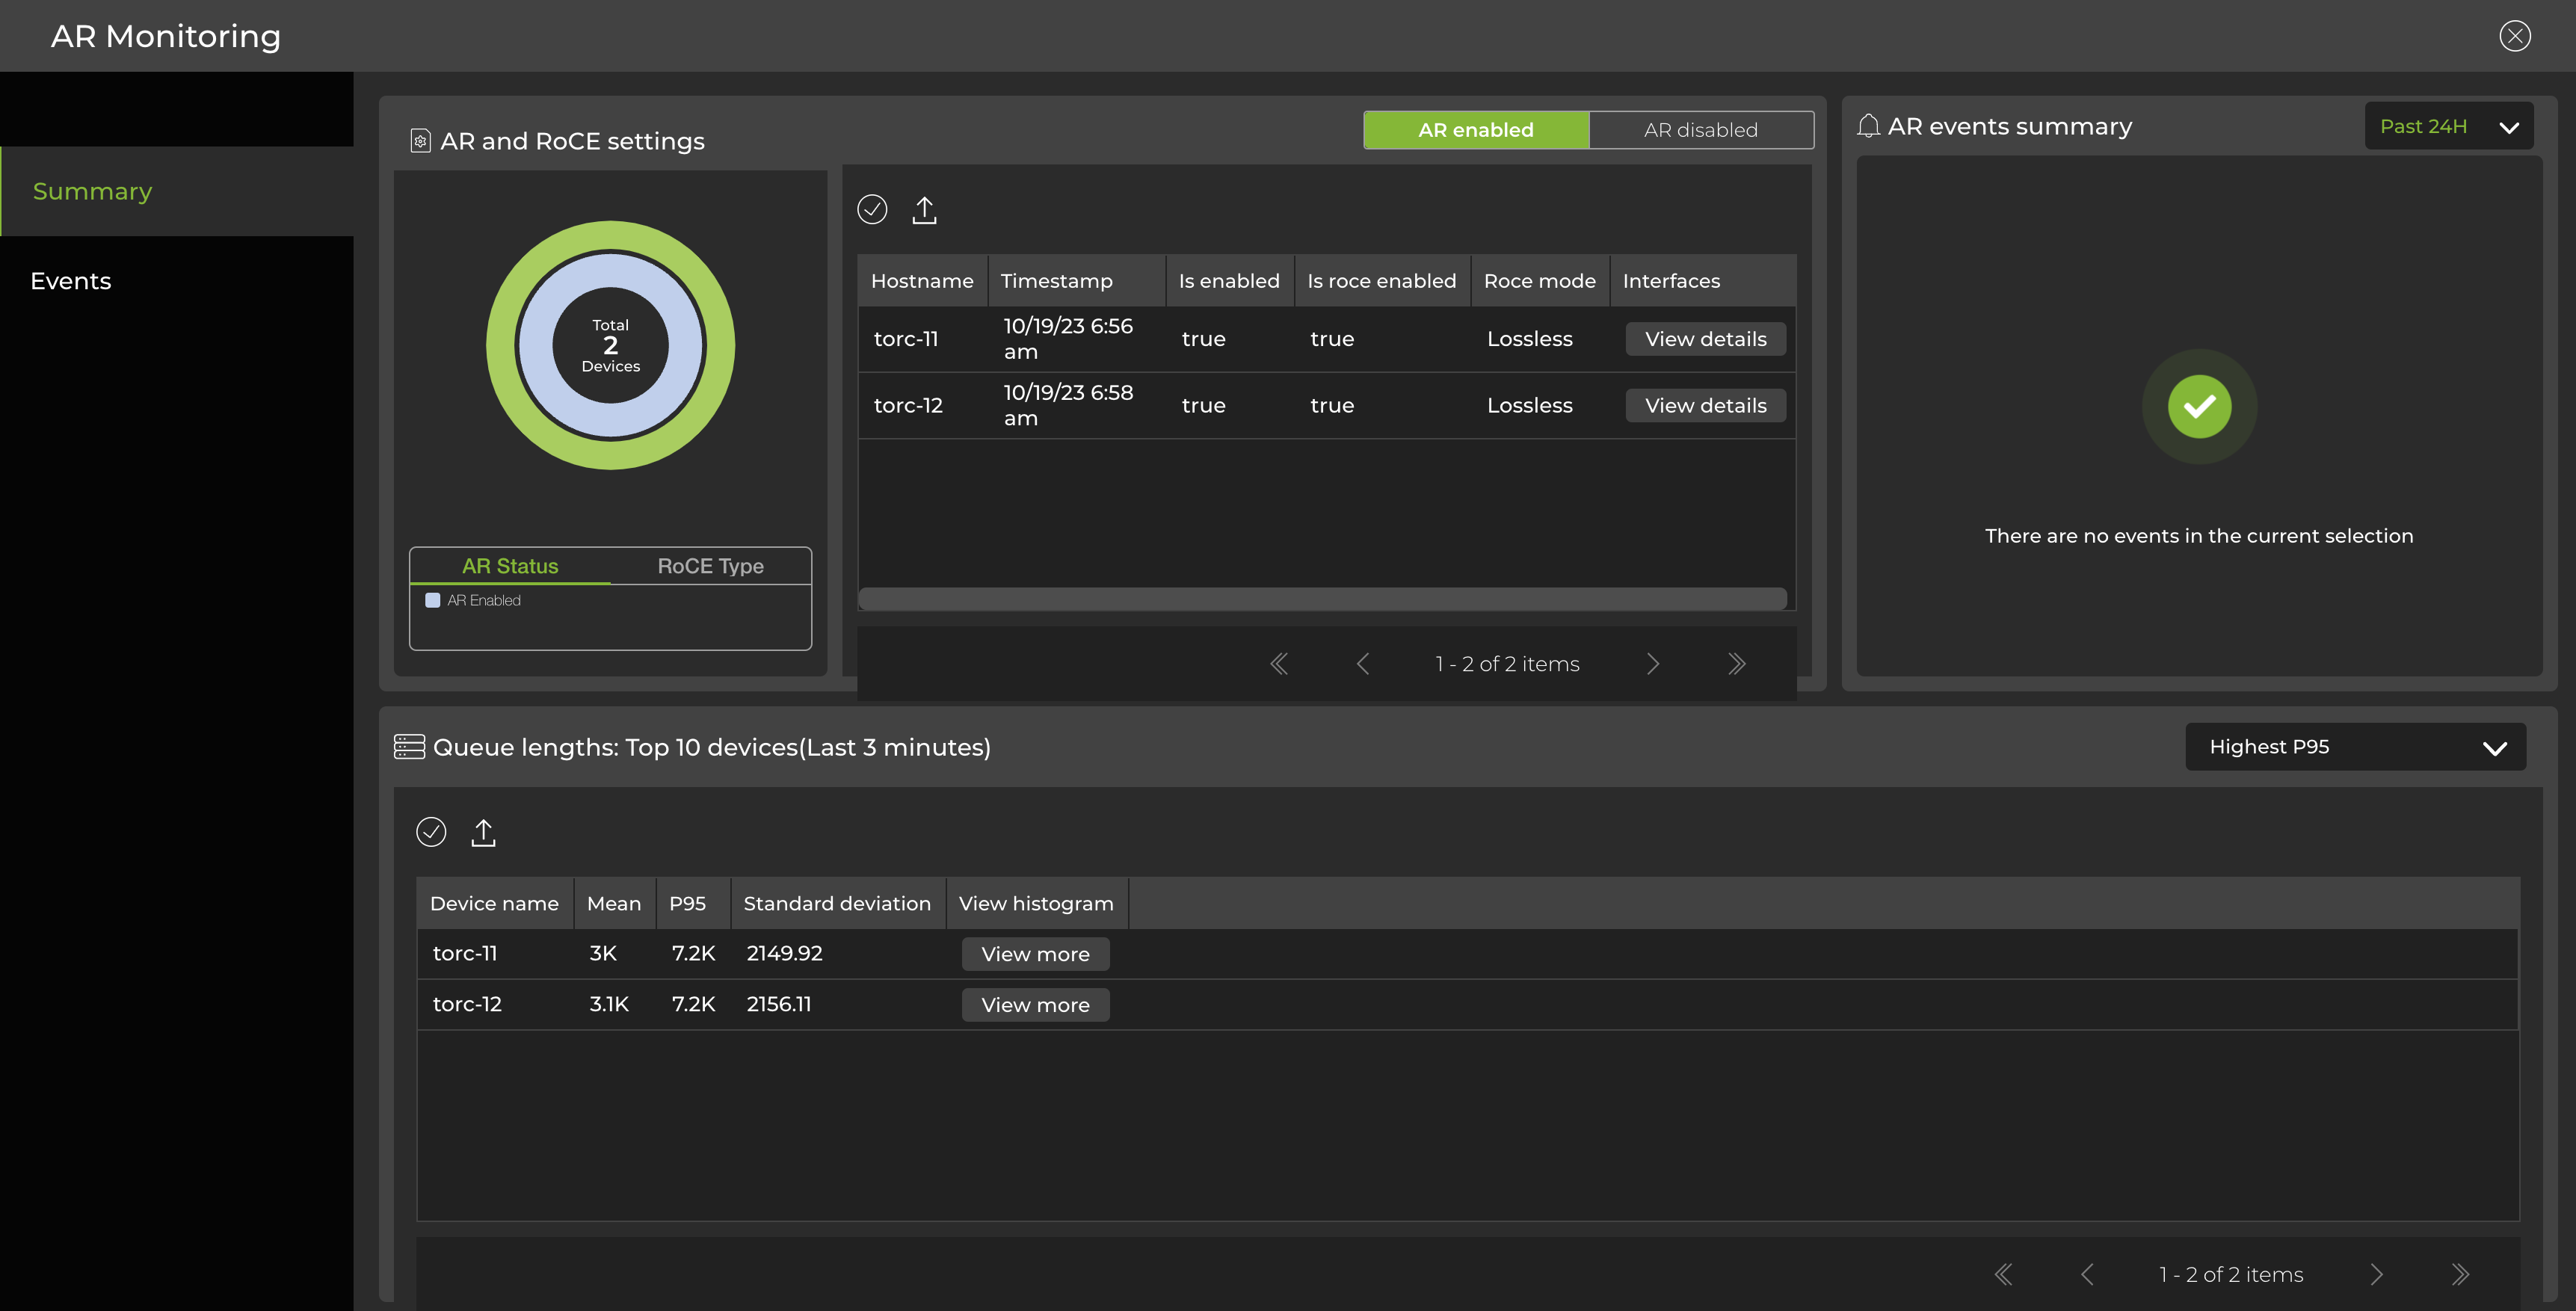
The adaptive routing dashboard displays:
- devices with adaptive routing (enabled or disabled) and their RoCE modes (lossy or lossless).
- a list of interfaces on the switch and their configurations, including link utilization status (visible by selecting View details in the ‘interfaces’ column).
- a summary of adaptive routing events, including ECMP traffic imbalances.
- a list of up to 10 switches, which can be sorted by highest P95 value, highest standard deviation, or ports with the widest deviation from the P95 value (aggregated over the past 3 minutes). From this panel, you can select View more in the ‘view histogram’ column to display queue lengths in the form of histograms for any listed switch.
