Network Topology
The network topology dashboard displays a visual representation of your network, showing connections and device information for all monitored nodes. The view allows you to understand your network’s architecture at a high-level, but also lets you isolate individual devices or sections.
The topology view has been redesigned to better accommodate larger networks with over 50 devices. This feature is in beta and feedback is welcome. You can still access the legacy topology view by following the instructions in the NetQ 4.7 documentation.
Access the Topology View
To open the topology view, click ![]() Topology in the workbench header. Select Topology Beta to open a full-screen view of your network topology. The UI displays the highest-level view of your network’s topology, showing devices as part of tiers corresponding to your network’s architecture.
Topology in the workbench header. Select Topology Beta to open a full-screen view of your network topology. The UI displays the highest-level view of your network’s topology, showing devices as part of tiers corresponding to your network’s architecture.
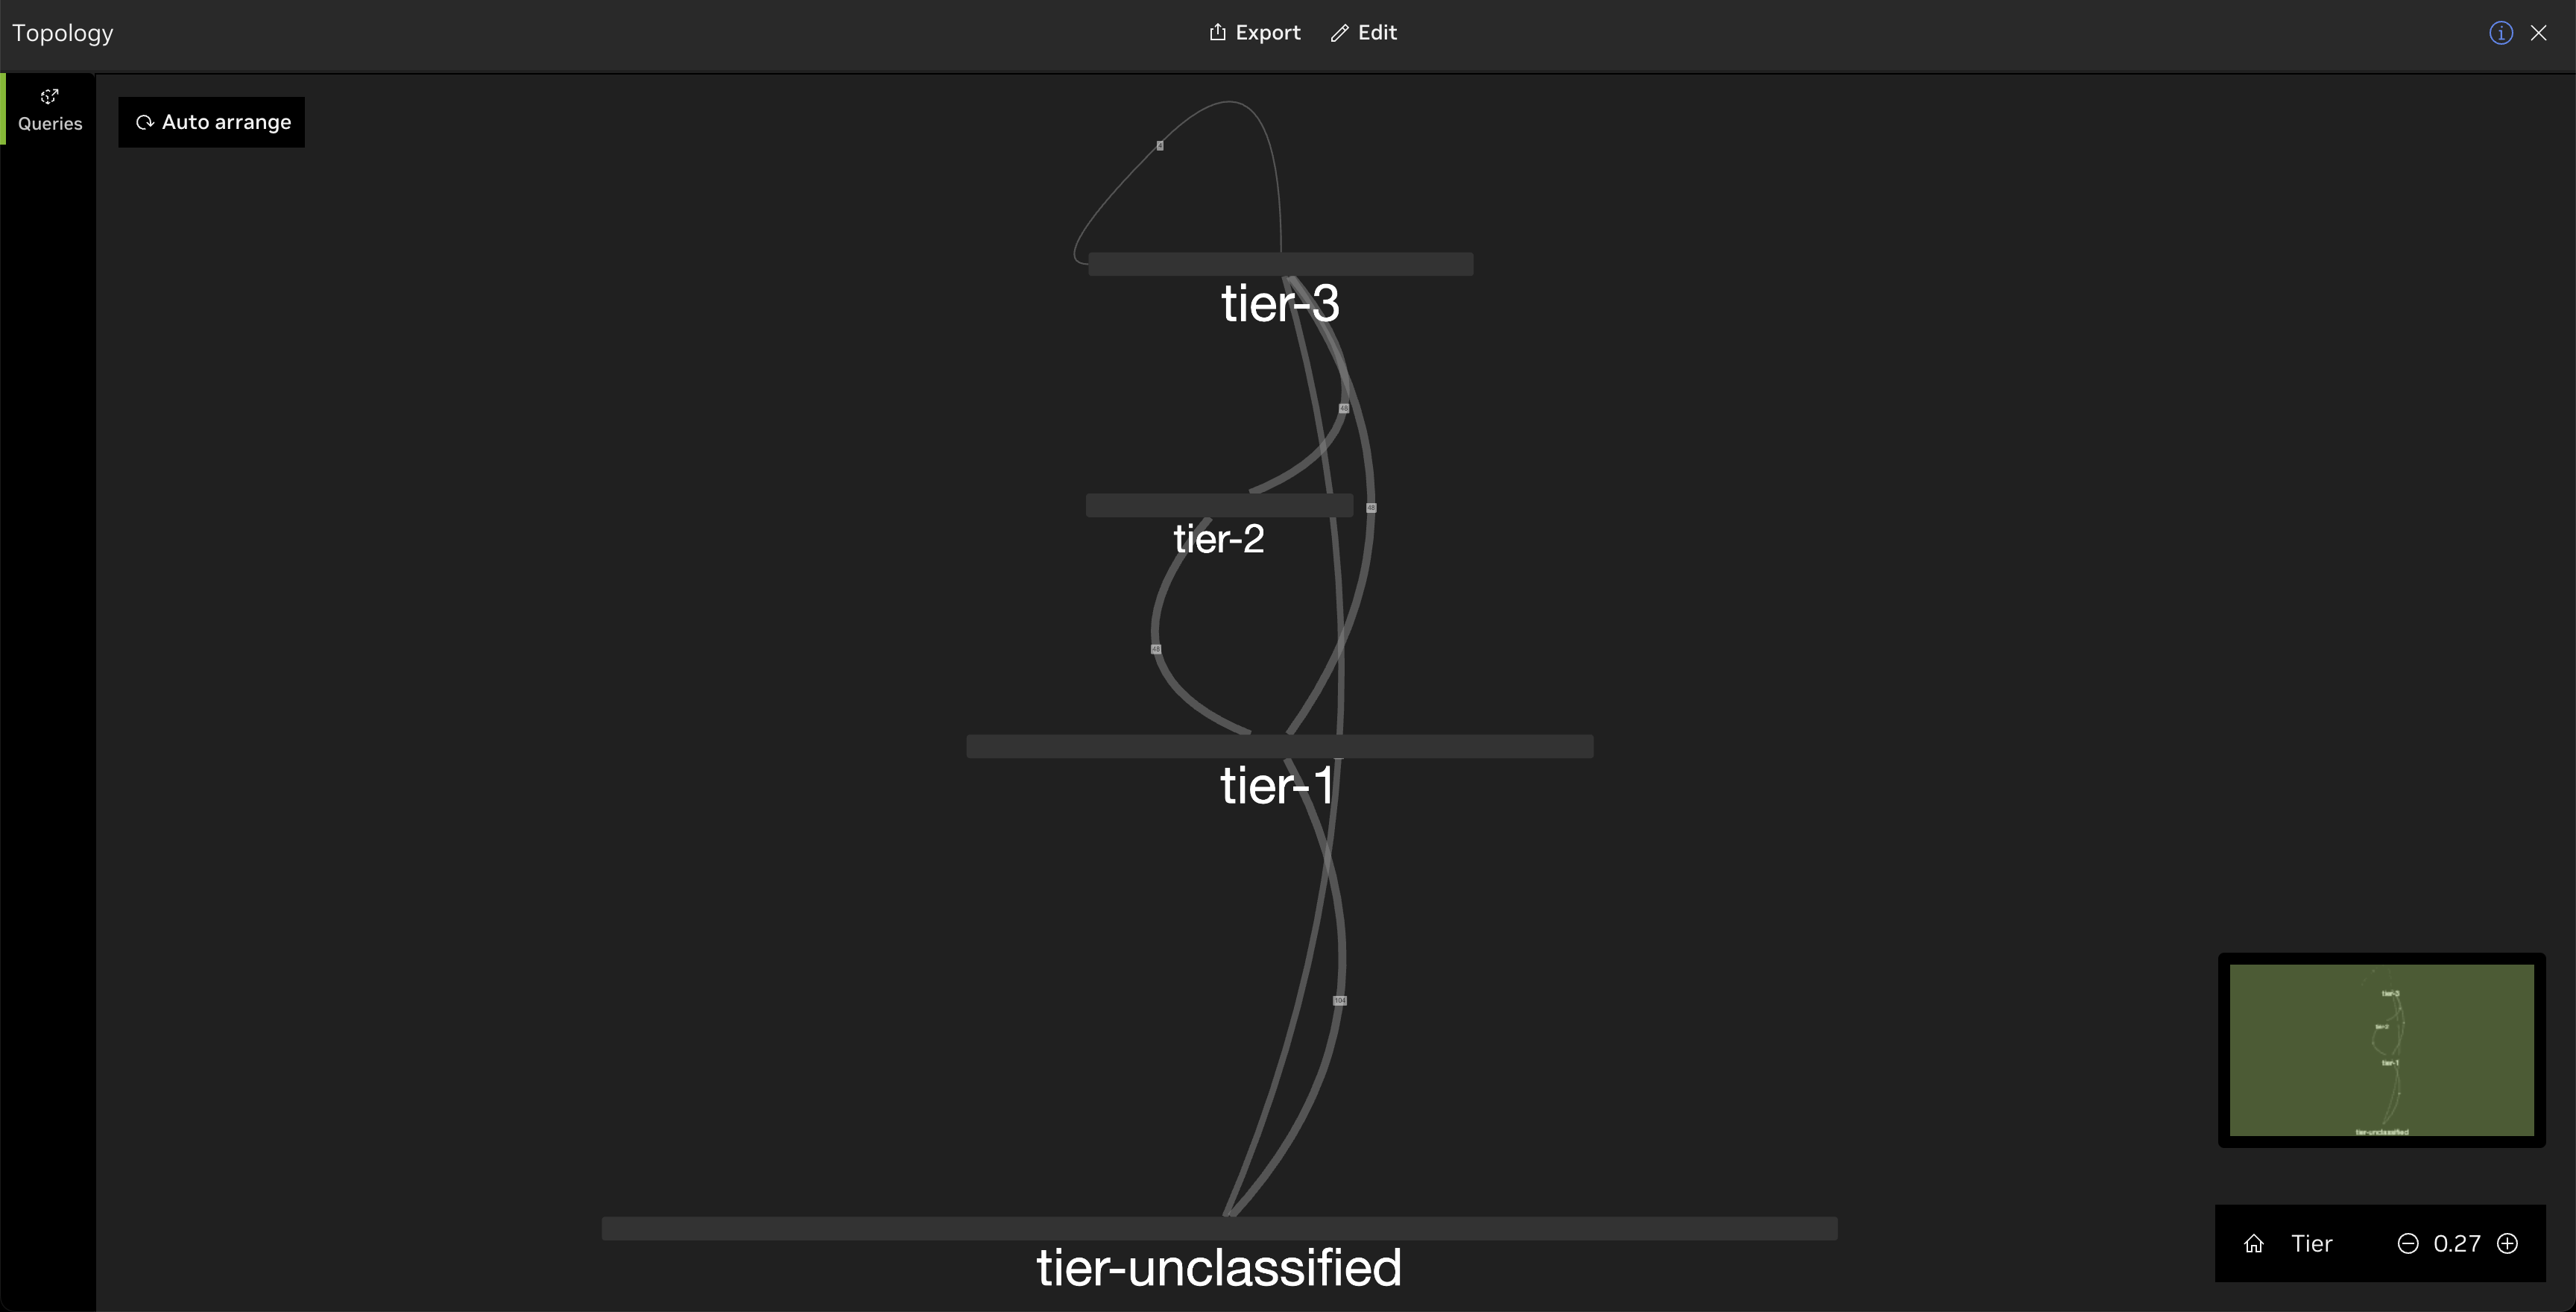
The default view reflects the devices comprising the network. A two-tier architecture is made up of leaf and spine devices; a three-tier architecture is made up of leaf, spine, and super-spine devices. There is an additional ‘unclassified’ tier for devices that do not have a role assigned to them. If your devices appear in this tier, assign roles to them. Then return to the topology view and select Auto arrange.
Interact with the Topology
The topology screen features a main panel displaying tiers or, when zoomed in, the individual devices that comprise the tiers. You can zoom in or out of the topology via the zoom controls at the bottom-right corner of the screen, a mouse with a scroll wheel, or with a trackpad on your computer. You can also adjust the focus by clicking anywhere on the topology and dragging it with your mouse to view a different portion of the network diagram. Above the zoom controls, a smaller screen reflects a macro view of your network and helps with orienting, similar to mapping applications.
View Device and Link Data
Zoom in and select a device to open a side panel with additional statistics, including interfaces statistics, resource utilization, and events occurring on that device.
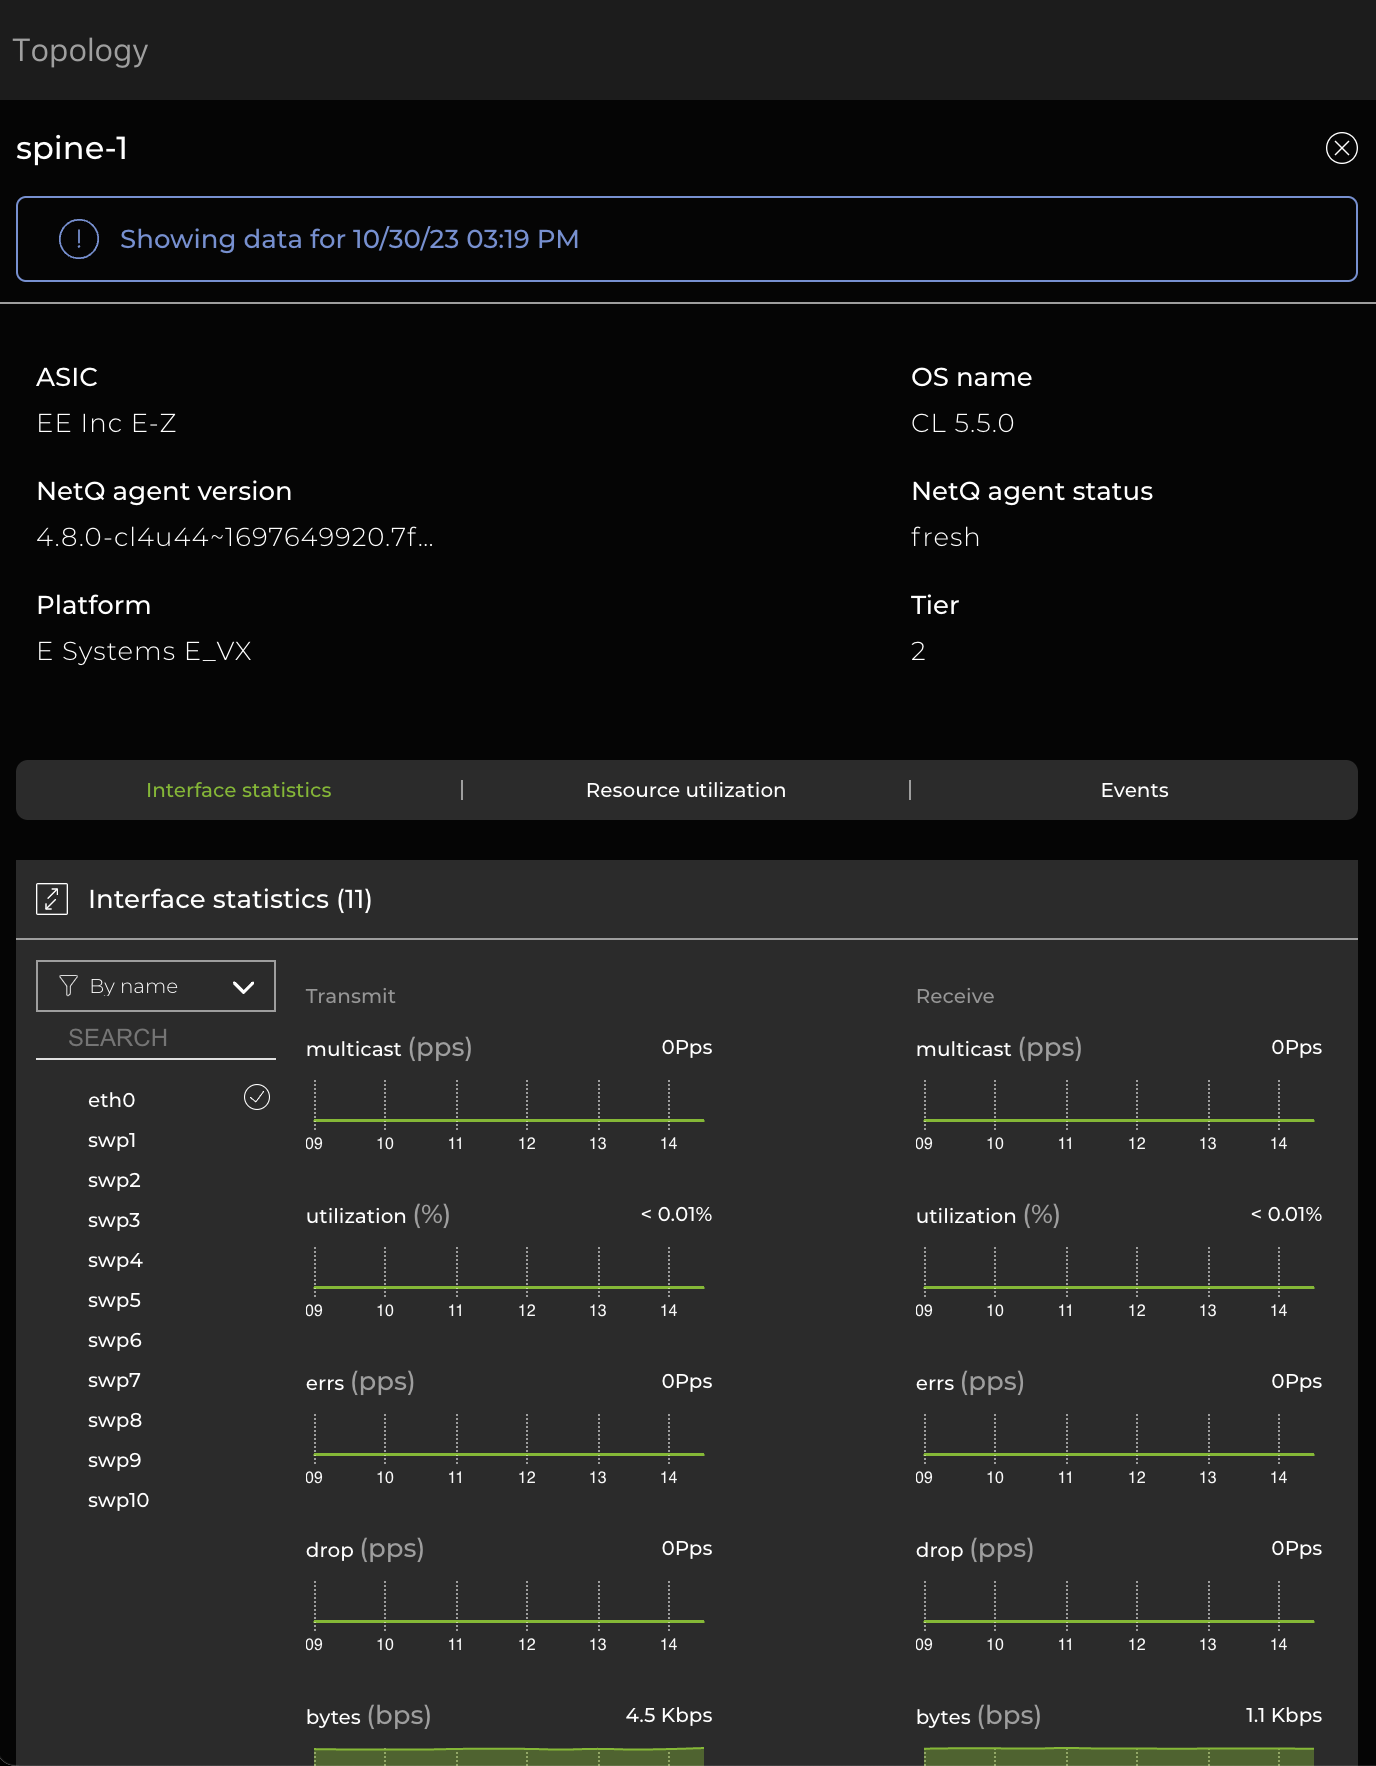
The following data is presented in the side panel for each selected device:
| Node Data | Description |
|---|---|
| ASIC | Name of the ASIC used in the switch. A value of Cumulus Networks VX indicates a virtual machine. |
| NetQ Agent status | Operational status of the NetQ Agent on the switch (fresh or rotten). |
| NetQ Agent version | Version ID of the NetQ Agent on the switch. |
| OS Name | Operating system running on the switch. |
| Platform | Vendor and name of the switch hardware. |
| Interface statistics | Transmit and receive data. |
| Resource utilization | CPU, memory, and disk utilization. |
| Events | Warning and info events. |
Hovering over a line highlights each end of the connection; the number embedded in the line displays the total number of links. Select the line to open a side panel with additional configuration data, which can be sorted by link pairs.
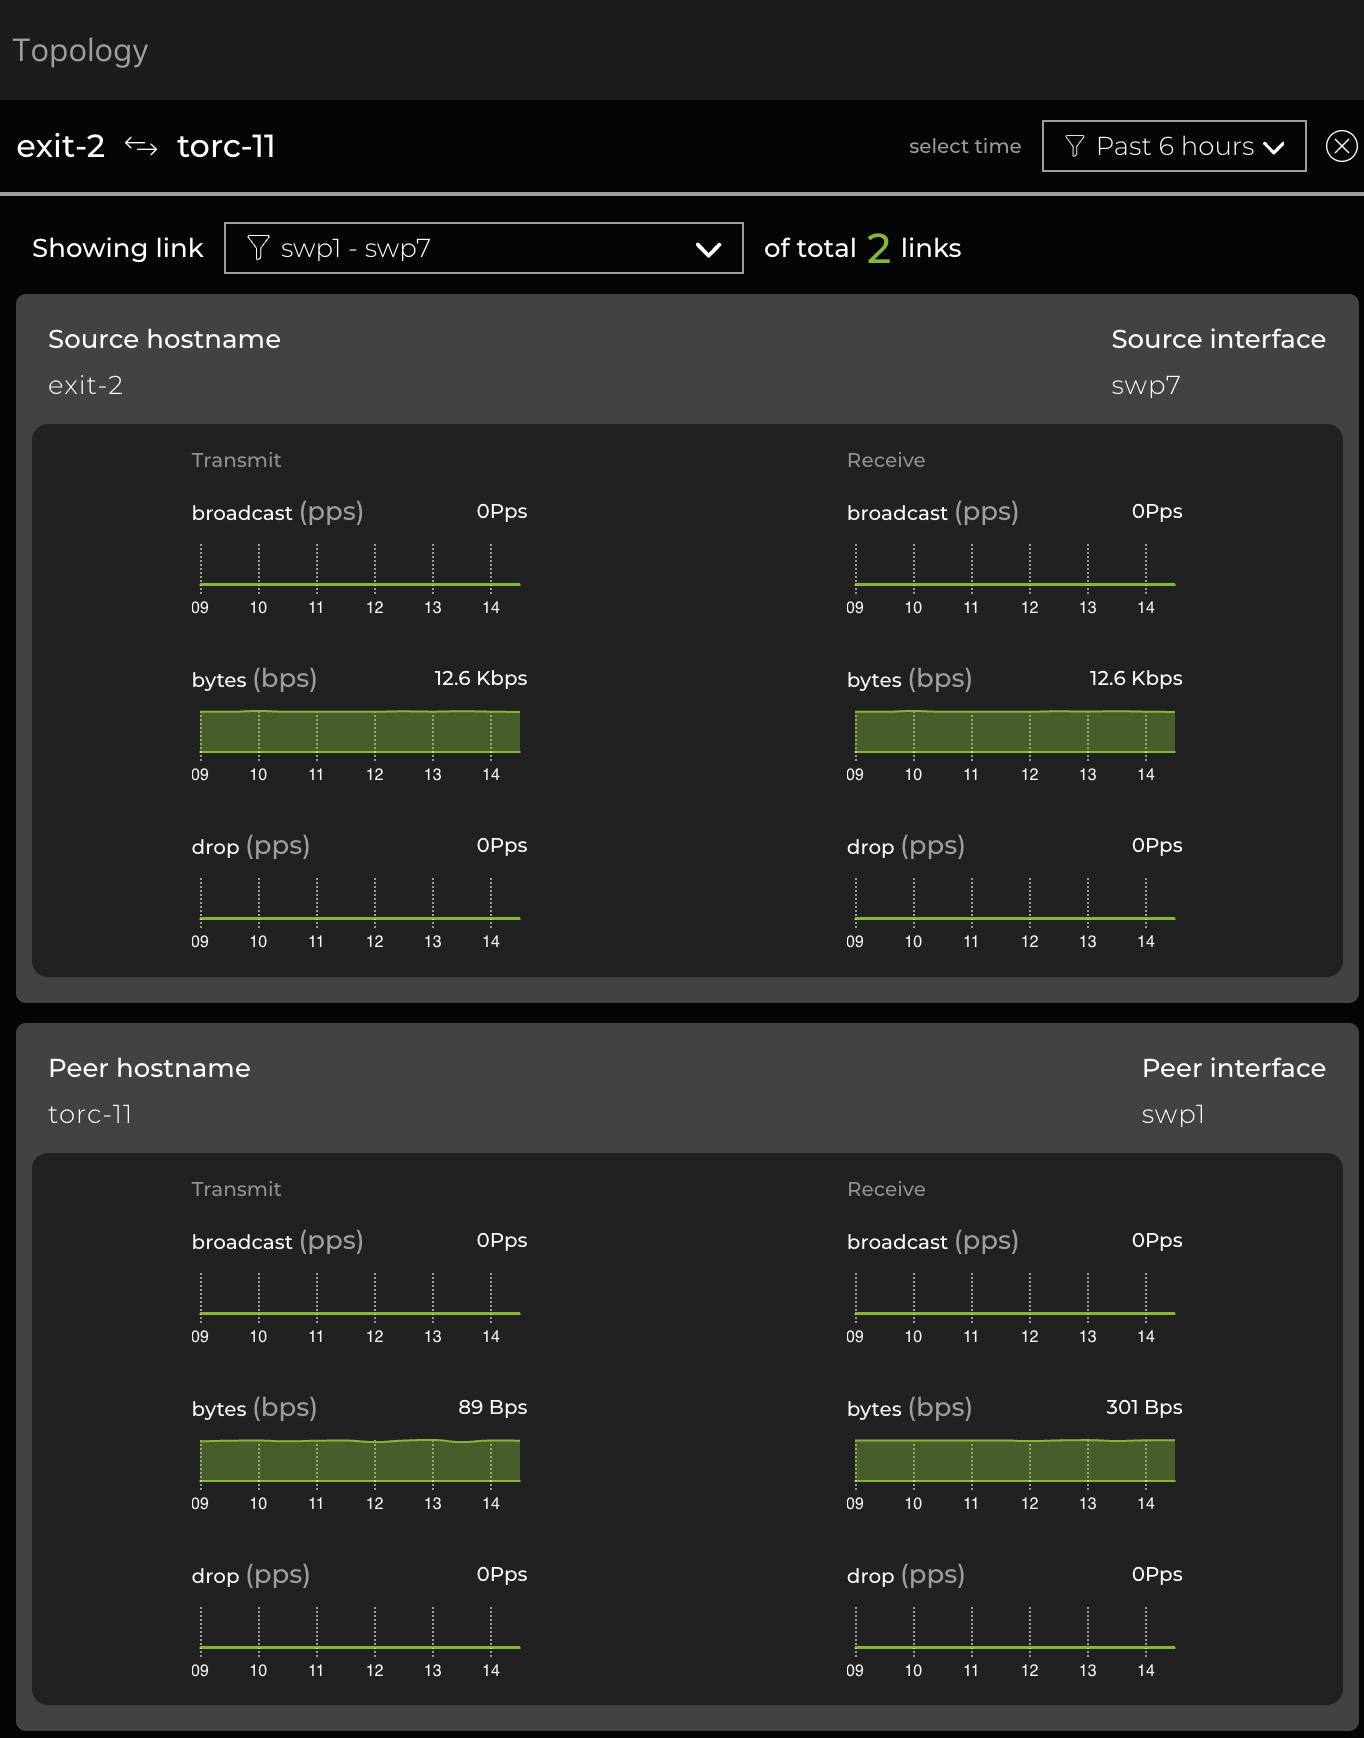
From the side panel, you can view the following data about links:
| Link Data | Description |
|---|---|
| Source hostname | Switch where the connection originates |
| Source Interface | Port on the source switch used by the connection |
| Peer hostname | Switch where the connection ends |
| Peer interface | Port on the destination switch used by the connection |
Rearrange and Edit the Topology
You can rearrange the topology’s tiers by selecting Edit at the top of the screen and dragging the tiers into different positions. Click Save to preserve the view or Reset to undo the changes. You can also move devices to other tiers or create new tiers by right-clicking on a device. Through this menu, you can move the device to a different tier or enforce the role's assignment and tier associated with that assignment.
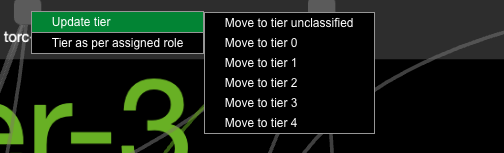
This menu also displays options to move the device to the unclassified tier or to a new tier. In the example above, the topology consists of three tiers and an unclassified tier. By selecting Move to tier 4, NetQ creates a new tier and places the selected device within it.
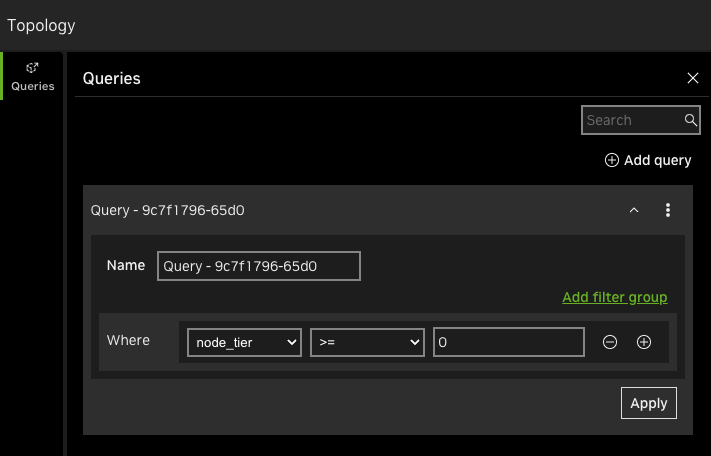
Create Queries to View a Subset of Devices
You can create queries to segment a topology into smaller, more manageable parts. This can be especially helpful when you need to view a particular section of a very large topology. To create a query, select Queries on the left side of the screen, then Add query. The name of the query is pre-populated with a unique identifier that you can edit by selecting the field.
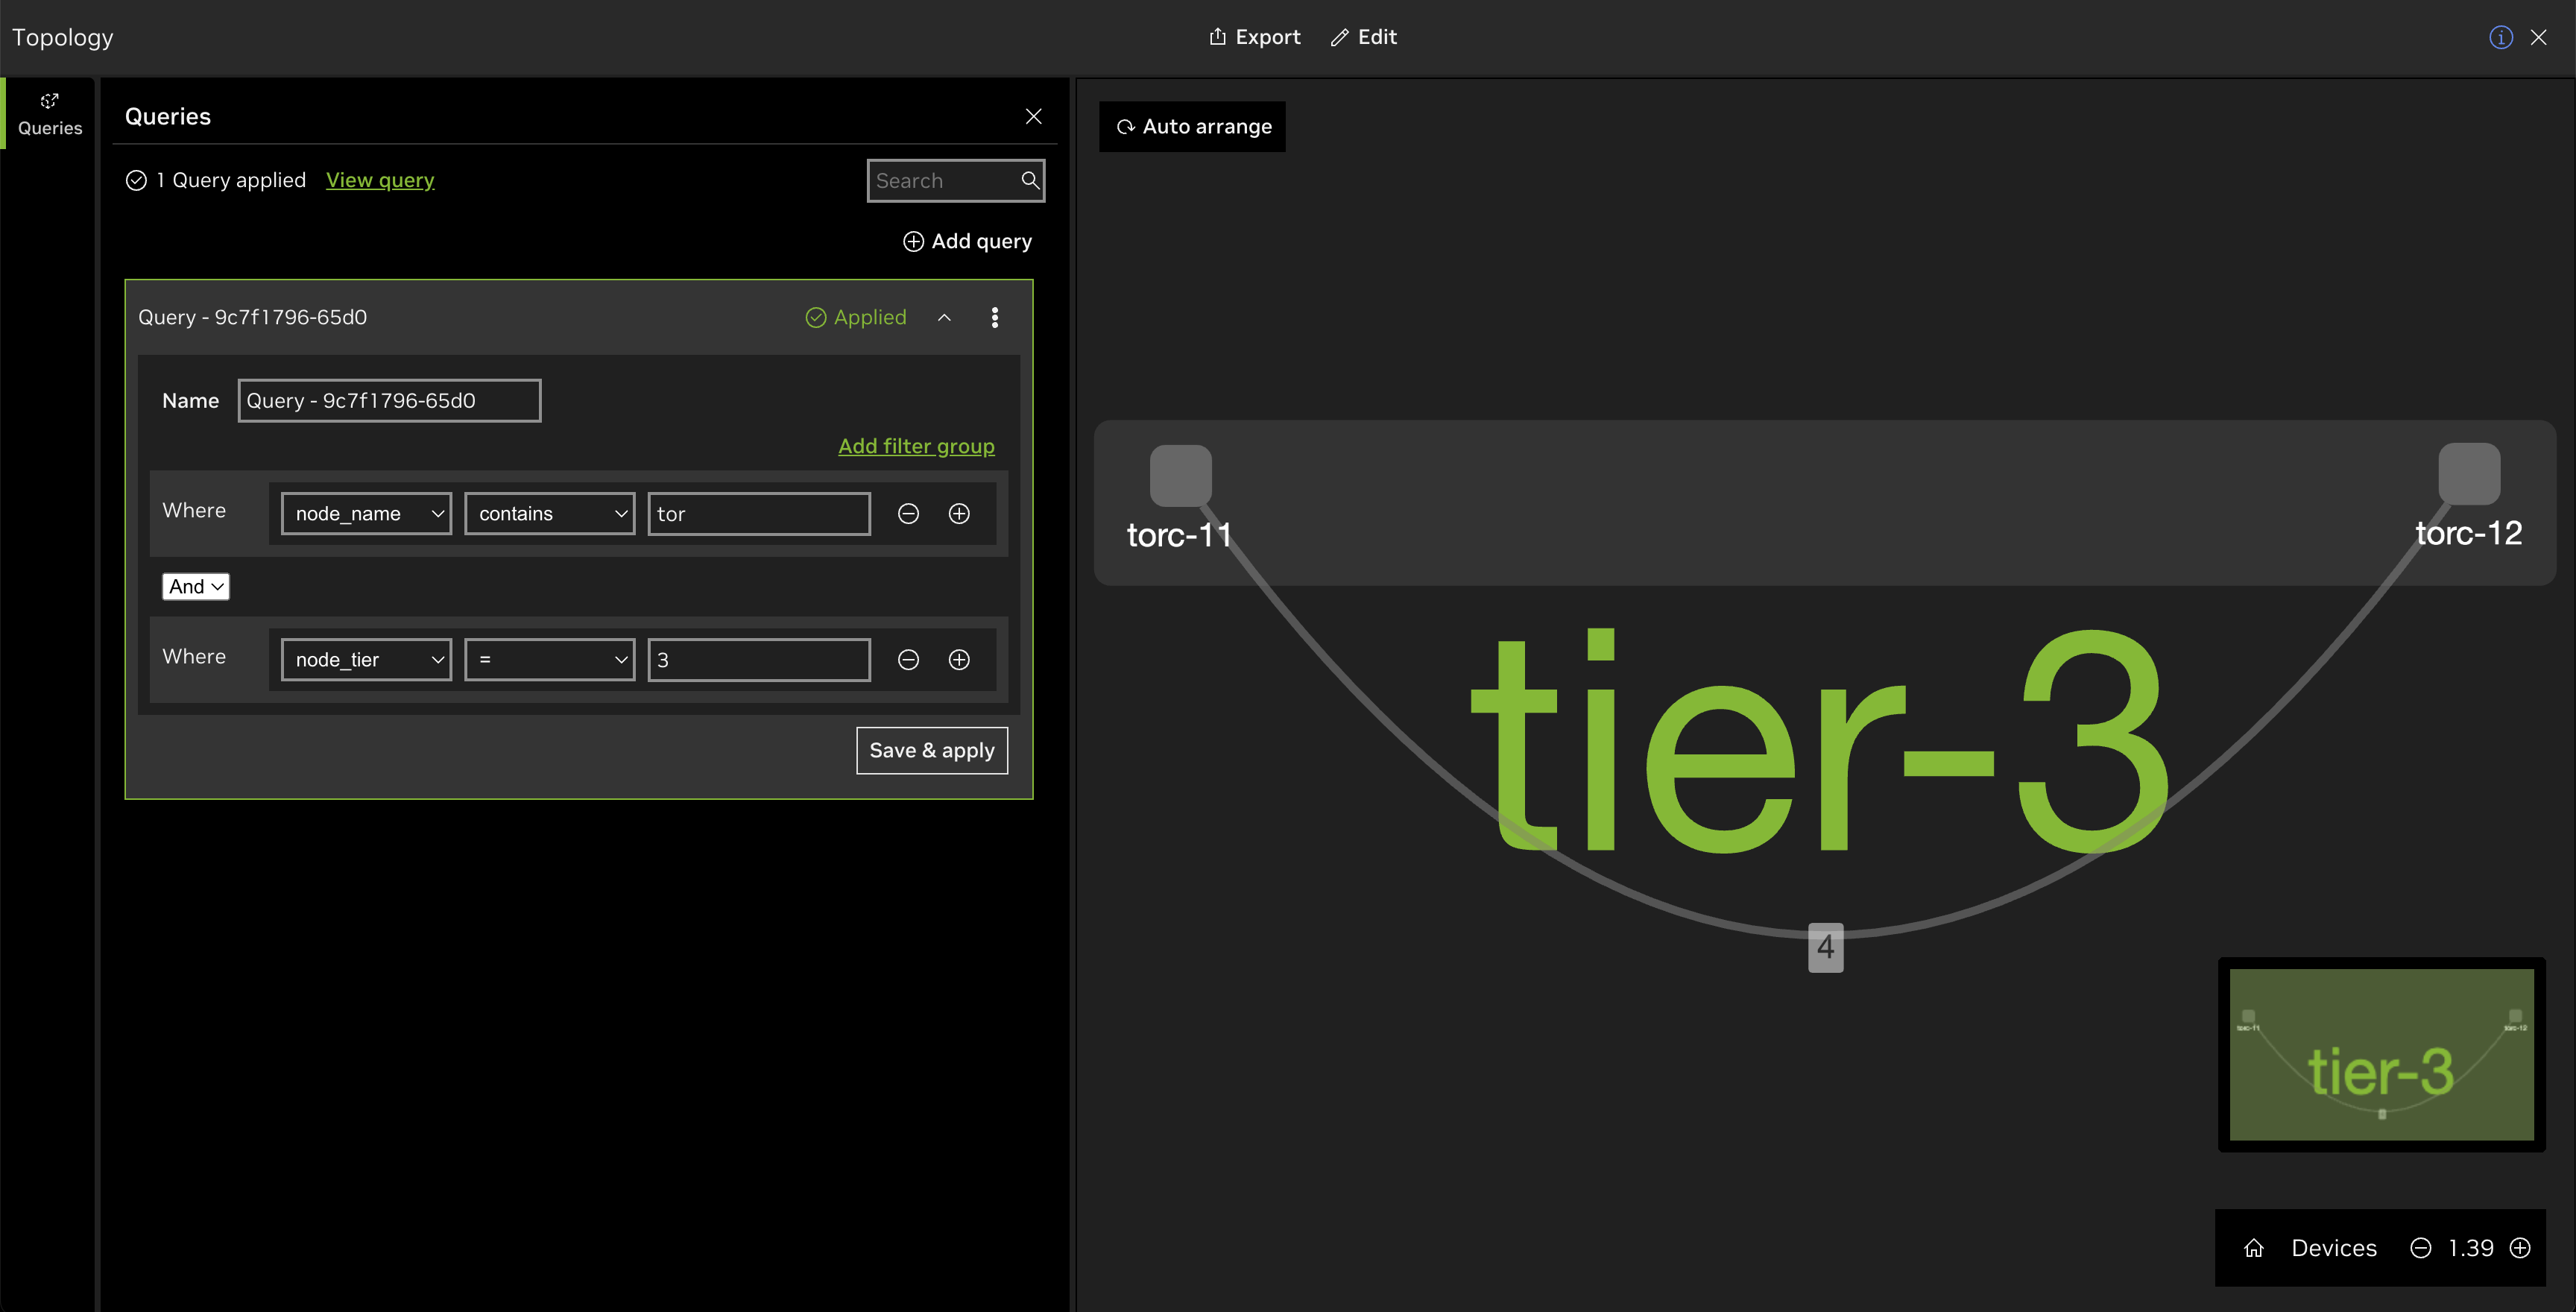
You can select between node_name and node_tier to display either a subsection of nodes based on their names or the tiers where they’re located, respectively. Select Add filter group to combine queries with logical operators. For example, the following filter group consists of two queries: one displaying any node containing the letters “tor” and of those nodes, those located in tier three:
Select the three-dot menu on a given query to either delete or remove the query.