Integrate NetQ with Grafana
The NetQ integration with Grafana allows you to create customized dashboards and to visualize metrics across your network devices. To view data in Grafana, first configure security between NetQ and OTel clients, configure OpenTelemetry (OTel) on the devices in your network, then configure the data sources in Grafana.
The Grafana integration is in beta and supported for on-premises deployments only.
Requirements and Support
- Switches must have a Spectrum-2 or later ASIC. The number of supported switches varies based on the deployment model and reflects an environment where each switch is configured with OpenTelemetry and running the NetQ agent.
- Standalone: 5 switches
- Cluster: 50 switches
- 3-node scale cluster: 500 switches
- 5-node scale cluster: 1,000 switches
- For switches, you must enable OpenTelemetry to collect and export each metric that you want to monitor, as described in the Cumulus Linux documentation.
- NetQ does not support OpenTelemetry collection from switches with buffer statistics enabled.
- DPUs and ConnectX hosts must be running DOCA Telemetry Service (DTS) version 1.18 or later.
- Before you get started with the steps below, install Grafana and start the Grafana server.
- NetQ allows you to retrieve data from up to three days in the past.
Secure OpenTelemetry Export
NetQ is configured with OTLP secure mode with TLS by default and expects clients to secure data with a certificate. You can configure NetQ and your client devices to use your own generated CA certificate, NetQ’s self-signed certificate, or set the connections to insecure mode.
TLS with a CA Certificate
NVIDIA recommends using your own generated CA certificate. To configure a CA certificate:
Copy your certificate files to the NetQ server in the
/mnt/admindirectory. For example, copy the certificate and key to/mnt/admin/certs/server.crtand/mnt/admin/certs/server.keyImport your certificate on your switches using the
nv action import system security ca-certificate <cert-id> [data <data> | uri <path>]command. Define the name of the certificate in<cert-id>and either provide the raw PEM string of the certificate as<data>or provide a path to the certificate file containing the public key as<path>.After importing your certificate, set OTLP insecure mode to
disabledon your switches:nvidia@switch:~$ nv set system telemetry export otlp grpc insecure disabled nvidia@switch:~$ nv config apply
TLS with a CA Certificate
NVIDIA recommends using your own generated CA certificate. To configure a CA certificate:
Copy your certificate files to the NetQ server in the
/mnt/admindirectory. For example, copy the certificate and key to/mnt/admin/certs/server.crtand/mnt/admin/certs/server.keyCopy your certificate to your DPU or NIC in the
/opt/mellanox/doca/services/telemetry/config/certs/directory.Change permissions on the certificate with the
chmod 644 /opt/mellanox/doca/services/telemetry/config/certs/ca.pemcommand to make the certificate readable to all users.Configure OpenTelemetry on your DPU or NIC and include an additional line referencing the certificate in
/opt/mellanox/doca/services/telemetry/config/dts_config.ini:
open-telemetry-ca-file=/config/certs/ca.pem
TLS with NetQ’s Self-signed Certificate
To run on the switch in secure mode with NetQ’s self-signed certificate:
From the NetQ server, display the certificate using
netq show otlp tls-ca-cert dumpcommand. Copy the certificate from the output.On the switch, import the certificate with the
nv action import system security ca-certificate <cert-id> data <data>command. Define the name of the certificate in<cert-id>and replace<data>with the certificate data you generated in the preceding step.Configure the certificate to secure the OTel connection. Replace
ca-certificatewith the name of your certificate; this is the<cert-id>from the previous step.nvidia@switch:~$ nv set system telemetry export otlp grpc cert-id <ca-certificate> nvidia@switch:~$ nv config applyNext, disable
insecuremode and apply the change:nvidia@switch:~$ nv set system telemetry export otlp grpc insecure disabled nvidia@switch:~$ nv config applyRun
nv show system telemetry healthto display the destination port and IP address, along with connectivity status.
TLS with NetQ’s Self-signed Certificate
To run on a DPU or NIC in secure mode with NetQ’s self-signed certificate:
From the NetQ server, display the certificate using
netq show otlp tls-ca-cert dumpcommand. Copy the certificate from the output.Copy the certificate content from step 1 to a file on your DPU or NIC in the
/opt/mellanox/doca/services/telemetry/config/certs/directory. For example, copy the output content into/opt/mellanox/doca/services/telemetry/config/certs/ca.pemChange permissions on the certificate with the
chmod 644 /opt/mellanox/doca/services/telemetry/config/certs/ca.pemcommand to make the certificate readable to all users.Configure OpenTelemetry on your DPU or NIC and include an additional line referencing the certificate in
/opt/mellanox/doca/services/telemetry/config/dts_config.ini:
open-telemetry-ca-file=/config/certs/ca.pem
Insecure Mode
To use insecure mode and disable TLS:
On your NetQ server, run the
netq set otlp security-mode insecurecommand.On your switches, configure insecure mode:
nvidia@switch:~$ nv set system telemetry export otlp grpc insecure disabled
nvidia@switch:~$ nv config apply
Insecure Mode
To use insecure mode and disable TLS:
On your NetQ server, run the
netq set otlp security-mode insecurecommand.On your DPU or NIC, Configure OpenTelemetry but do not include a
open-telemetry-ca-file=line in the/opt/mellanox/doca/services/telemetry/config/dts_config.iniconfiguration file.
Configure and Enable OpenTelemetry on Devices
Configure your client devices to send OpenTelemetry data to NetQ.
Enable OpenTelemetry for each metric that you want to monitor, as described in the Cumulus Linux documentation. Use your NetQ server or cluster’s IP address and port 30008 when configuring the OTLP export destination.
NVIDIA recommends setting the sample-interval option to 10 seconds for each metric that allows you to set a sample interval.
Install DOCA Telemetry Service (DTS) on your ConnectX hosts or DPUs.
Configure OpenTelemetry data export by editing the
/opt/mellanox/doca/services/telemetry/config/dts_config.inifile. Add the following lines under theIPC transportsection. ReplaceTS-IPwith the IP address of your telemetry receiver.
For HTTPS transport:
open-telemetry-transport=http
open-telemetry-receiver=http://<TS-IP>:30009/v1/metrics
For gRPC transport:
open-telemetry-transport=grpc
open-telemetry-receiver=<TS-IP>:30008/v1/metrics
- To support telemetry at a scale of up to 4K devices on hosts with ConnectX NICs or DPUs in NIC mode, configure counterset and fieldset files to control the telemetry data exported from DTS.
Download gb200.cset and gb200.fset, then copy the files to /opt/mellanox/doca/services/telemetry/config/prometheus_configs/cset/ on your host.
Add the following lines to the /opt/mellanox/doca/services/telemetry/config/dts_config.ini configuration file:
prometheus-fset-indexes=device_name,device_id,pod_name,^id$,@id
prometheus-cset-dir=/config/prometheus_configs/cset
prometheus-fset-dir=/config/prometheus_configs/cset
open-telemetry-field-set=gb200
open-telemetry-counter-set=gb200
It can take up to a minute for the device to restart and apply the changes. If you manually edit the fieldset file, you must restart DTS for the changes to be reflected.
Read more about OpenTelemetry and DTS configurations in the DOCA Telemetry Service guide.
Configure an External TSDB
OpenTelemetry data is stored in the NetQ TSDB. In addition to NetQ’s local storage, you can configure NetQ to also send the collected data to your own external TSDB:
If the connection to your external TSDB is secured with TLS, copy the certificate to the NetQ server in the
/mnt/admin/directory, and reference the full path to the file with thenetq set otlp endpoint-ca-cert tsdb-name <text-tsdb-endpoint> ca-cert <text-path-to-ca-crt>command.From the NetQ server, add the OTel endpoint of your time-series database (TSDB). Replace
text-tsdb-endpointandtext-tsdb-endpoint-urlwith the name and IP address of your TSDB, respectively. Include theexport trueoption to begin exporting data immediately. Setsecurity-modetotlsif you configured a certificate to secure the connection, otherwise usesecurity-mode insecure.
nvidia@netq-server:~$ netq add otlp endpoint tsdb-name <text-tsdb-endpoint> tsdb-url <text-tsdb-endpoint-url> [export true | export false] [security-mode <text-mode>]
- If you set the
exportoption totruein the previous step, the TSDB will begin receiving the time-series data for the metrics that you configured on the switch. Use thenetq show otlp endpointcommand to view the TSDB endpoint configuration.
Collect Slurm Telemetry
Slurm (Simple Linux Utility for Resource Management) is an open-source job scheduler used in high-performance computing (HPC) environments. It manages and allocates compute resources, schedules jobs, and distributes workloads across a cluster.
To view and filter Slurm jobs in Grafana, you must have an NVIDIA Base Command Manager deployment running BCM v11 or later.
- Authenticate into BCM using either basic authentication (username and password) or certificate-based authentication.
Two versions of this command exist. Specify either the Base Command Manager IP address in ip-address or the domain name in hostname. Replace port-text with the port that BCM uses. You can run this command from any node in your cluster.
nvidia@netq-server:~$ netq add bcm auth-type basic user <username> pass <password> ip <ip-address> port <port-text>
nvidia@netq-server:~$ netq add bcm auth-type basic user <username> pass <password> hostname <hostname> port <port-text>
For example:
nvidia@netq-server:~$ netq add bcm auth-type basic user admin pass secretpass123 ip 192.168.1.100 port 8082
You must run this command from the node that hosts the netq-bcm-gateway pod. To identify this node, run the kubectl get pods -o wide | grep netq-bcm-gateway command. The output of this command displays the correct node.
Two versions of this command exist. Specify either the Base Command Manager IP address in ip-address or the domain name in hostname. Replace port-text with the port that BCM uses. Specify the full path to both the certificate and key files. These are typically located in the /mnt/bcm/ directory.
nvidia@netq-server:~$ netq add bcm auth-type cert cert-file <certificate-path> key-file <key-path> ip <ip-address> port <port-text>
nvidia@netq-server:~$ netq add bcm auth-type cert cert-file <certificate-path> key-file <key-path> hostname <hostname> port <port-text>
For example:
nvidia@netq-server:~$ netq add bcm auth-type cert cert-file /mnt/bcm/bcm.crt key-file /mnt/bcm/bcm.key ip 192.168.1.100 port 8082
- Verify that your credentials are correct and check for BCM version compatibility:
nvidia@netq-server:~$ netq show bcm auth-status
You will configure the Slurm data source in the next section using the slurm-nodes-and-jobs-dashboard JSON file.
Configure Data Sources in Grafana
- Generate and copy an authentication token using the NetQ CLI. You can adjust time at which the token will expire with the
expiryoption. For example, the following command generates a token that expires after 40 days. If you do not set anexpiryoption, the token expires after 5 days. The maximum number of days allowed is 180.
nvidia@netq-server:~$ netq show vm-token expiry 40
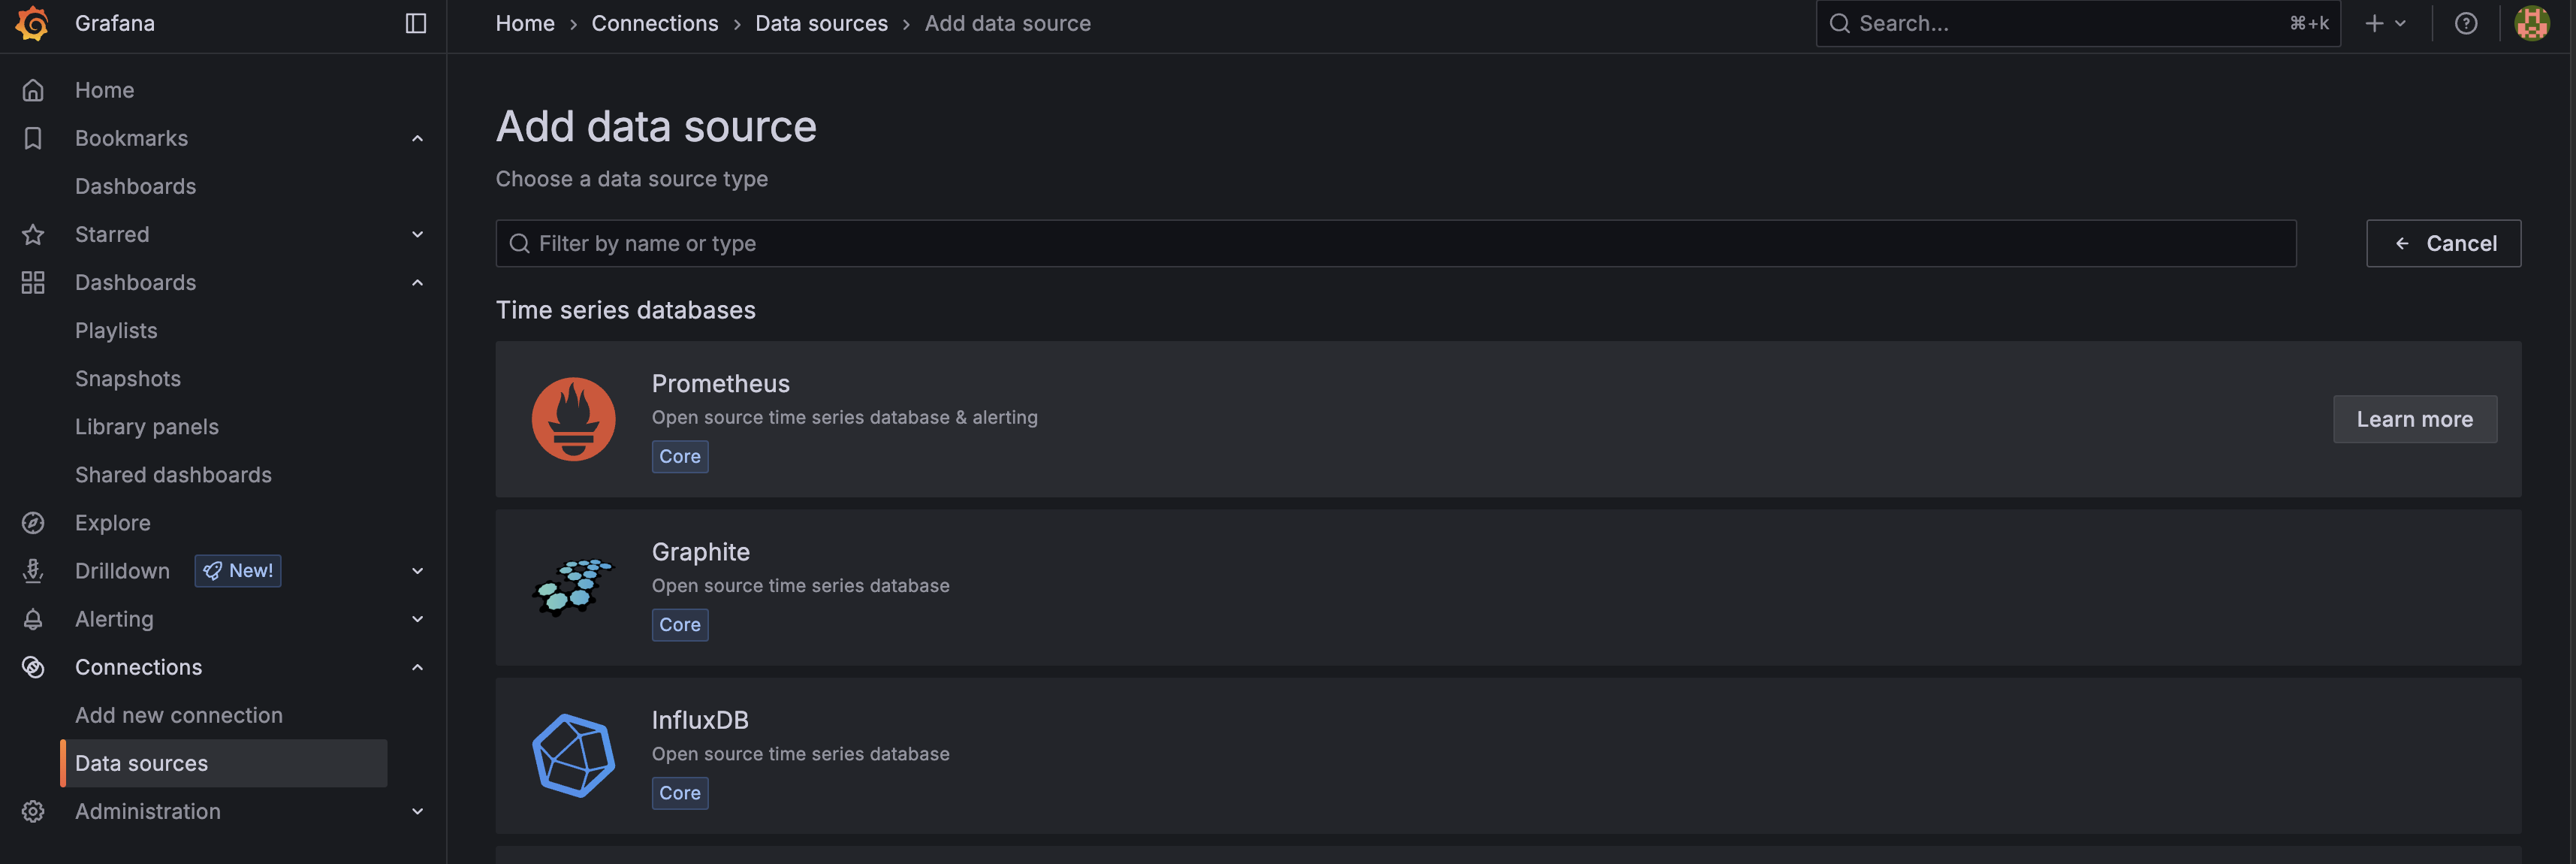
- Navigate to your Grafana dashboard. From the menu, select Connections and then Data sources. Select Add new data source and add the Prometheus TSDB:
- Continue through the steps to configure the data source:
- In the Name field, enter the name of the data source. The name must start with the data source name and be written in lowercase (for example,
slurm_dashboardorkpi-dashboard). - In the Connection field, enter the IP address of your NetQ server followed by
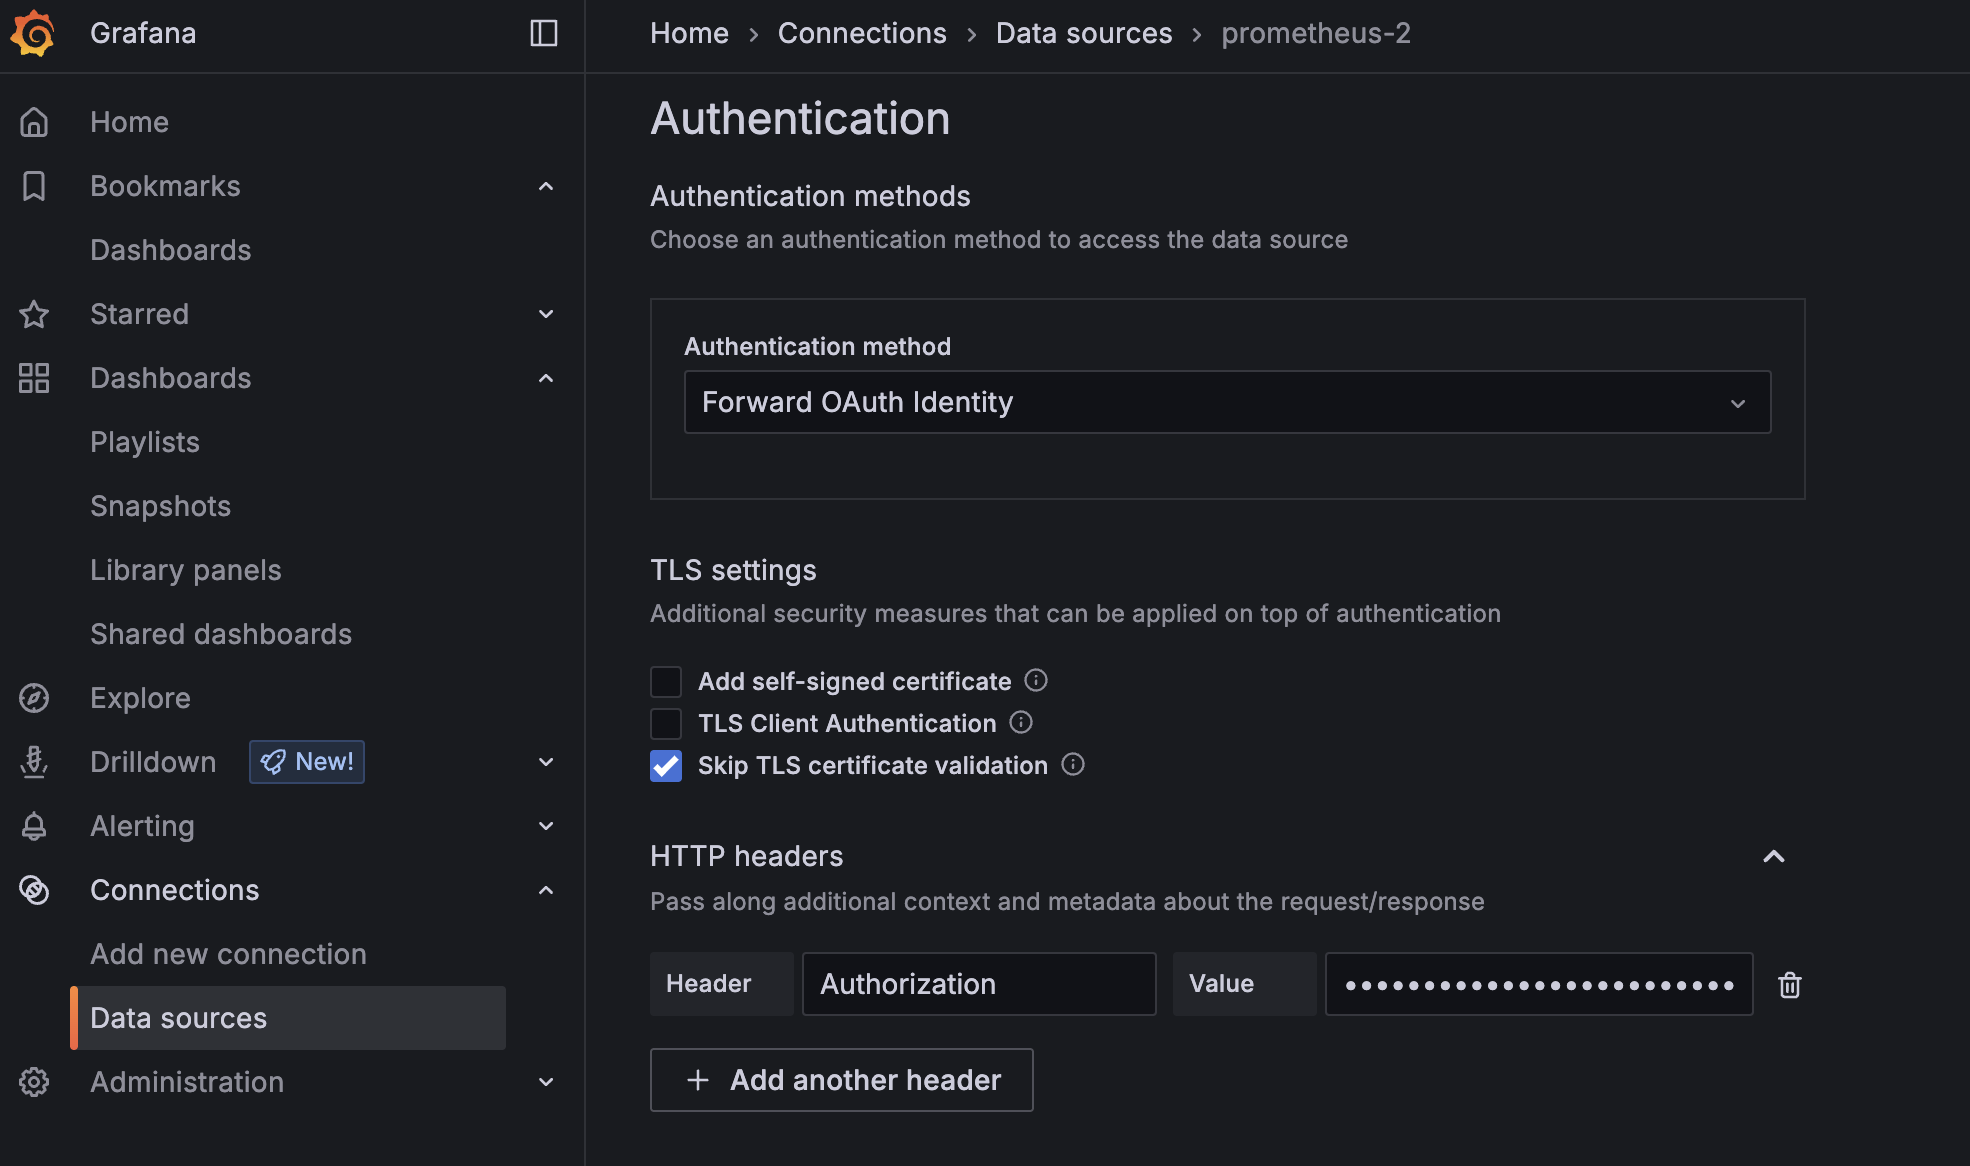
/api/netq/vm/, for examplehttps://10.255.255.255/api/netq/vm/. In a cluster deployment, enter the virtual IP address in this field (followed by/api/netq/vm/). - In the Authentication section, select Forward OAuth identity from the dropdown menu.
- In TLS settings, select Skip TLS certificate validation.
- In the HTTP headers section, select Add header. In the Header field, enter Authorization. In the Value field, enter the token that you generated in step one of this section.
- Select Save & test. If the operation was successful, you will begin to see metrics in your Grafana dashboard.
Import a Dashboard Template
To import a preconfigured dashboard into your Grafana instance:
From the side menu, select Dashboards.
Click New and select Import from the drop-down menu.
Paste the dashboard JSON text into the text area.
(Optional) Change the dashboard name, folder, or UID.
Click Import.
If the dashboard does not display data, refresh your browser.
Grafana Best Practices
If data retrieval with Grafana is slow, you might need to adjust your dashboard settings. Fabric-wide queries on large networks (over 1000 switches) can generate millions of data points, which can significantly degrade performance. You can improve performance by optimizing queries, reducing data volume, and simplifying panel rendering.
Avoid plotting all time-series data at once. To visualize the data in different ways:
- Aggregate time-series data
- Add labels to your time-series data
- Add interval variables
- Use aggregation operators such as
countandtopk
If Grafana displays "No Data", verify that all VMs in your cluster are operational. You can check the node status using the kubectl get nodes command. A node will show as NotReady if it is down. When the VM is restored, data collection will resume and will be displayed within 20 minutes of restoration.
Retrieve Metrics with the NetQ API
If you want to view or export the time-series database data without using Grafana, you can use curl commands to directly query the NetQ TSDB. These commands typically complete in fewer than 30 seconds, whereas Grafana can take longer to process and display data.
- Generate an access token. Replace
<username>and<password>with your NetQ username and password. Copy the access token generated by this command. You will use it in the next step.
curl 'https://10.237.212.61/api/netq/auth/v1/login' -H 'content-type: application/json' --data-raw '{"username":"<username>","password":"<password>"}' --insecure
- Generate a JSON Web Token (JWT). Replace
<access_token>with the token generated from the previous step. Copy the resulting token generated by this command. You will use it in the next step.
curl -k -X GET "https://10.237.212.61/api/netq/auth/v1/vm-access-token?expiryDays=10" -H "Authorization: Bearer <access_token>"
- Fetch a complete list of metrics. Replace
<vm-jwt>with the token generated from the previous step. You can use this list to create queries based on metrics you’re interested in.
export token=<vm-jwt>
curl -k "https://10.237.212.61/api/netq/vm/api/v1/label/__name__/values" -H "Authorization: Bearer $token"