Use Ganglia with Cumulus Linux
Ganglia, a BSD-licensed open-source project, is a scalable distributed monitoring system for high-performance computing systems such as clusters and grids. According to the official Ganglia website, the implementation is robust, is compatible with an extensive set of operating systems and processor architectures, and is currently in use on thousands of clusters around the world. You can use Ganglia to link clusters across university campuses and around the world and can scale to handle clusters with 2000 nodes.
Because Cumulus Linux is Linux, Ganglia also works great to monitor switches as well as servers. This article provides setup instructions for using Ganglia on Cumulus Linux.
Requirements
- A Cumulus Linux switch
- A host running apache on the same network. The example here uses Debian wheezy.
- Access to the Cumulus Linux repo from the network where the host and switch reside.
Set Up the Host
The host, where the web front end is going to reside for collection, must have three parts installed:
ganglia-monitor, also known asgmond(Ganglia monitoring daemon)gmetad, which stands for Ganglia meta daemonganglia-webfrontend, which contains the PHP-based real-time dynamic Web pages
You can learn more about these parts in Wikipedia and in the Ganglia documentation.
Install these components on the host:
user@webserver$ sudo apt-get install ganglia-monitor gmetad ganglia-webfrontendIf you are unfamiliar with
apache, the host needs to have the/etc/ganglia-webfrontend/apache.confcopied to/etc/apache2/sites-enabled/to enable the Ganglia Web front end, which defaults to http://<the-host-ip>/ganglia where <the-host-ip> is the IP of the host used, like http://10.0.1.1/ganglia.Configure the data sources. In this case, you are configuring the Cumulus Linux switch and the local host (Web server). On Debian wheezy, you can find this file at
/etc/ganglia/gmetad.conf.data_source "server" localhost server.lab.test 10.0.1.1 data_source "sw1" sw1.lab.test 10.0.1.11Cumulus Linux supports both multicast and unicast traffic with Ganglia. You are going to configure unicast rather than the default multicast because many environments do not want multicast. This is a personal preference and has no bearing on the output provided by Ganglia. First, edit
/etc/ganglia/gmond.confand set thesend_metadata_interval. This example uses 30 seconds.globals { daemonize = yes setuid = yes user = ganglia debug_level = 0 max_udp_msg_len = 1472 mute = no deaf = no host_dmax = 0 /*secs */ cleanup_threshold = 300 /*secs */ gexec = no send_metadata_interval = 30 }Set up the cluster. This information must match between the host and the nodes it is listening to. The example below uses RDU, which stands for Raleigh and Durham (two cities in central North Carolina). Continue editing
/etc/ganglia/gmond.conf.cluster { name = "RDU" owner = "RDU" latlong = "unspecified" url = "unspecified" }Set up the recieve and send channels with
udp(again, configuring/etc/ganglia/gmond.conf). Make them match the following:udp_send_channel { host = server.lab.test port = 8649 } udp_recv_channel { port = 8649 }Restart
gmondandgmetad.cumulus@switch$ sudo service ganglia-monitor restart cumulus@switch$ sudo service gmetad restartAt this point you should start seeing server statistics show up in Ganglia by viewing them at http://<the-host-ip>/ganglia. It is just seeing its own data. This example sometimes interchanges DNS and IP, making sure DNS is set up or only utilizing the reachable IPs.
Set Up the Switch
The switch, or node, where you want to monitor traffic must have just one package installed:
ganglia-monitor, also known asgmond(Ganglia monitoring daemon)
With
gmondadded to the Cumulus Linux repo, installganglia-monitorby running:cumulus@switch$ sudo apt-get install ganglia-monitorAs with the host (Web server), you are configuring unicast for this example. First set up the
send_metadata_intervalby editing/etc/ganglia/gmond.conf. This example uses 30 seconds.globals { daemonize = yes setuid = yes user = ganglia debug_level = 0 max_udp_msg_len = 1472 mute = no deaf = no host_dmax = 0 /*secs */ cleanup_threshold = 300 /*secs */ gexec = no send_metadata_interval = 30 }Set up the cluster; edit
/etc/ganglia/gmond.conf. This information must match between the switch and the host configured above. This example uses RDU.cluster { name = "RDU" owner = "RDU" latlong = "unspecified" url = "unspecified" }Set up the unicast send channels with
udpby configuring/etc/ganglia/gmond.confas follows:udp_send_channel { host = server.lab.test port = 8649 }Restart the
gmondprocess:cumulus@switch$ sudo service ganglia-monitor restartAfter a minute, the PHP front end on the host (server) starts getting enough data to see in the graphs. They look like the following:
First select sw1 and pick a metric like CPU speed.
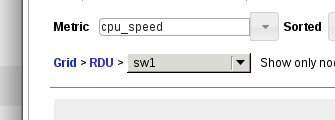
It opens up the following:
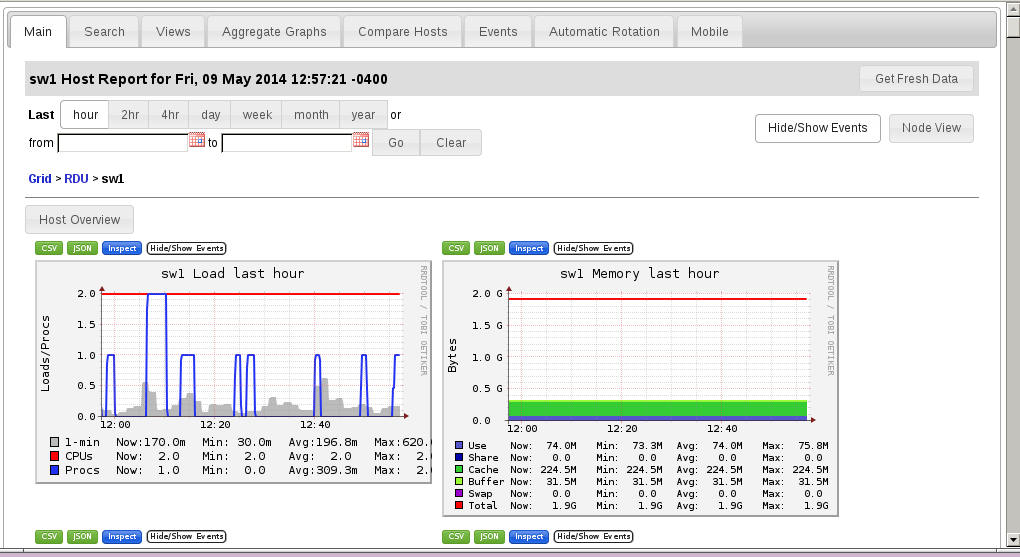
You can now use any Ganglia features just like you would on servers.
Multiple Interfaces Module
Ganglia was originally meant for hosts (servers) so originally most applications only used 1-2 interfaces. However, with Cumulus Linux, multiple front panel ports that show up as swp1->swpMAX where MAX is the last front panel port. Some users might not want to see aggregate packet counts for the switch but packet counts per-interface to watch utilization. To do this, you can add an open source module to Ganglia called multi\_interface.
Download multi_interface.py.
cumulus@switch$ sudo wget https://raw.githubusercontent.com/ganglia/gmond_python_modules/master/network/multi_interface/python_modules/multi_interface.py .Put
multi_interface.pyinto/usr/lib/ganglia/python_modules/.cumulus@switch$ sudo mkdir -p /usr/lib/ganglia/python_modules/; mv multi_interface.py /usr/lib/ganglia/python_modules/Download multi_interface.pyconf.
cumulus@switch$ sudo wget https://github.com/ganglia/gmond_python_modules/tree/master/network/iface/conf.d .Add the following lines to the module section in the
/etc/ganglia/gmond.confconfiguration file:cumulus@switch$ sudo vi /etc/ganglia/gmond.conf module { name = "python_module" path = "/usr/lib/ganglia/modpython.so" params = "/usr/lib/ganglia/python_modules/" }Also add the following line at the end of
/etc/ganglia/gmond.conf:include ('/etc/ganglia/conf.d/*.pyconf')Put
multi_interface.pyconfinto/etc/ganglia/conf.d/.cumulus@switch$ sudo mkdir -p /etc/ganglia/conf.d/; mv multi_interface.pyconf /etc/ganglia/conf.d/Restart
gmond.cumulus@switch$ sudo service ganglia-monitor restartThe display now has a multiple interfaces graphed for each swp as well as the management interface of eth0:
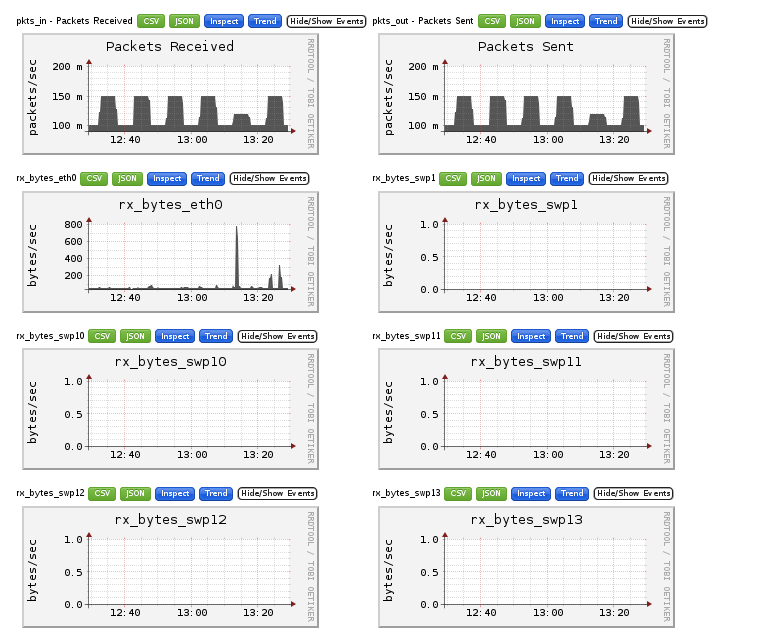
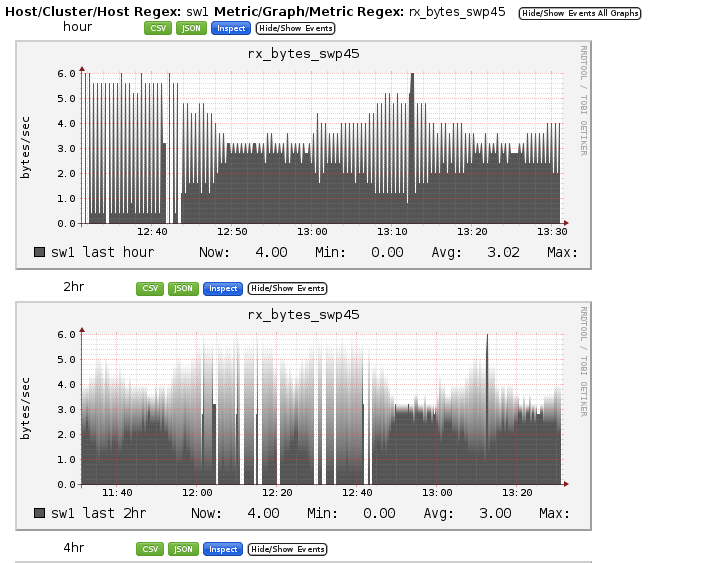
You can also see that while swp10-13 do not have any traffic running across them, unlike swp45, which has traffic running. Ganglia also allows you to zoom in to get more statistics with their Web interface.