


Performance Results#
The following performance data is representative. Actual results may vary depending on hardware configuration, input characteristics, and workload.
Test Conditions#
All figures on this page come from a single benchmark run of the 1.0.0 release across seven GPUs (2026-09-15), at FP16 precision, with the CUDA, TensorRT, and Triton Inference Server versions listed in the Support Matrix. Every row is therefore directly comparable with every other. The run used three input clips:
Label |
Resolution |
Clip |
|---|---|---|
720p |
1280 x 720 |
300 frames at 29.97 FPS |
1080p |
1920 x 1080 |
300 frames at 50 FPS |
4K (UHD) |
3840 x 2160 |
601 frames at 30 FPS |
Each clip was measured at concurrency levels c1, c2, c4, and c8 (1 to 8 concurrent streams) with 1 and 2 tracked bodies per frame. The 1080p clip was additionally measured at 4 and 8 tracked bodies per frame. The server admitted all streams at every concurrency level.
Note
This table covers the datacenter and flagship workstation GPUs that were benchmarked directly. Other compute capability 8.9 (Ada) GPUs listed in the Support Matrix, such as the L4, the RTX 6000 Ada Generation, and the RTX 4090, are not on this page. The L40S is the closest entry at the same compute capability, but it is not a substitute: throughput on a given card depends on its own clocks, power limit, and memory bandwidth. Measure on the card you intend to deploy on.
The frame rates are steady-state server-side inference rates, measured after results are flowing. They exclude the pipeline-buffering startup delay caused by the temporal window of the model (refer to Delayed Outputs), as well as video decode, gRPC transport, and writing the output file.
A frame rate measured over a whole short clip includes the buffering window and reads lower than these figures. Aggregate throughput is the total FPS processed across all concurrent streams; per-stream throughput is the aggregate divided by the number of streams.
Note
Every figure depends on the GPU, the input resolution, and the number of tracked bodies per frame. The NIM runs the pose model once per tracked box, so the body count alone changes the frame rate by 6.1x to 7.9x between one and eight bodies. Quote a frame rate together with all three, and divide the one-body figures below by the number of bodies you expect in frame.
30 FPS Throughput Capacity#
The following chart shows how much 30 FPS video a single GPU can process at one tracked body per frame, expressed as an equivalent number of 30 FPS streams: the peak aggregate throughput measured on that GPU divided by 30 FPS. Use it to size a deployment for a given volume of video.
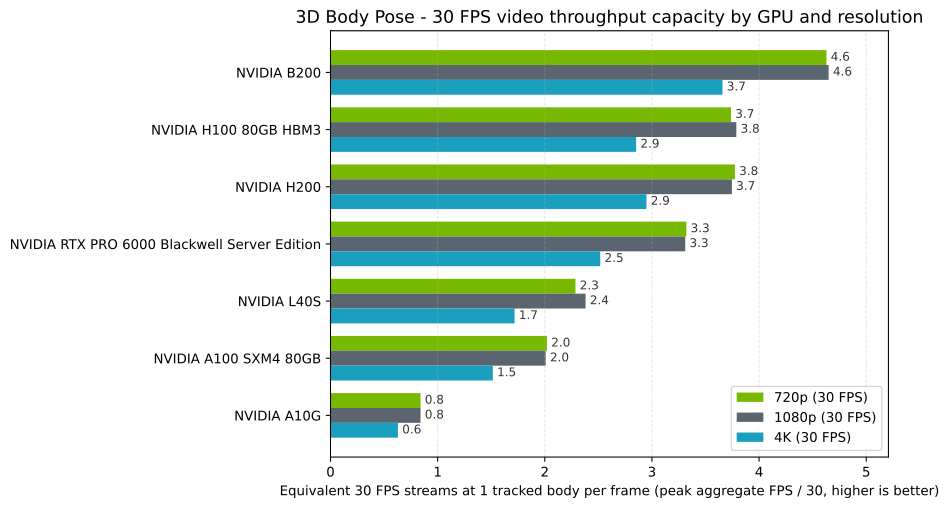
Equivalent 30 FPS streams a single GPU sustains at one tracked body per frame, by input resolution (720p / 1080p / 4K).#
Note
This is a throughput-capacity figure, not a count of concurrent live streams; it is what matters for offline and batch processing. Sustaining N streams live also requires the per-stream frame rate at concurrency N to stay at or above 30 FPS; refer to Per-Stream Throughput Across GPUs and Real-Time Stream Throughput. Resolution costs far less than body count: 4K capacity is 75% to 79% of 720p capacity on every GPU, whereas eight bodies per frame cost 6.1x to 7.9x.
Aggregate Throughput Across GPUs#
The following charts show the aggregate throughput at each concurrency level (c1, c2, c4, c8) for each supported GPU, at each input resolution and one tracked body per frame.
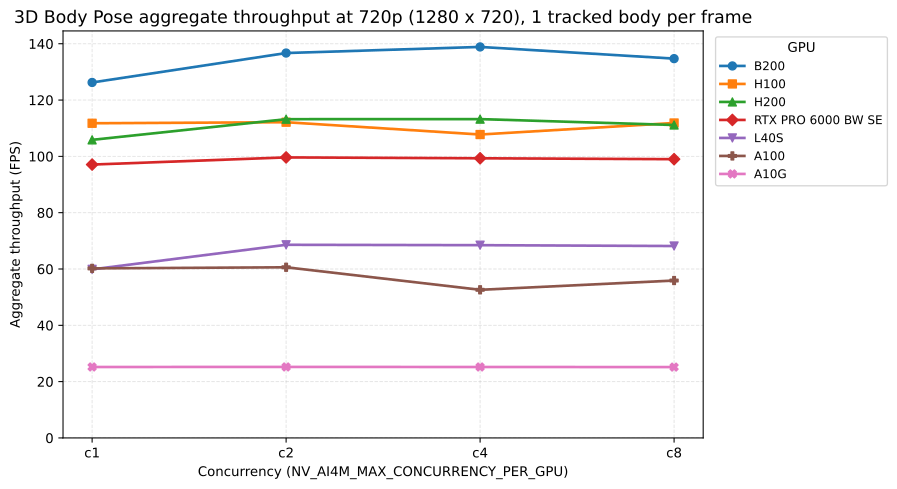
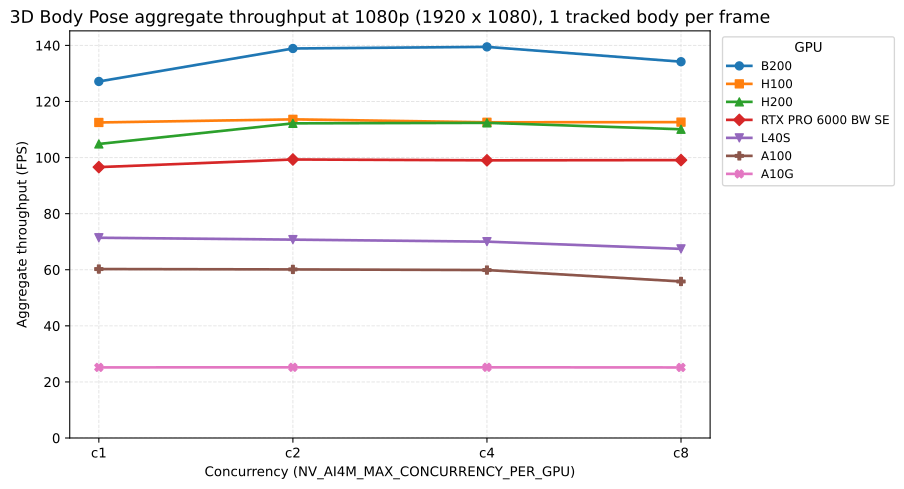
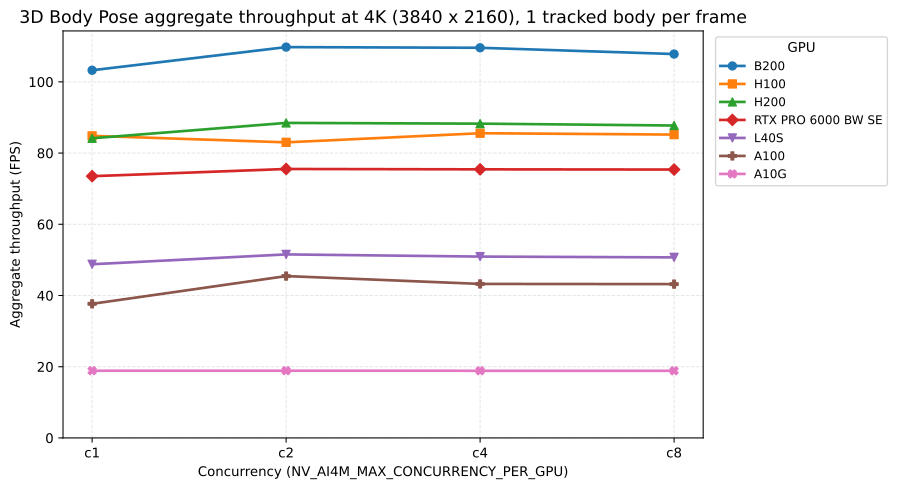
Aggregate throughput is nearly flat across concurrency levels: from c1 to c8 it changes by no more than 7% on every GPU and resolution in the Measured Data table except two, the L40S at 720p and the A100 at 4K, where it rises by 13.5% and 14.6%. On those two, the single-stream figure is the lowest of the four concurrency levels. Elsewhere a single stream already comes close to saturating the GPU, so raising NV_AI4M_MAX_CONCURRENCY_PER_GPU divides roughly the same total throughput into more, smaller shares rather than adding capacity.
Per-Stream Throughput Across GPUs#
The following charts show the per-stream throughput, the average FPS that each individual stream receives, at each concurrency level for each supported GPU, at each input resolution and one tracked body per frame. Use them to choose a concurrency level that keeps every stream at the frame rate your application requires.
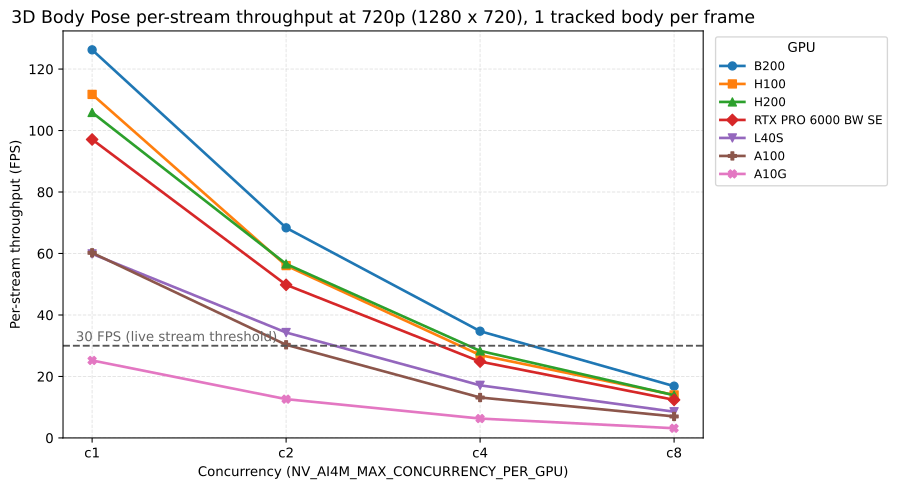
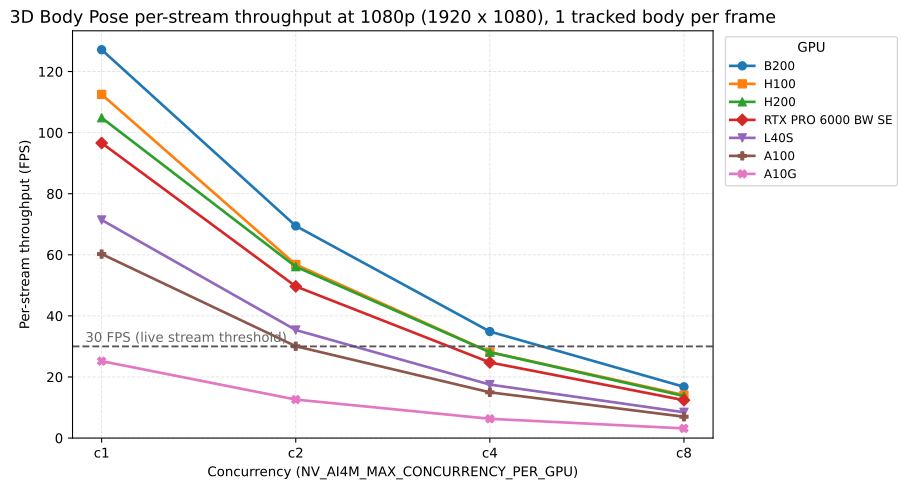
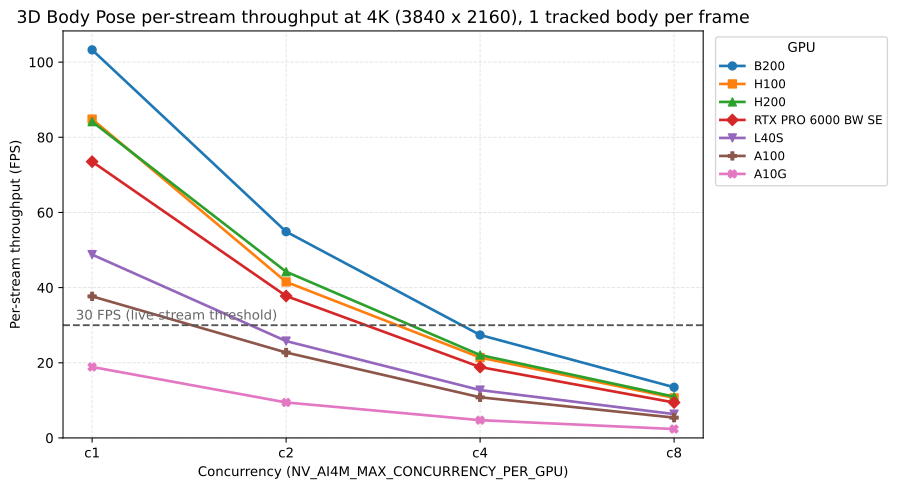
The dashed line marks 30 FPS: where a GPU’s curve crosses below it, that concurrency level can no longer sustain live 30 FPS streams. Per-stream throughput follows the 1/n trend because the aggregate is nearly flat. 720p and 1080p measure within a few FPS of each other on every GPU except the single-stream L40S 720p point (59.9 vs 71.4 FPS); 4K costs about a quarter of the throughput.
Throughput by GPU and Body Count#
The NIM estimates a pose for every tracked box in every frame, so the per-stream frame rate falls in proportion to the number of tracked bodies. The following chart shows the per-stream throughput at 1080p and one stream as the body count rises from 1 to 8.
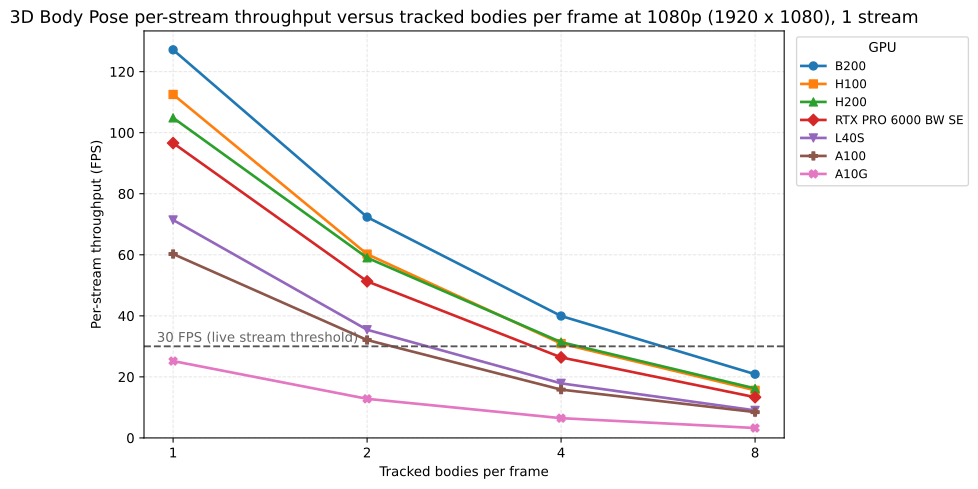
Per-stream throughput at 1080p (1920 x 1080) and one stream, by tracked bodies per frame.#
The following table lists the per-stream frame rate at one and at eight tracked bodies per frame, along with the per-body processing cost. Milliseconds per Body is the average inference cost of one tracked body, quoted at eight bodies per frame; use it to estimate the frame rate for a body count that is not listed.
GPU |
Milliseconds per Body |
Average FPS (1920x1080, 1 body) |
Average FPS (1920x1080, 8 bodies) |
Bodies per Second |
|---|---|---|---|---|
B200 |
5.99 |
127.15 |
20.88 |
167 |
H100 80GB HBM3 |
8.01 |
112.52 |
15.61 |
125 |
H200 |
7.71 |
104.86 |
16.21 |
130 |
NVIDIA RTX PRO 6000 Blackwell Server Edition |
9.37 |
96.60 |
13.34 |
107 |
L40S |
13.86 |
71.41 |
9.02 |
72 |
A100 SXM4 80GB |
14.78 |
60.25 |
8.46 |
68 |
A10G |
38.46 |
25.18 |
3.25 |
26 |
The cost per body barely changes with the body count; a frame with N bodies costs about N times a frame with one body. Against the 50 fps clip these rows were measured on, no listed GPU reaches real time at eight bodies: the eight-body rates run from 0.42x real time on a B200 down to 0.07x on an A10G.
Measured Data#
The following table lists the measured per-stream FPS at one tracked body per frame. c1, c2, c4, and c8 are concurrency levels, where c4 means 4 concurrent streams. Multiply a value by its concurrency level to get the aggregate throughput at that level.
GPU |
720p.c1 |
720p.c2 |
720p.c4 |
720p.c8 |
1080p.c1 |
1080p.c2 |
1080p.c4 |
1080p.c8 |
4K.c1 |
4K.c2 |
4K.c4 |
4K.c8 |
|---|---|---|---|---|---|---|---|---|---|---|---|---|
B200 |
126.2 |
68.3 |
34.7 |
16.8 |
127.2 |
69.5 |
34.9 |
16.8 |
103.3 |
54.9 |
27.4 |
13.5 |
H100 80GB HBM3 |
111.8 |
56.1 |
26.9 |
14.0 |
112.5 |
56.8 |
28.1 |
14.1 |
84.8 |
41.5 |
21.4 |
10.7 |
H200 |
105.9 |
56.6 |
28.3 |
13.9 |
104.9 |
56.1 |
28.1 |
13.8 |
84.2 |
44.2 |
22.1 |
11.0 |
NVIDIA RTX PRO 6000 Blackwell Server Edition |
97.1 |
49.8 |
24.8 |
12.4 |
96.6 |
49.7 |
24.8 |
12.4 |
73.5 |
37.8 |
18.9 |
9.4 |
L40S |
59.9 |
34.3 |
17.1 |
8.5 |
71.4 |
35.4 |
17.5 |
8.4 |
48.8 |
25.8 |
12.7 |
6.3 |
A100 SXM4 80GB |
60.2 |
30.3 |
13.2 |
7.0 |
60.2 |
30.1 |
15.0 |
7.0 |
37.7 |
22.7 |
10.8 |
5.4 |
A10G |
25.2 |
12.6 |
6.3 |
3.1 |
25.2 |
12.6 |
6.3 |
3.1 |
18.9 |
9.4 |
4.7 |
2.4 |
Concurrency#
The following table shows the per-stream frame rate on an L40S at 1080p as both the number of tracked bodies per frame and the number of concurrent streams increase. The two axes compound: the per-stream rate at 8 bodies and 8 streams is about 1/64 of the rate at 1 body and 1 stream.
Bodies per Frame (L40S, 1920x1080) |
1 Stream |
2 Streams |
4 Streams |
8 Streams |
|---|---|---|---|---|
1 |
71.41 |
35.37 |
17.50 |
8.43 |
2 |
35.44 |
16.99 |
8.64 |
4.34 |
4 |
17.88 |
8.79 |
4.43 |
2.21 |
8 |
9.02 |
4.48 |
2.24 |
1.12 |
For more information about the concurrency setting, refer to Multiple Concurrent Inputs.
Real-Time Stream Throughput#
The following tables derive, from the measurements above, how many concurrent streams each GPU sustains in real time: the highest measured concurrency at which the per-stream frame rate still meets or exceeds 30 FPS. The first table is for one tracked body per frame, the second for two.
GPU |
720p (30 FPS) |
1080p (30 FPS) |
4K (30 FPS) |
|---|---|---|---|
B200 |
4 |
4 |
2 |
H100 80GB HBM3 |
2 |
2 |
2 |
H200 |
2 |
2 |
2 |
NVIDIA RTX PRO 6000 Blackwell Server Edition |
2 |
2 |
2 |
L40S |
2 |
2 |
1 |
A100 SXM4 80GB |
2 |
2 |
1 |
A10G |
none |
none |
none |
At two tracked bodies per frame:
GPU |
720p (30 FPS) |
1080p (30 FPS) |
4K (30 FPS) |
|---|---|---|---|
B200 |
2 |
2 |
1 |
H100 80GB HBM3 |
1 |
2 |
1 |
H200 |
2 |
2 |
1 |
NVIDIA RTX PRO 6000 Blackwell Server Edition |
1 |
1 |
1 |
L40S |
1 |
1 |
none |
A100 SXM4 80GB |
1 |
1 |
none |
A10G |
none |
none |
none |
“none” means the GPU did not reach 30 FPS even at a concurrency of 1. Those GPUs remain suitable for offline processing, where total throughput matters more than keeping pace with playback. The counts fall with the body count: at eight bodies per frame no listed GPU reaches 30 FPS at any concurrency.
Real-time throughput also assumes the input arrives at least as fast as the NIM processes it. A client uploading over a slow link is bounded by the link rather than by the GPU.
For more information, refer to the NIM clients GitHub repository: NVIDIA-Maxine/nim-clients.