


Performance Results#
This page provides throughput measurements for the LipSync NIM on a single GPU at 720p, 1080p, and 4K, and shows how many concurrent streams can stay at live 30 FPS.
Performance Data#
The following data shows the performance of the LipSync NIM for concurrent streams on a single GPU with the provided sample input files and the Python client. All measurements use 30 FPS input at three resolutions:
Label |
Resolution |
|---|---|
720p |
1280 x 720 |
1080p |
1920 x 1080 |
4K (UHD) |
3840 x 2160 |
The LipSync NIM supports concurrent streams per GPU. The number of concurrent streams can be configured using the NV_AI4M_MAX_CONCURRENCY_PER_GPU environment variable (default: 1). Higher concurrency values consume more GPU memory and can cause out-of-memory errors.
Note
Running more than two concurrent 4K streams uses a considerable amount of VRAM and can cause out-of-memory errors on GPUs with less memory. Raise NV_AI4M_MAX_CONCURRENCY_PER_GPU at 4K with care and watch GPU memory as you do. The 4K charts and tables on this page therefore stop at a concurrency of 2.
30 FPS Throughput Capacity#
The following chart shows how much 30 FPS video a single GPU can process, expressed as an equivalent number of 30 FPS streams: the peak aggregate throughput measured on that GPU divided by 30 FPS. Use it to size a deployment for a given volume of video.
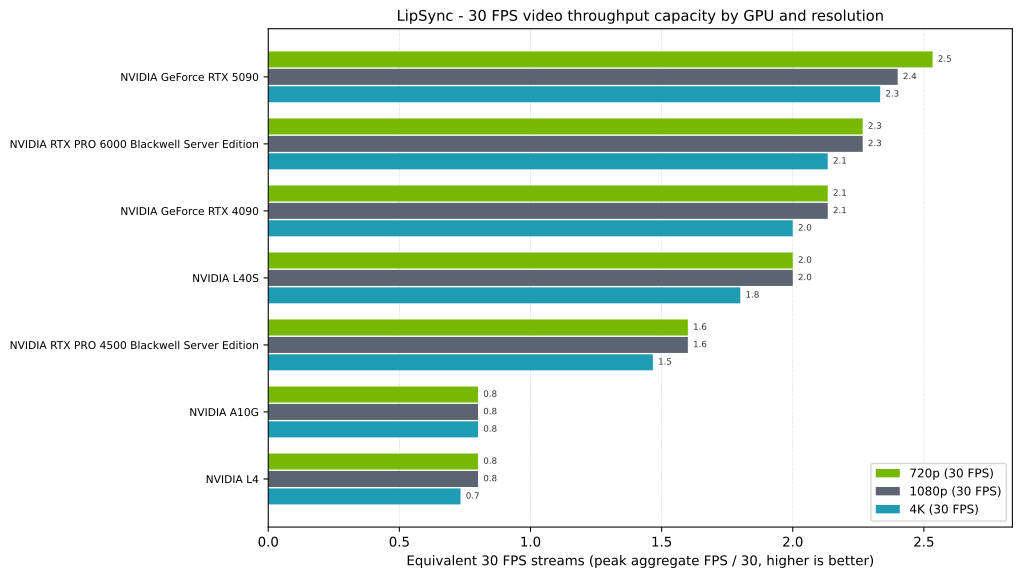
Equivalent 30 FPS streams that a single GPU sustains, by input resolution (720p / 1080p / 4K).#
Note
This is a throughput-capacity figure, not a count of concurrent live streams — it is what matters for offline and batch processing. Sustaining N streams live also requires the per-stream frame rate at concurrency N to stay at or above 30 FPS; refer to Per-Stream Throughput Across GPUs and Live Stream Throughput (30 FPS).
Aggregate Throughput Across GPUs#
The following charts show the aggregate throughput — the total FPS processed across all concurrent streams — at each concurrency level (c1, c2, c4) for each supported GPU, at each input resolution.
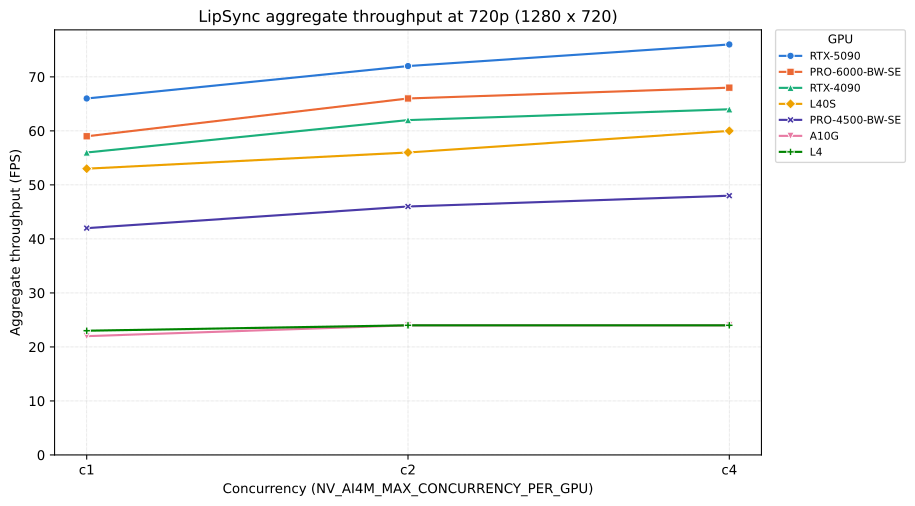
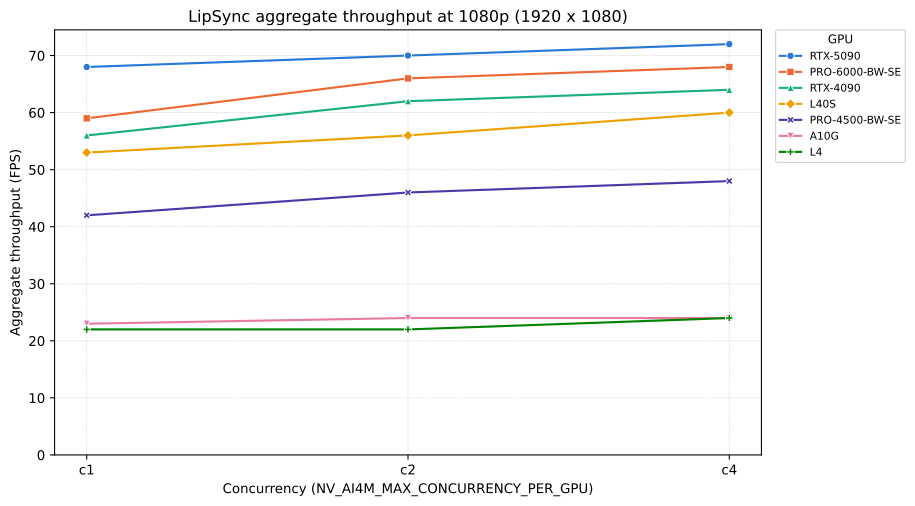
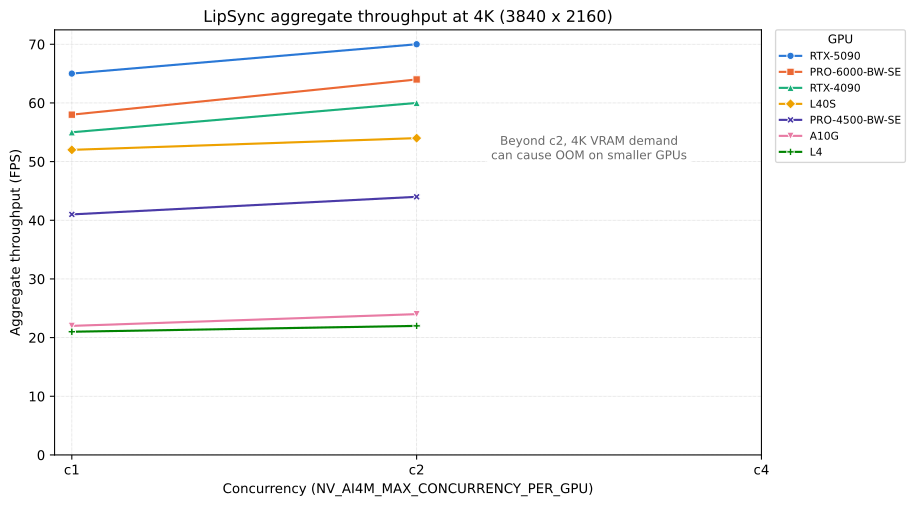
Aggregate throughput rises only modestly with concurrency — roughly 10 to 15 percent from c1 to c4 on the faster GPUs, and less than that on the A10G and the L4. A single stream already occupies most of the device, so raising concurrency mainly divides the same total throughput into more, smaller shares rather than adding capacity.
Per-Stream Throughput Across GPUs#
The following charts show the per-stream throughput — the average FPS that each individual stream receives — at each concurrency level for each supported GPU, at each input resolution. Use them to choose a concurrency level that keeps every stream at the frame rate your application requires.
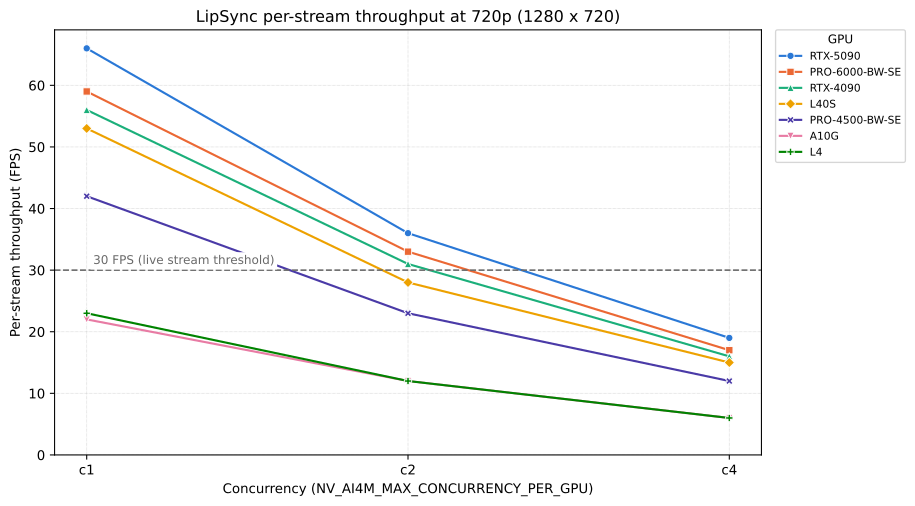
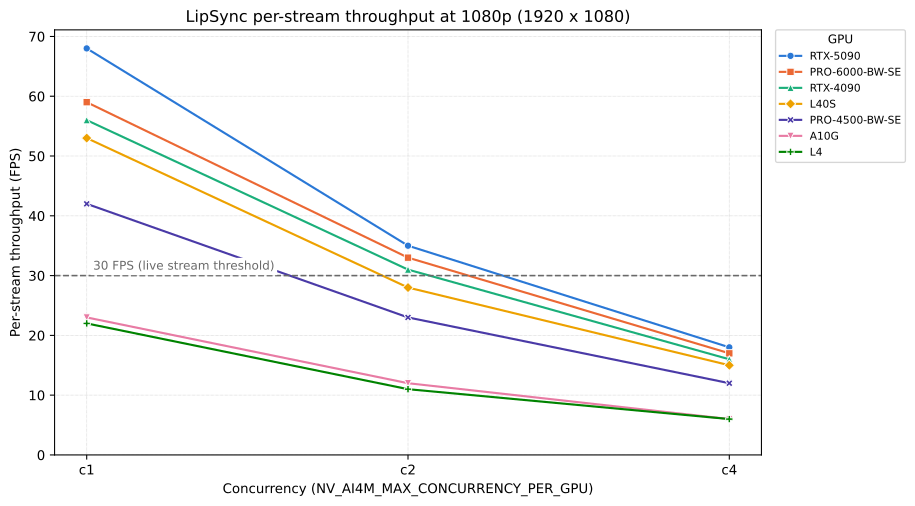
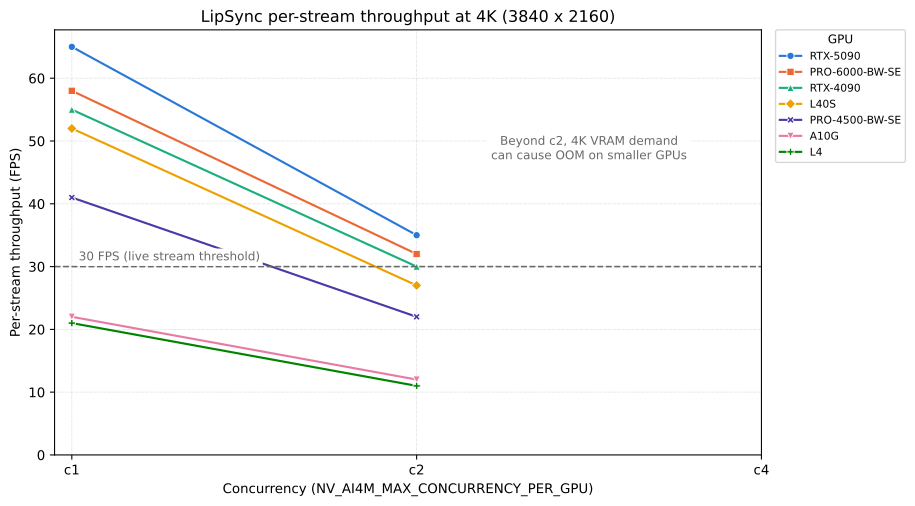
The dashed line marks 30 FPS: where a GPU’s curve crosses below it, that concurrency level can no longer sustain live 30 FPS streams. Per-stream throughput falls close to the 1/n trend, because aggregate throughput is nearly flat across concurrency levels. Resolution has little effect — at most a few FPS between 720p and 4K on any GPU — so the NIM is bound by the model rather than by pixel count. The A10G and L4 curves overlap because the two GPUs measure within 1 FPS of each other at every point.
Measured Data#
The following table lists the measured average FPS per stream. c1, c2, and c4 are concurrency levels, where c4 means 4 concurrent streams. Multiply a value by its concurrency level to get the aggregate throughput at that level — for example, 36 FPS at c2 is 72 FPS aggregate.
GPU |
720p.c1 |
720p.c2 |
720p.c4 |
1080p.c1 |
1080p.c2 |
1080p.c4 |
4K.c1 |
4K.c2 |
|---|---|---|---|---|---|---|---|---|
RTX 5090 |
66 |
36 |
19 |
68 |
35 |
18 |
65 |
35 |
RTX PRO 6000 Blackwell Server Edition |
59 |
33 |
17 |
59 |
33 |
17 |
58 |
32 |
RTX 4090 |
56 |
31 |
16 |
56 |
31 |
16 |
55 |
30 |
L40S |
53 |
28 |
15 |
53 |
28 |
15 |
52 |
27 |
RTX PRO 4500 Blackwell Server Edition |
42 |
23 |
12 |
42 |
23 |
12 |
41 |
22 |
A10G |
22 |
12 |
6 |
23 |
12 |
6 |
22 |
12 |
L4 |
23 |
12 |
6 |
22 |
11 |
6 |
21 |
11 |
The inference FPS is calculated by dividing the total number of frames in the input video file by the total inference time in seconds (measured from the time the request is sent until the complete output file is received by the client).
Note: Video extension operations significantly increase processing time and memory usage due to frame buffering.
Live Stream Throughput (30 FPS)#
The following table derives, from the measurements above, how many concurrent live 30 FPS streams each GPU sustains — the highest measured concurrency at which the average FPS per stream still meets or exceeds the 30 FPS frame rate of the input video.
GPU |
720p 30 fps |
1080p 30 fps |
4K 30 fps |
|---|---|---|---|
RTX 5090 |
2 |
2 |
2 |
RTX PRO 6000 Blackwell Server Edition |
2 |
2 |
2 |
RTX 4090 |
2 |
2 |
2 |
L40S |
1 |
1 |
1 |
RTX PRO 4500 Blackwell Server Edition |
1 |
1 |
1 |
A10G |
— |
— |
— |
L4 |
— |
— |
— |
A dash means the GPU did not reach 30 FPS even for a single stream. Those GPUs remain suitable for offline processing, where total throughput matters more than keeping pace with playback. Counts for the 4K profile stop at 2, where VRAM rather than throughput becomes the limiting factor. On RTX 4090, the 4K result at a concurrency of 2 lands exactly on 30 FPS, so treat it as having no headroom.
Live throughput also assumes the input arrives at least as fast as the NIM processes it. A client uploading over a slow link is bounded by the link rather than by the GPU.
For more information, refer to the NIM clients GitHub repository: NVIDIA-Maxine/nim-clients.