Observability for NeMo Retriever Text Embedding NIM#
Use this documentation to learn about observability for NeMo Retriever Text Embedding NIM.
About Observability#
NeMo Retriever Text Embedding NIM supports exporting metrics and traces in an OpenTelemetry-compatible format. Additionally, the microservice and its underlying NVIDIA Triton Inference Server expose metrics through Prometheus endpoints.
To collect these metrics and traces, export them to a running OpenTelemetry Collector instance, which can then export them to any OTLP-compatible backend.
Metrics and Traces#
You can collect metrics from both the NIM microservice and the Triton Inference Server instance.
The following environment variables are related to exporting OpenTelemetry metrics and traces from the NIM microservice.
Variable |
Description |
|---|---|
|
Set to 1 to enable OpenTelemetry instrumentation in NIMs. Default value: None |
|
Specifies the name of the service to use in the exported metrics. |
|
Specifies the endpoint of an OTLP HTTP receiver. Currently, gRPC is not supported. |
|
Specifies to export metrics to the specified |
|
Specifies to export traces to the specified |
The NIM microservice and Triton Inference Server also expose metrics in Prometheus format.
You can access these metrics through the NIM microservice API at <nim-host>:8000/v1/metrics, and the Triton metrics endpoint at <nim-host>:8002/metrics, respectively.
Enabling OpenTelemetry#
The following example requires that an OpenTelemetry Collector HTTP receiver is running at <opentelemetry-collector-host> on port <opentelemetry-collector-http-port>.
export IMG_NAME=nvcr.io/nim/nvidia/llama-3.2-nv-embedqa-1b-v2
export IMG_TAG=1.11.0

# Choose a container name for bookkeeping
export CONTAINER_NAME=$(basename $IMG_NAME)

# Set the OTEL environment variables to enable metrics exporting
export NIM_ENABLE_OTEL=1
export OTEL_SERVICE_NAME=$CONTAINER_NAME
export OTEL_METRICS_EXPORTER=otlp
export OTEL_TRACES_EXPORTER=otlp
export OTEL_EXPORTER_OTLP_ENDPOINT="http://<opentelemetry-collector-host>:<opentelemetry-collector-http-port>"

docker run --runtime=nvidia -it --rm --name=$CONTAINER_NAME \
  ... \
  -e NIM_ENABLE_OTEL \
  -e OTEL_SERVICE_NAME \
  -e OTEL_METRICS_EXPORTER \
  -e OTEL_TRACES_EXPORTER \
  -e OTEL_EXPORTER_OTLP_ENDPOINT \
  ... \
  $IMG_NAME:$IMG_TAG
Receiving and Exporting Telemetry Data#
The following OpenTelemetry Collector configuration enables both metrics and tracing exports.
Two receivers are defined:
An OTLP receiver that receives both metrics and trace data from the NIM microservice.
A Prometheus receiver scrapes Triton Inference Server metrics.
Three exporters are defined:
A Zipkin exporter to a running Zipkin instance.
An OTLP exporter to a downstream collector or backend, such as Datadog.
A debug exporter that prints received data to the console. This exporter is helpful for testing and development purposes.
Traces are received exclusively by the OTLP receiver and exported by both the Zipkin and debug exporters. Metrics are received by the OTLP and Prometheus receivers. The metrics are exported by the OTLP and debug exporters.
receivers:
  otlp:
    protocols:
      http:
        endpoint: "0.0.0.0:4318"
        cors:
          allowed_origins:
            - "*"
  prometheus:
    config:
      scrape_configs:
        - job_name: nim-triton-metrics
          scrape_interval: 10s
          static_configs:
            - targets: ["<nim-endpoint>:8002"]
exporters:
  # NOTE: Prior to v0.86.0 use `logging` instead of `debug`.
  zipkin:
    endpoint: "<zipkin-endpoint>:<zipkin-port>/api/v2/spans"
  otlp:
    endpoint: "<otlp-metrics-endpoint>:<otlp-metrics-port>"
    tls:
      insecure: true
  debug:
    verbosity: detailed
service:
  pipelines:
    traces:
      receivers: [otlp]
      exporters: [debug, zipkin]
    metrics:
      receivers: [otlp, prometheus]
      exporters: [debug, otlp]
Prometheus and Grafana Docker Compose Full Example#
Download the example and run it#
To create an example dashboard, use the following procedure.
Download and unzip the files.
Export your NGC API key by running the following code.
export NGC_API_KEY=<NGC API KEY>
Launch the NIM with observability by running the following code.
./launch.sh
Start the observability stack by running the following code.
docker compose --profile observability up
Open Grafana at
http://<ip_address>:3000. The default credentials areadmin/admin.Add a Prometheus data source that has the URL
http://<ip_address>:9090.Add the example-dashboard.json to the Grafana dashboard page.
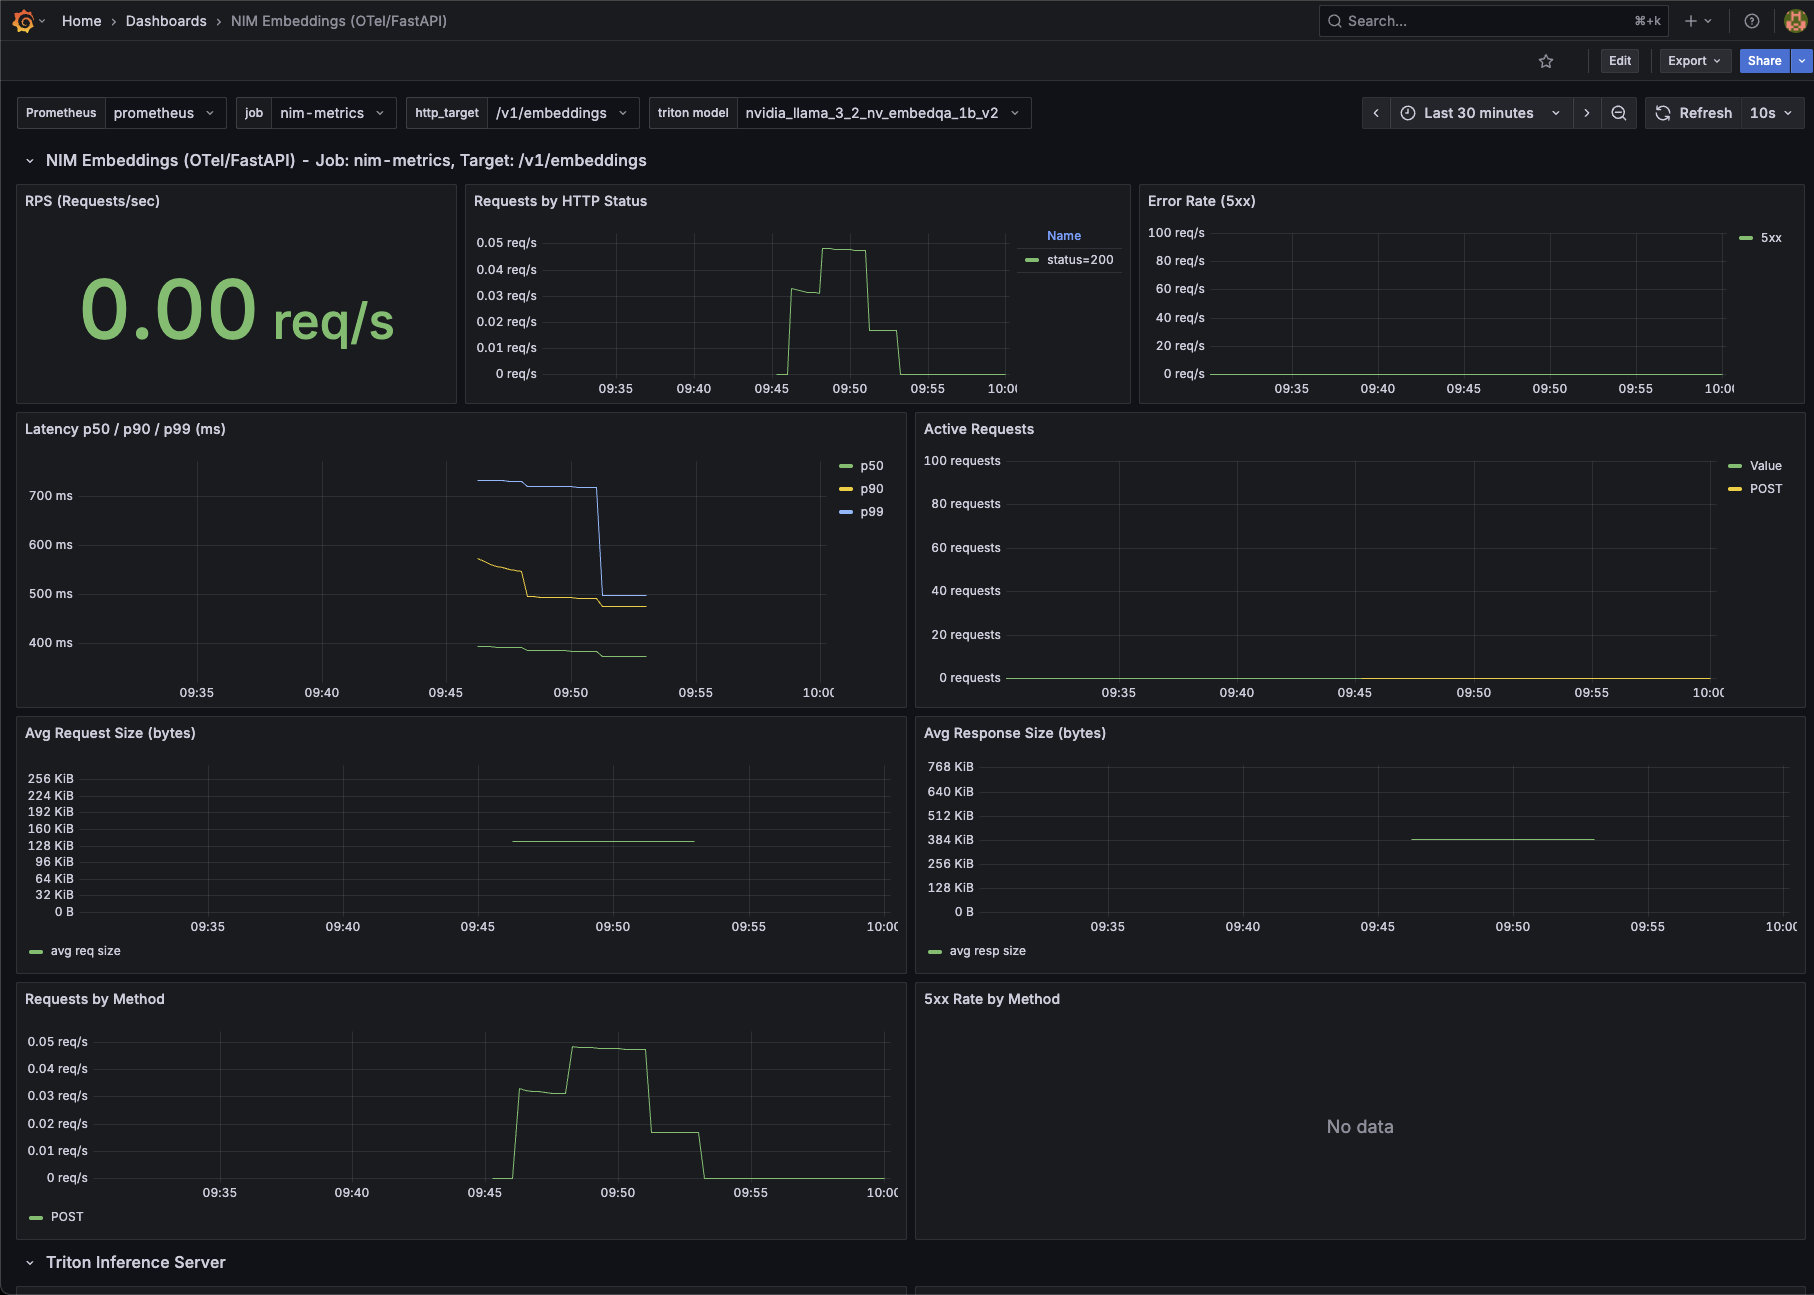
The example dashboard with metrics should look similar to the following.
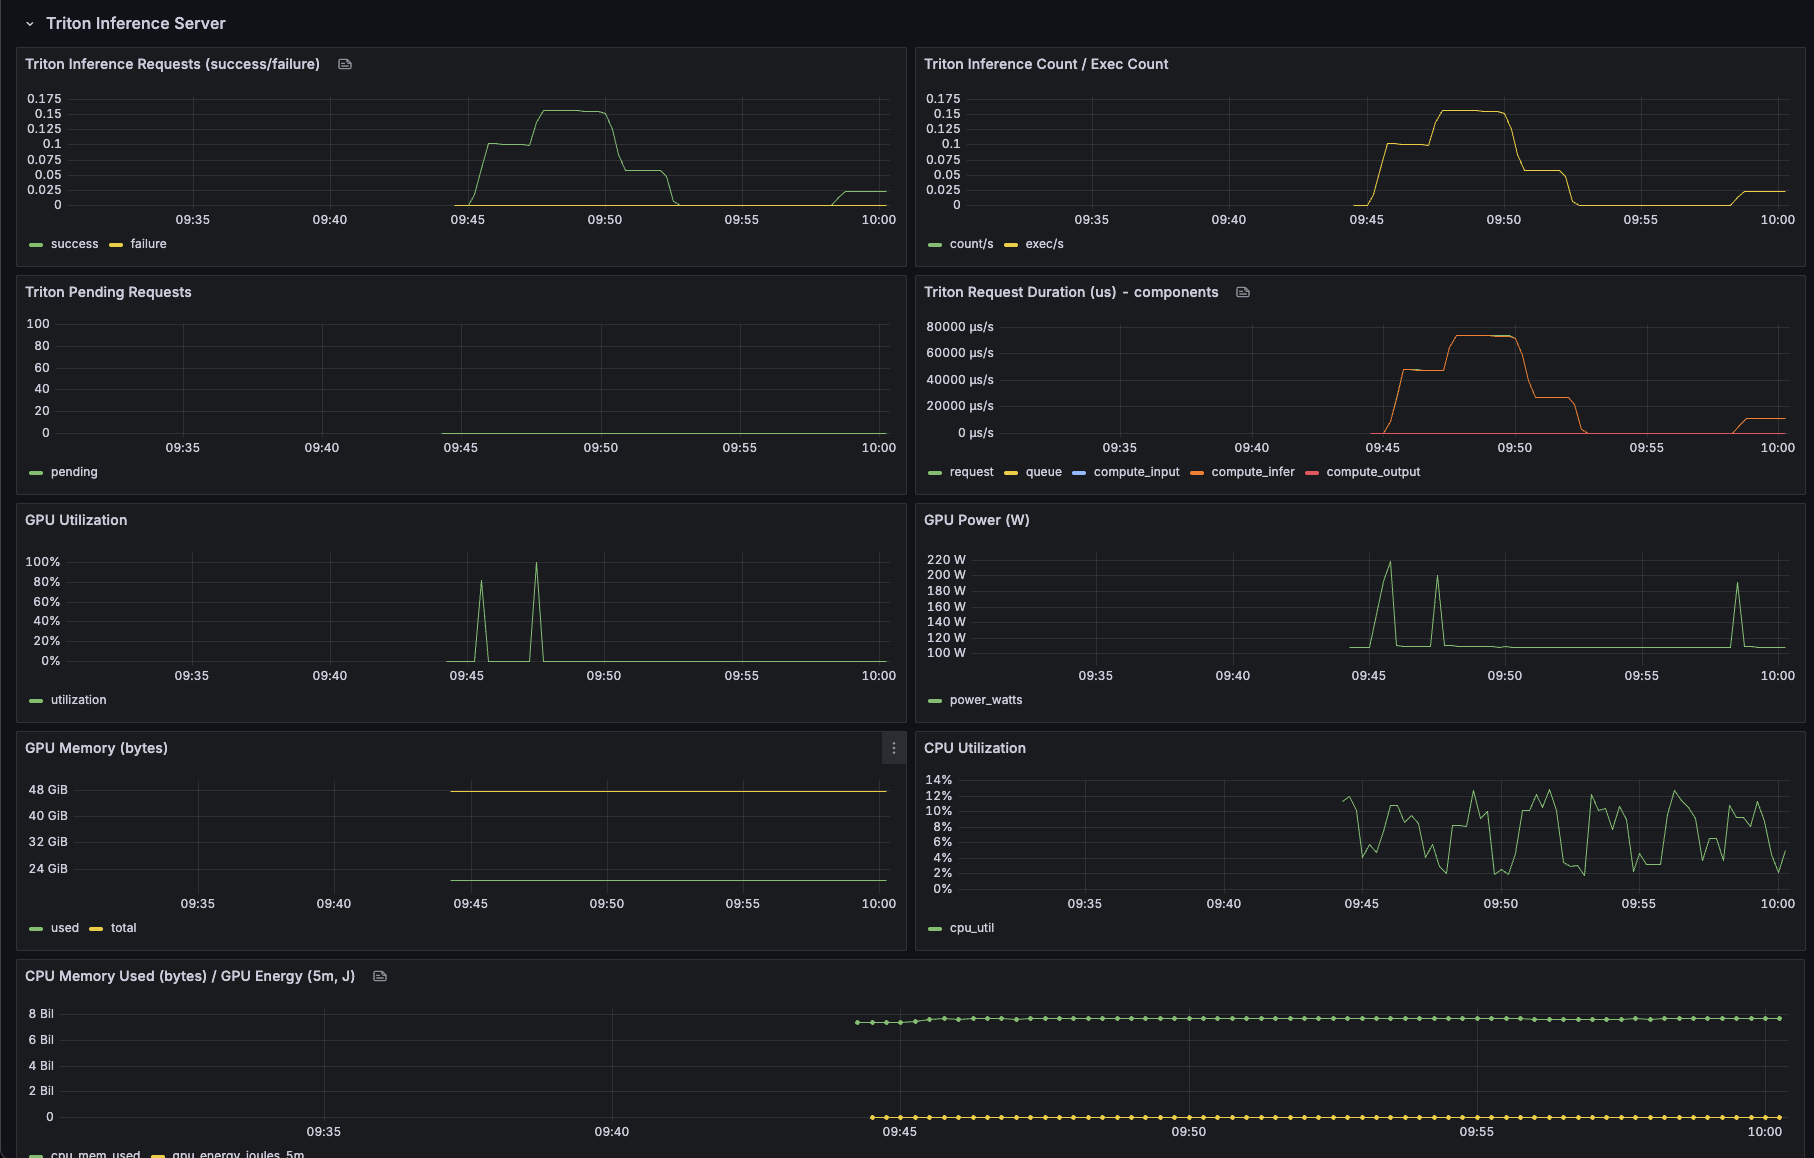
The example dashboard for the Triton Inference Server should look similar to the following.