Observability
NIM provides Prometheus metrics indicating request statistics. These metrics can be used to create dashboards with the Grafana dashboard. By default, these metrics are available at http://localhost:8000/metrics.
curl -X 'GET' 'http://0.0.0.0:8000/metrics'
The following table describes the available metrics.
Category |
Metric |
Metric Name |
Description |
Granularity |
Frequency |
|---|---|---|---|---|---|
KV Cache Count |
GPU Cache Usage |
gpu_cache_usage_perc |
GPU KV-cache usage. 1 means 100 percent usage |
Per model |
Per iteration |
Running Count |
num_requests_running |
Number of requests currently running on GPU |
Per model |
Per iteration |
|
Waiting Count |
num_requests_waiting |
Number of requests waiting to be processed |
Per model |
Per iteration |
|
Max Request Count |
num_request_max |
Max number of concurrently running requests |
Per model |
Per iteration |
|
Total Prompt Token Count |
prompt_tokens_total |
Number of prefill tokens processed |
Per model |
Per iteration |
|
Total Generation Token Count |
generation_tokens_total |
Number of generation tokens processed |
Per model |
Per iteration |
|
Latency |
Time to First Token |
time_to_first_token_seconds |
Histogram of time to first token in seconds |
Per model |
Per request |
Time per Output Token |
time_per_output_token_seconds |
Histogram of time per output token in seconds |
Per model |
Per request |
|
End to End Request Latency |
e2e_request_latency_seconds |
Histogram of end to end request latency in seconds |
Per model |
Per request |
|
Vision Encoder Latency |
vision_encoder_latency_seconds |
Histogram of vision encoder latency in seconds |
Per model |
Per request |
|
Count |
Prompt Token Count |
request_prompt_tokens |
Histogram of number of prefill tokens processed |
Per model |
Per request |
Generation Token Count |
request_generation_tokens |
Histogram of number of generation tokens processed |
Per model |
Per request |
|
Finished Request Count |
request_finish_total |
Number of finished requests, with label indicating finish reason |
Per model |
Per request |
|
Successful Request Count |
request_success_total |
Number of successful requests |
Per model |
Per request |
|
Successful Request Count |
request_failure_total |
Number of failed requests |
Per model |
Per request |
|
Image Count |
request_image_count |
Histogram of the number of images per request |
Per model |
Per request |
|
Image |
Image size |
image_size_pixels |
Histogram of image sizes in pixels |
Per model |
Per request |
Prometheus
To install Prometheus for scraping metrics from NIM, download the latest Prometheus version appropriate for your system.
wget https://github.com/prometheus/prometheus/releases/download/v2.52.0/prometheus-2.52.0.linux-amd64.tar.gz
tar -xvzf prometheus-2.52.0.linux-amd64.tar.gz
cd prometheus-2.52.0.linux-amd64/
Edit the Prometheus configuration file prometheus.yml to scrape from the NIM endpoint. Make sure the targets field point to localhost:8000.
# A scrape configuration containing exactly one endpoint to scrape:
# Here it's Prometheus itself.
scrape_configs:
  # The job name is added as a label `job=<job_name>` to any timeseries scraped from this config.
  - job_name: "prometheus"

    # metrics_path defaults to '/metrics'
    # scheme defaults to 'http'.

    static_configs:
      - targets: ["localhost:8000"]
Run the Prometheus server
./prometheus --config.file=./prometheus.yml
Open a browser and point it to http://localhost:9090/targets?search= to check that the NIM target was detected by the Prometheus server. You can also click on the NIM target url link to explore the generated metrics.
Grafana
We can use Grafana for dashboarding NIM metrics. Install the latest Grafana version appropriate for your system.
wget https://dl.grafana.com/oss/release/grafana-11.0.0.linux-amd64.tar.gz
tar -zxvf grafana-11.0.0.linux-amd64.tar.gz
cd grafana-v11.0.0/
Run the Grafana server
./bin/grafana-server
To access the Grafana dashboard, point your browser to http://localhost:3000. You will need to log in using the defaults.
username: admin
password: admin
The first step is to configure the source from which Grafana can scrape metrics. Click on the “Data Source” button, select Prometheus, and specify the Prometheus URL localhost:9090. After saving the configuration, you should see a success message.
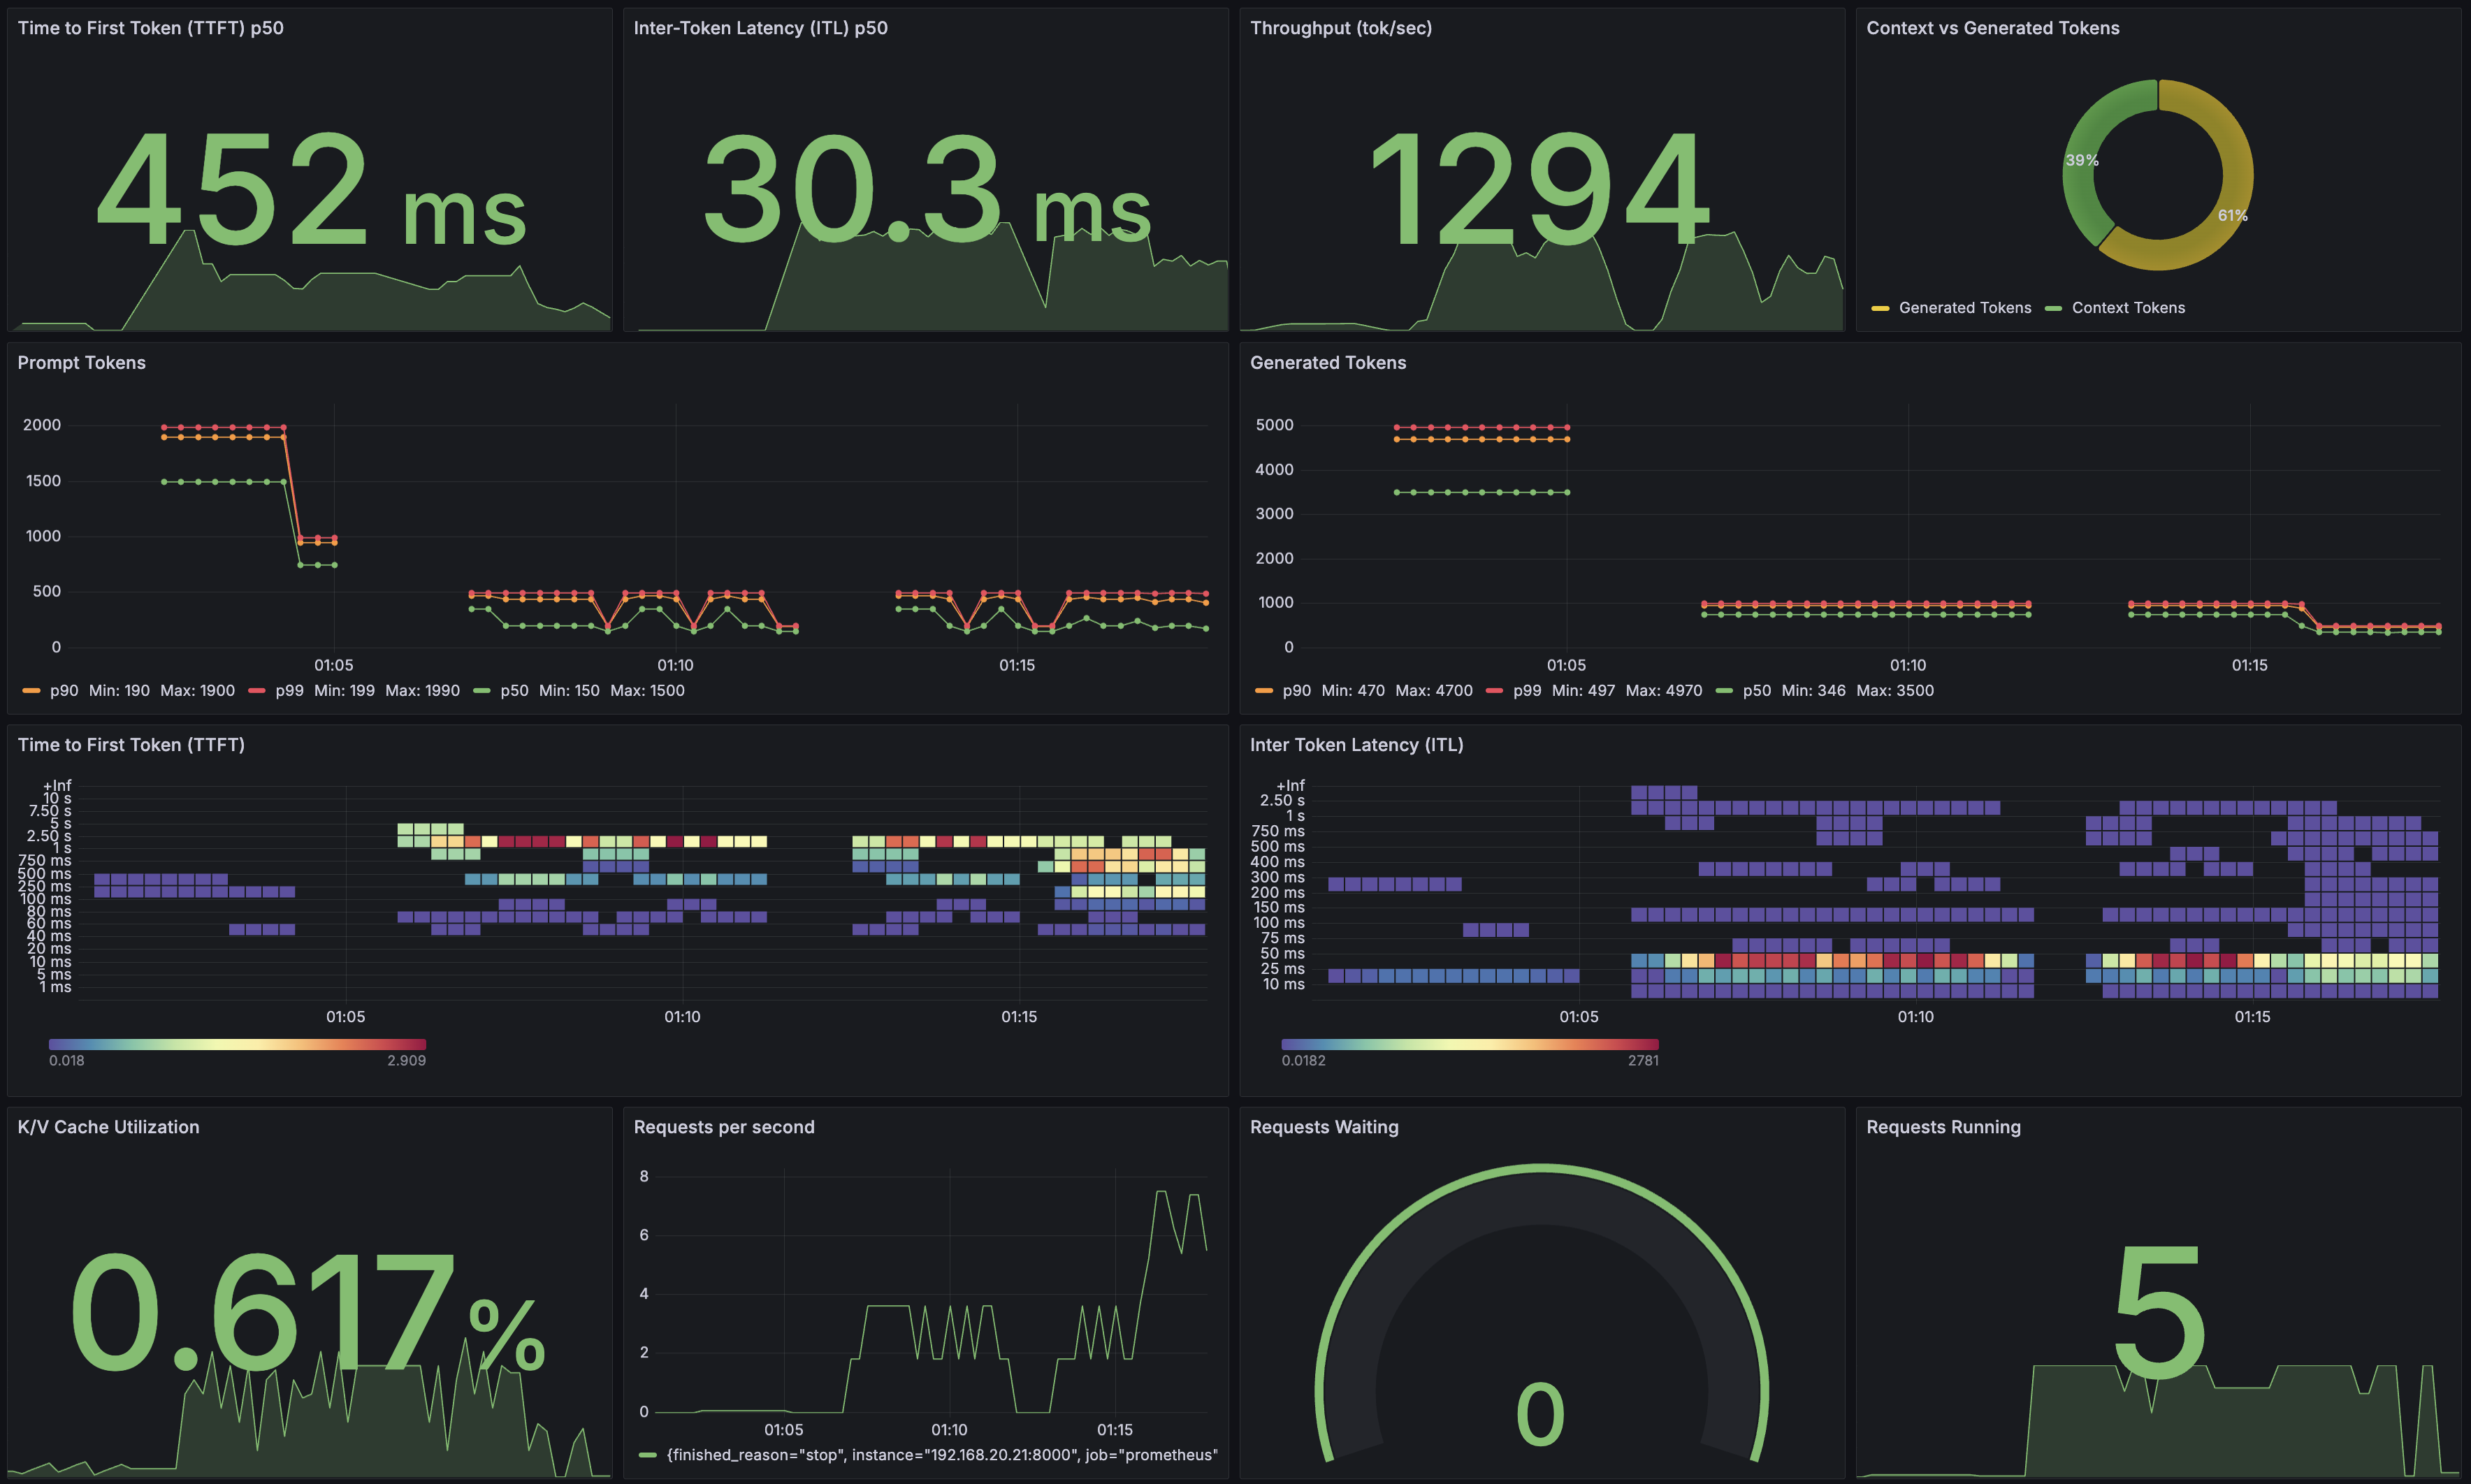
Now you are ready to create a dashboard with metrics from NIM. This Grafana tutorial provides step-by-step instructions on building a dashboard from scratch. Alternatively, you can jump start using this example dashboard.
Vision metrics
Vision-related metrics (e.g., Vision Encoder Latency) are only available for the TRT-LLM backend (the vLLM backend only collects end-to-end metrics). Consider starting with this example dashboard instead if NIM runs TRT-LLM optimized engines.