Observability#
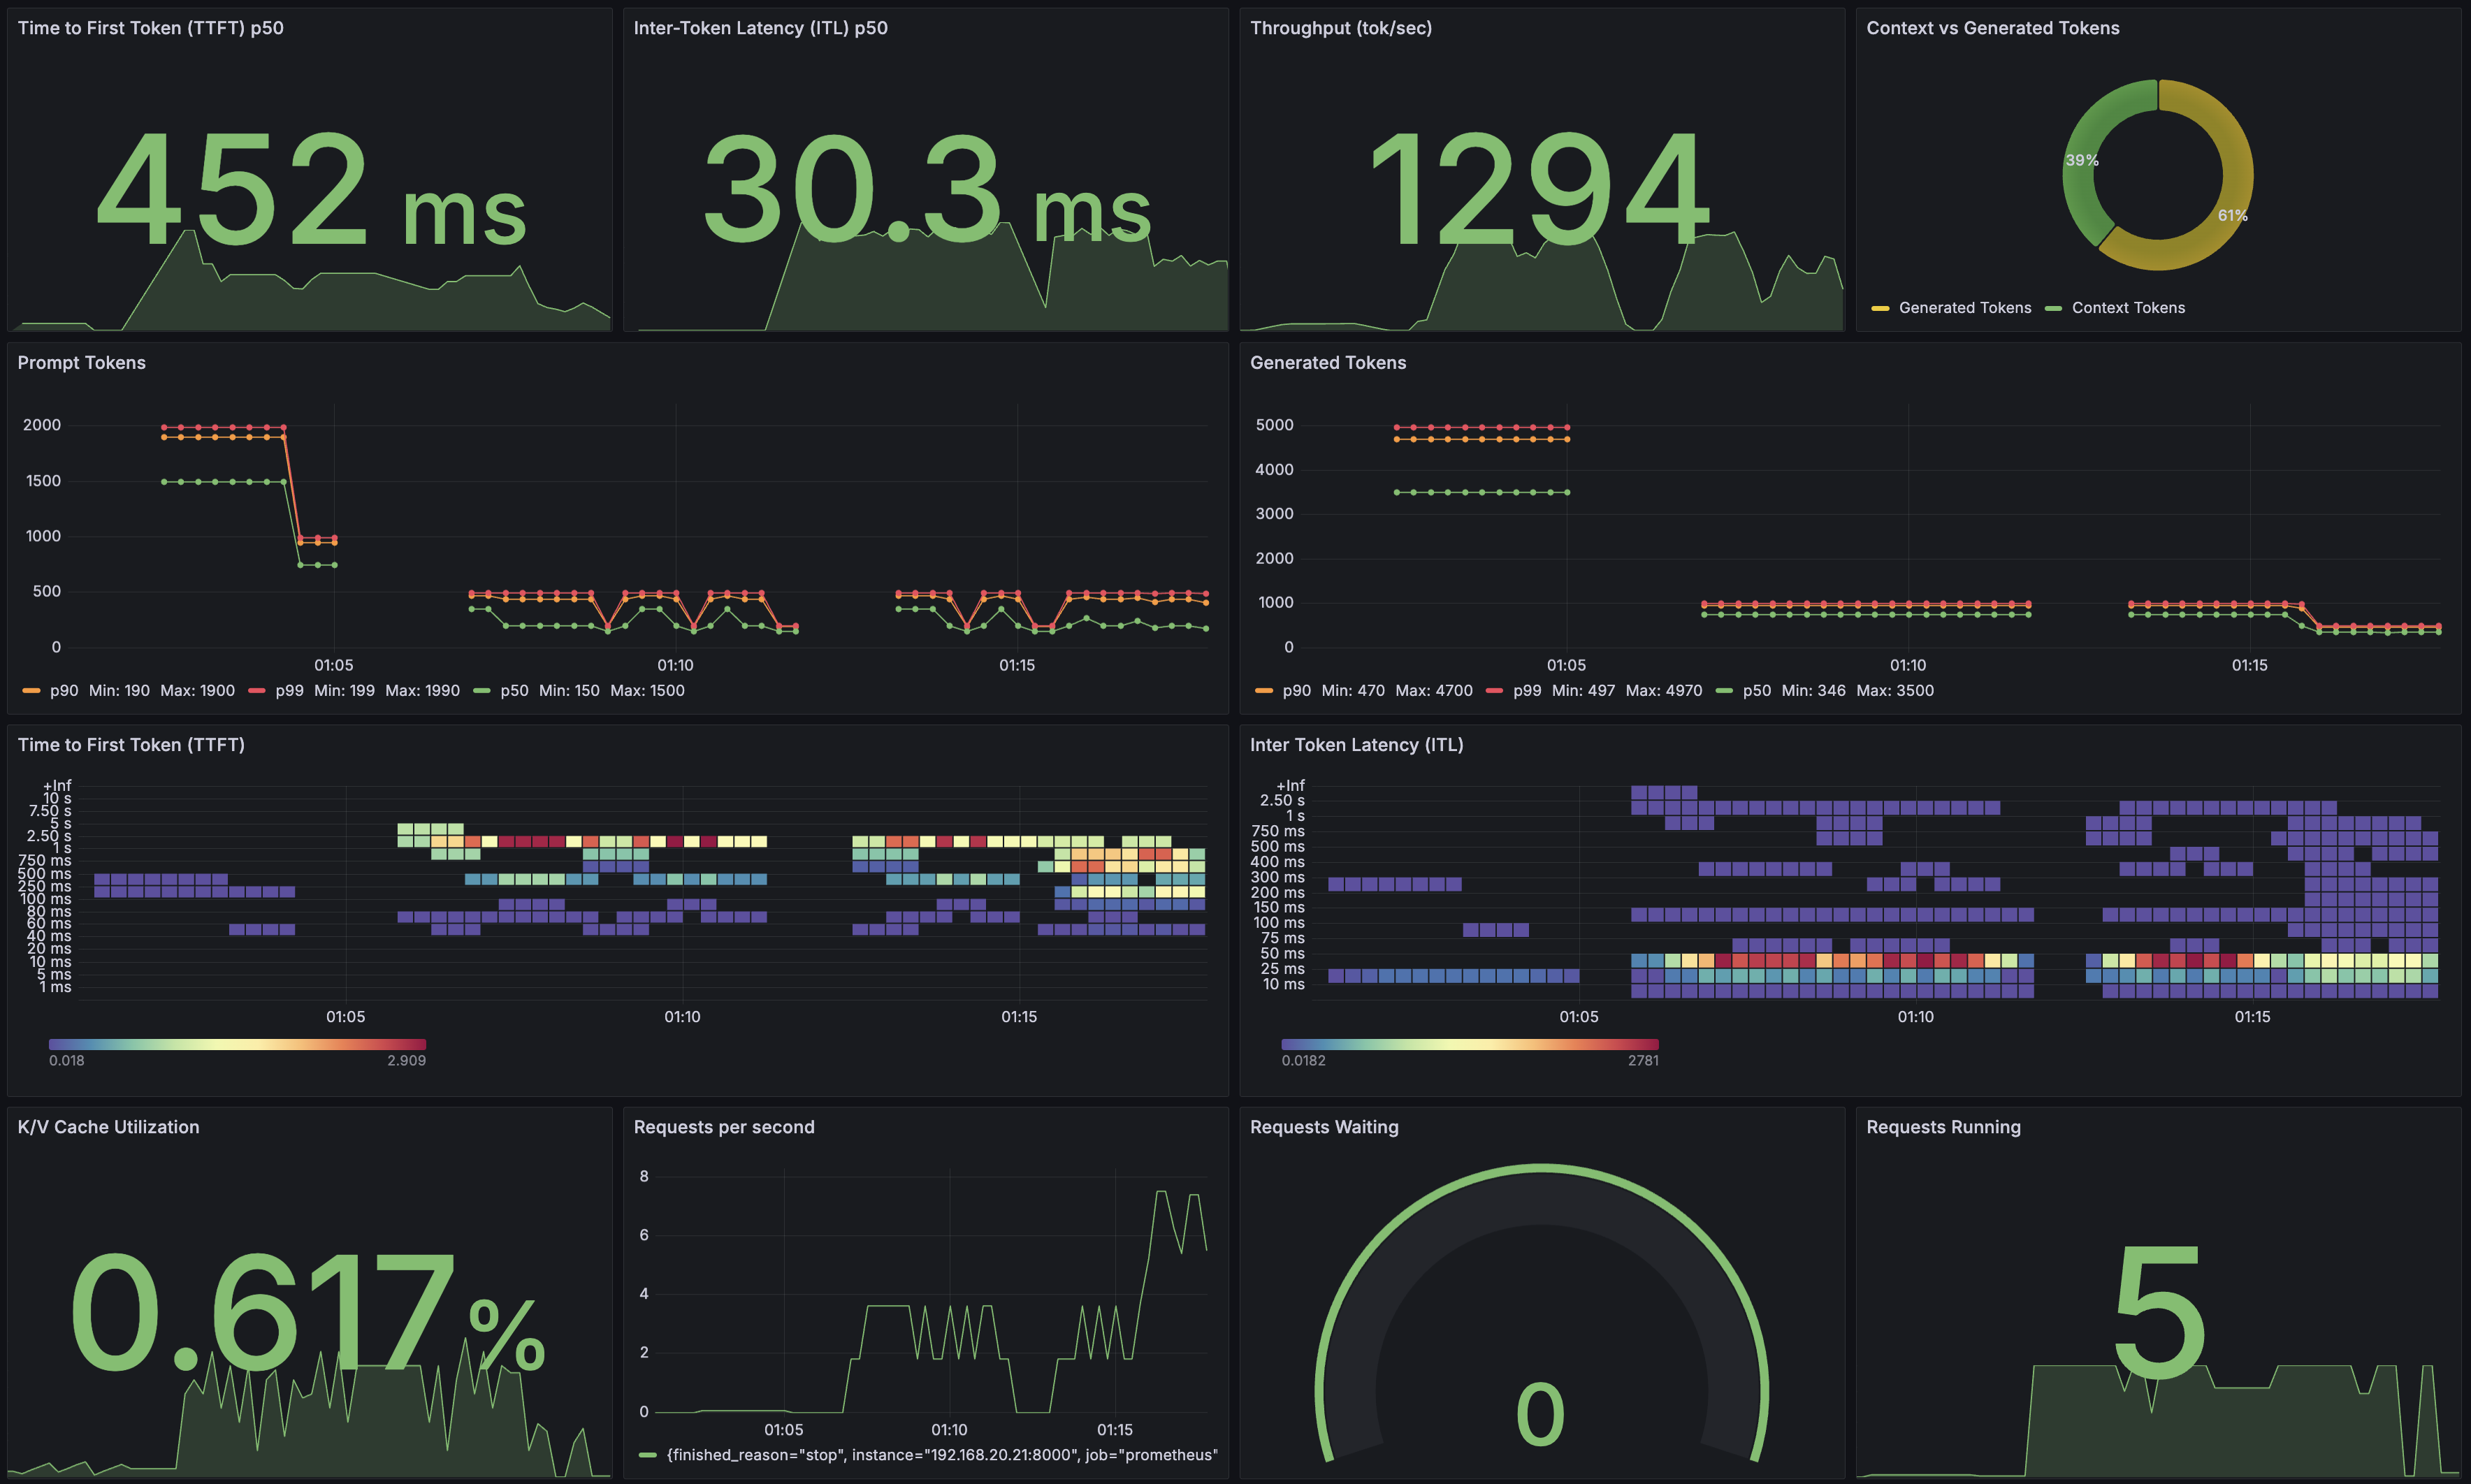
NIM provides Prometheus metrics indicating request statistics. You can use these metrics to create Grafana dashboards. By default, metrics are available at http://localhost:8000/v1/metrics.
The following table describes the available metrics.
Category |
Metric |
Metric Name |
Description |
Granularity |
Frequency |
|---|---|---|---|---|---|
KV Cache Count |
GPU Cache Usage |
gpu_cache_usage_perc |
GPU KV-cache usage. 1 means 100 percent usage |
Per model |
Per iteration |
Running Count |
num_requests_running |
Number of requests currently running on GPU |
Per model |
Per iteration |
|
Waiting Count |
num_requests_waiting |
Number of requests waiting to be processed |
Per model |
Per iteration |
|
Max Request Count |
num_request_max |
Max number of concurrently running requests |
Per model |
Per iteration |
|
Total Prompt Token Count |
prompt_tokens_total |
Number of prefill tokens processed |
Per model |
Per iteration |
|
Total Generation Token Count |
generation_tokens_total |
Number of generation tokens processed |
Per model |
Per iteration |
|
Latency |
Time to First Token |
time_to_first_token_seconds |
Histogram of time to first token in seconds |
Per model |
Per request |
Time per Output Token |
time_per_output_token_seconds |
Histogram of time per output token in seconds |
Per model |
Per request |
|
End to End Request Latency |
e2e_request_latency_seconds |
Histogram of end to end request latency in seconds |
Per model |
Per request |
|
Vision Encoder Latency |
vision_encoder_latency_seconds |
Histogram of vision encoder latency in seconds |
Per model |
Per request |
|
Count |
Prompt Token Count |
request_prompt_tokens |
Histogram of number of prefill tokens processed |
Per model |
Per request |
Generation Token Count |
request_generation_tokens |
Histogram of number of generation tokens processed |
Per model |
Per request |
|
Finished Request Count |
request_success_total |
Number of finished requests, with label indicating finish reason |
Per model |
Per request |
|
Image Count |
request_image_count |
Histogram of the number of images per request |
Per model |
Per request |
Prometheus#
To install Prometheus for scraping metrics from NIM, download the latest Prometheus version appropriate for your system.
wget https://github.com/prometheus/prometheus/releases/download/v2.52.0/prometheus-2.52.0.linux-amd64.tar.gz
tar -xvzf prometheus-2.52.0.linux-amd64.tar.gz
cd prometheus-2.52.0.linux-amd64/
Edit the Prometheus configuration file to scrape from the NIM endpoint. Make sure the targets field point to localhost:8000
vi prometheus.yml
# A scrape configuration containing exactly one endpoint to scrape:
# Here it's Prometheus itself.
scrape_configs:
  # The job name is added as a label `job=<job_name>` to any timeseries scraped from this config.
  - job_name: "prometheus"

    # metrics_path set to '/v1/metrics'
    metrics_path: '/v1/metrics'
    # scheme defaults to 'http'.

    static_configs:
      - targets: ["localhost:8000"]
Next run Prometheus server ./prometheus --config.file=./prometheus.yml
Use a browser to check that the NIM target was detected by Prometheus server http://localhost:9090/targets?search=. You can also click on the NIM target url link to explore generated metrics.
Grafana#
We can use Grafana for dashborading NIM metrics. Install the latest Grafana version appropriate for your system.
wget https://dl.grafana.com/oss/release/grafana-11.0.0.linux-amd64.tar.gz
tar -zxvf grafana-11.0.0.linux-amd64.tar.gz
Run the Grafana server
cd grafana-v11.0.0/
./bin/grafana-server
To access the Grafana dashboard, point your browser to http://localhost:3000. You will need to log in using the defaults.
username: admin
password: admin
The first step is to configure the source from which Grafana can scrape metrics. Click on the “Data Source” button, select Prometheus, and specify the Prometheus URL localhost:9090. After saving the configuration, you should see a success message. Now you are ready to create a dashboard with metrics from NIM, or you can try this example dashboard.
