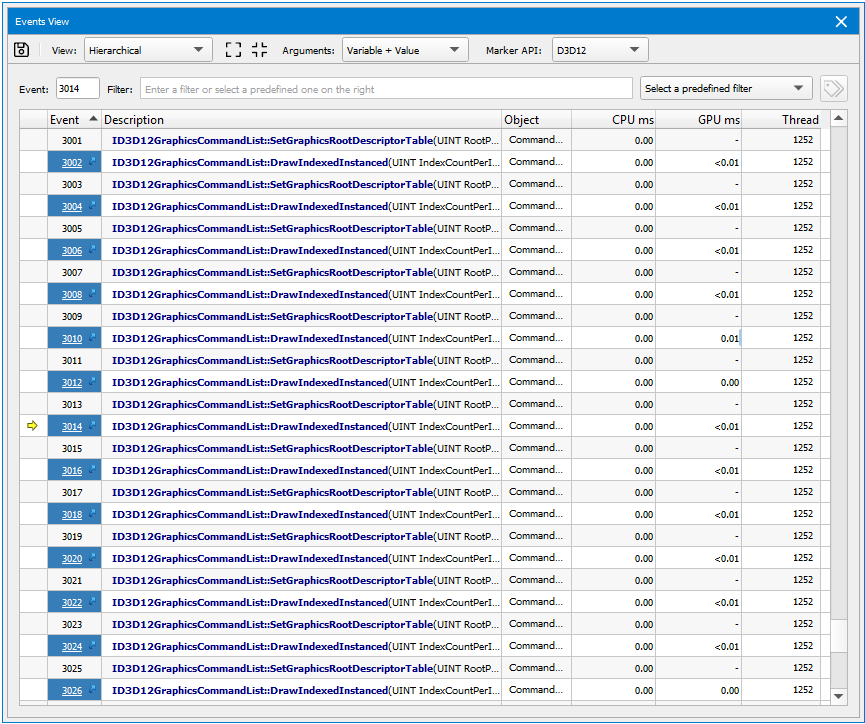
Event List
The Events view shows all API calls in a captured frame. It also displays both CPU and GPU activity, as a measurement of how much each call "cost."
To access the Events view, go to Frame Debugger > Events.
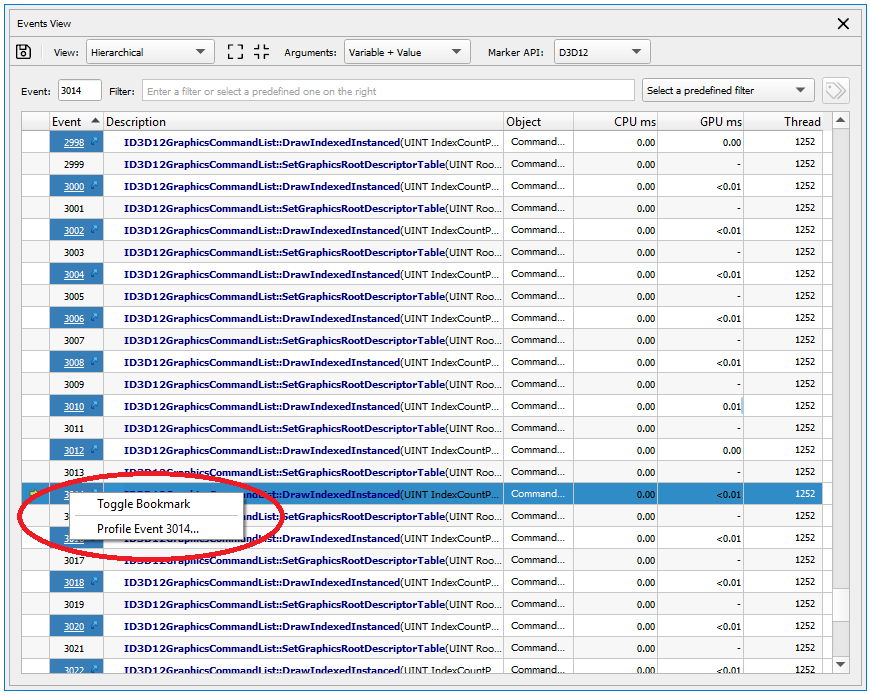
Clicking a hyperlink in the Events column will bring you to the API Inspector page for that draw call.
Right-clicking on an event or a push/pop range in the Events column will allow you to profile that specific event or range with the Range Profiler.
You can select whether to view the events in a hierarchical or flat view. If multiple performance marker types are used, you can select the correct one, as well as varying levels of verbosity for the call display (variable + value, value, or none). You can also sort the events by clicking on any of the available column headers.
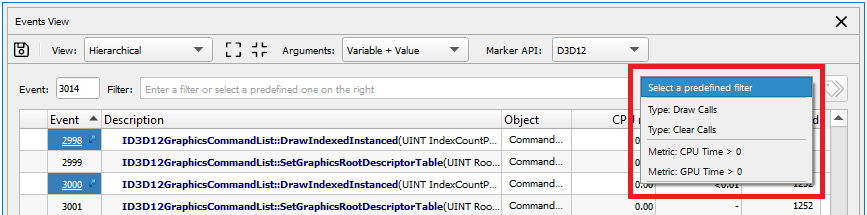
Filtering Events
There are two different ways to filter the events list.
- You can select one of the available predefined filters.
- You can type in your own filter, which will narrow the list of events to those containing your search string. This filter may be plain text, a regular expression, or a JavaScript expression that does column-specific searches. Select a predefined filter to see examples of JavaScript expressions.
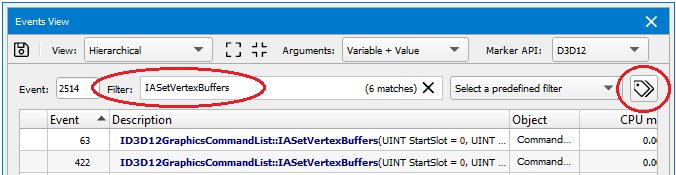
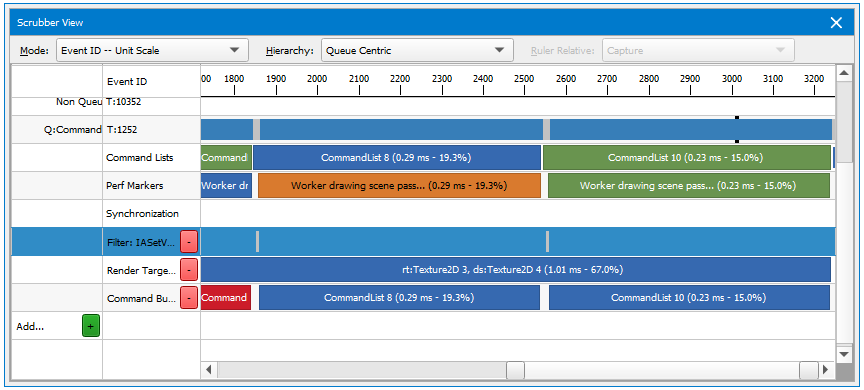
From the results, you can select the button to the right of the filter toolbar, and a new row will appear in the Scrubber that displays your filtered events.

NVIDIA® Nsight Graphics Documentation Rev. 2018.4.180813 ©2018. NVIDIA Corporation. All Rights Reserved.