Scrubber
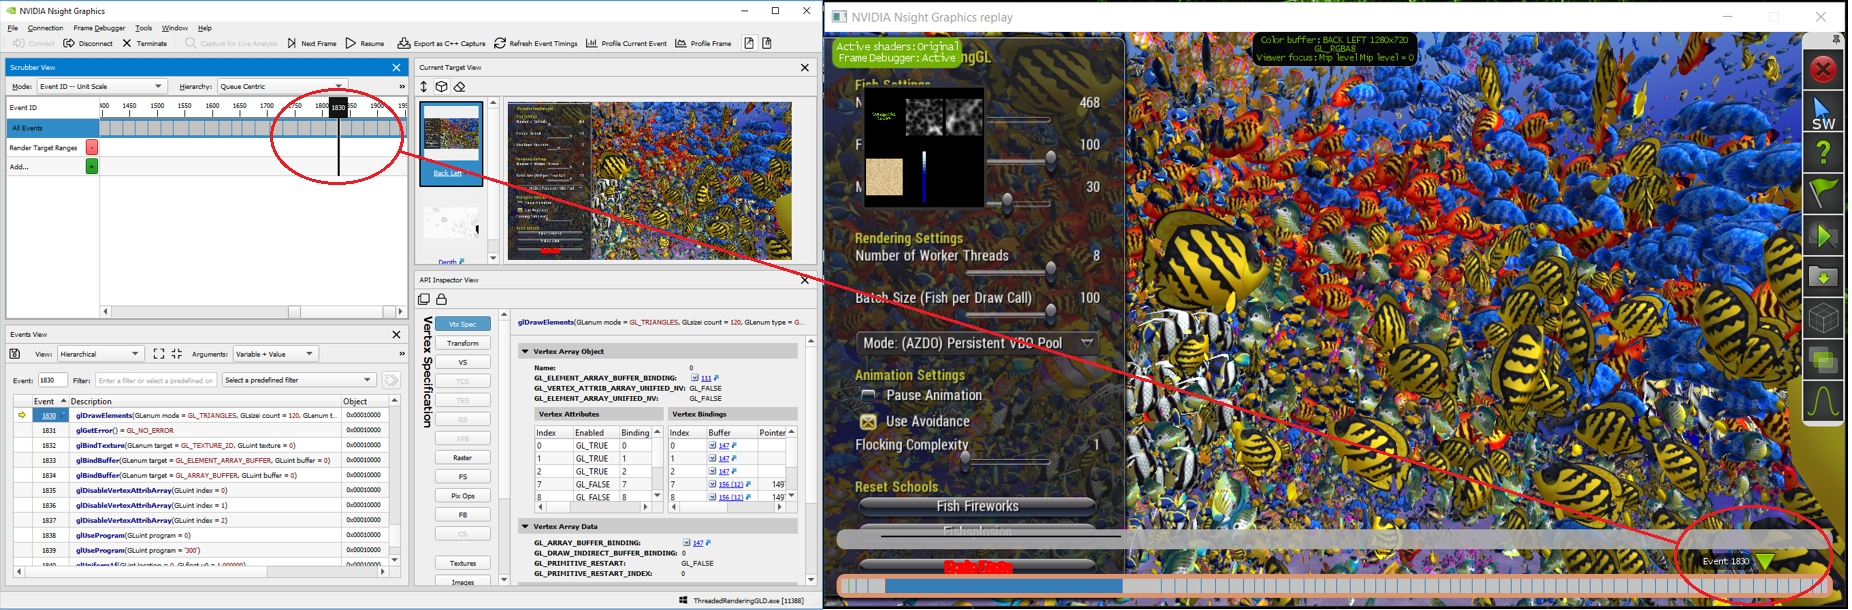
The NVIDIA Nsight Graphics Frame Debugger has two parts. One part appears as the Frame Debugger window on the host. The other part appears as a Heads-Up Display (HUD) on the target application.
The part of the Frame Debugger that appears as a HUD on the target machine is comprised of the following:
- HUD Toolbar — controls the frame capture, along with a number of other options (help, etc.).
- Frame Scrubber — indicates the current draw event. There is a scrubber view in the Frame Debugger on the host, as well as a frame scrubber on the HUD. The frame scrubber controls stay in synch with each other, meaning that when you move the controls on one, it affects the other. For example, if you move the frame scrubber on the HUD to highlight a new draw event, the scrubber on the Frame Debugger moves in synch to do likewise.
Understanding the Frame Scrubber
For the sake of discussion when it comes to graphics debugging, it helps to note some common terminology.
- An event is a single call to the API. It could be a triangle draw call, or backbuffer clear, or a less obvious call, like configuring buffers. A snapshot is a sequence of events.
- An action is a subset of the event types. It can be one of the following: (1) Draw Call, (2) Clear, or (3) Dispatch. Actions are interesting since they explicitly change data which may result in visual changes.

NOTE for Direct3D frame debugging: The Direct3D runtime documentation states that, "the return values of AddRef & Release may be unstable and should not be relied upon." The NVIDIA Nsight Graphics Frame Debugger will also take additional references on objects so any code that relies on an exact reference count at a particular time may fail. In general, users should not expect an exact reference count to be returned from the Direct3D runtime. For more information, see Microsoft's Rules for Managing Reference Counts.
The default view will show the events in your application, in addition to any performance markers you have defined. Clicking the Add... button will open a dialog that allows you to select what type of range you want to add.
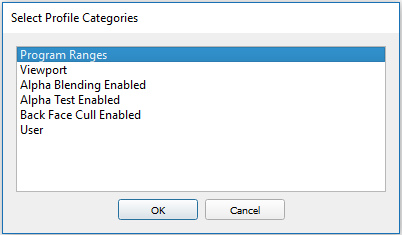
- Program Ranges — Actions that use the same shader program.
- Viewport — Actions that render to the same viewport rectangle.
- Alpha Blending Enabled — Actions that have alpha blending enabled.
- Alpha Test Enabled — Actions that have alpha test enabled.
- Back Face Cull Enabled — Actions that have back face cull enabled.
- User — A range defined by you on the fly. Use SHIFT + left-click and drag the scrubber on the created "User" row to create a new range.
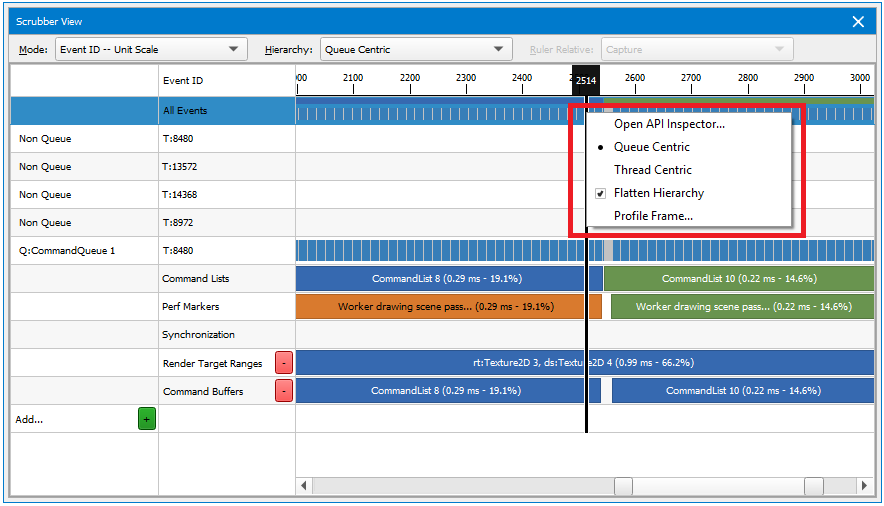
Right-clicking on a specific action in the Scrubber will allow you to open the API Inspector for that action, change your view settings, or initiate a profile session with the Range Profiler.
Scrubber View Options
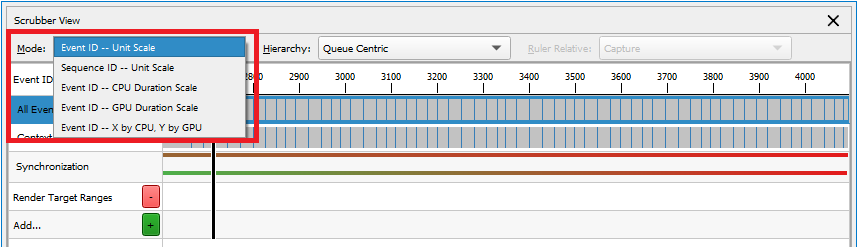
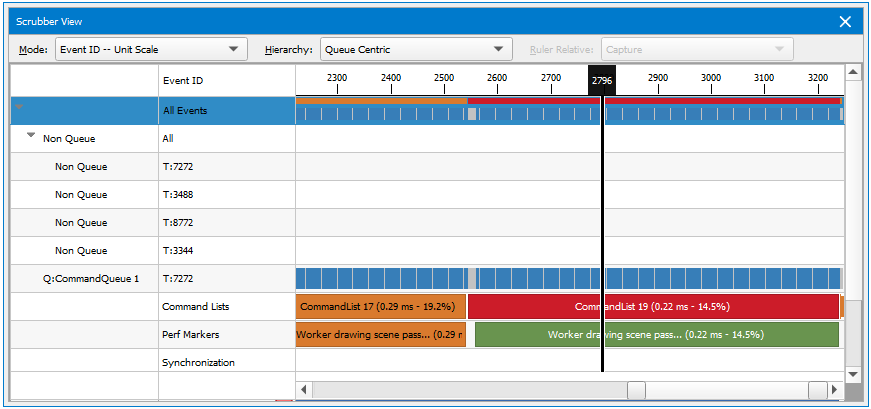
From the Mode drop-down menu, choose one of the following:
- Event ID -- Unit Scale is the default view, which simply shows the actions and events on the timeline.
- Sequence ID -- Unit Scale shows the sequence of events on the timeline.
- Event ID -- GPU Time Scale displays the GPU activity and how much each event or action cost the GPU.
- Event ID -- CPU Time Scale displays the CPU activity and how much each event or action cost the CPU.
- Event ID -- X by CPU, Y by GPU displays the CPU time scale on a horizontal X-axis, and the GPU time scale on a vertical Y-axis.
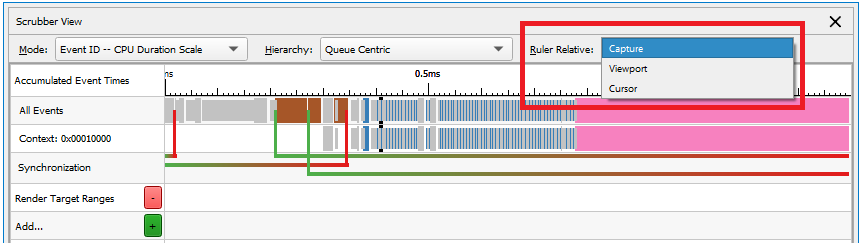
Depending on which mode you select, you can also select whether you want to view the ruler relative to the capture, viewport, or cursor.
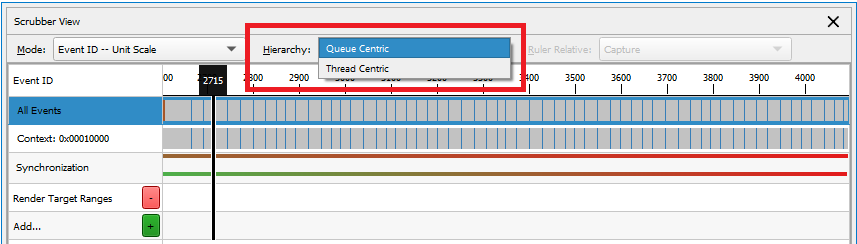
From the Hierarchy drop-down, Queue Centric sorts the events by queue, while Thread Centric sorts the events by the thread.
Using Hotkeys to Scrub Through a Frame
When the scrubber has focus, you can use the following hotkeys to move the scrubber cursor from one event to another.
HOTKEY ACTION Navigation CTRL + Home Go to the first event. CTRL + End Go the last event. CTRL + Left Arrow Go to the previous event. CTRL + Right Arrow Go to the next event. Up Arrow Expand the current event group (HUD only). Down Arrow Collapse the current event group (HUD only). F2 Current event: show less information (HUD only). F3 Current event: show more information (HUD only). Zooming and Panning CTRL + Scroll mouse wheel up, or
CTRL + NumPadPlus
Zoom in X-axis CTRL + Scroll mouse wheel down, or
CTRL + NumPadMinus
Zoom out X-axis CTRL + 0 Reset zoom CTRL + SHIFT + Scroll mouse wheel up Increase row height (all rows) CTRL + SHIFT + Scroll mouse wheel down Decrease row height (all rows) CTRL + Left mouse click and drag Pan ALT + mouse move View zoom window Cursor and Selection Left mouse click on desired cursor location Set cursor
(Places cursor at closest point to the start of a range.)Left mouse click on desired row
Select row
(The selected row is highlighted in orange.)SHIFT + Left mouse click and drag Make range selection Left mouse click on selection Zoom to range Left double-click on event action, or
Right-click menu, Open API Inspector
Open API Inspector Right-click menu, Run Range Profiler Run Range Profiler CTRL + A Select all events
For the purpose of moving the scrubber cursor, the following are considered action events:
- Draw methods
- Clear methods
- Dispatch methods
- Present methods
For example, if you are looking for the next draw method that was called, you can press the CTRL + RIGHT ARROW on the keyboard to skip over events that are not typically of interest, and only stop on events that are considered action events.

NVIDIA® Nsight Graphics Documentation Rev. 2018.4.180813 ©2018. NVIDIA Corporation. All Rights Reserved.