Performance Markers
The NVIDIA Nsight Graphics Frame Debugger shows a graphic representation of Performance Markers (or perf markers) that you have used to instrument your code.
Performance markers are most commonly used to delineate sections of events and note where in your application they begin and end. They can also be nested to show sub-sections of events. Perf markers are generally used to measure the amount of time that an inner portion of algorithm will take.
There are three different types of perf markers that are supported in NVIDIA Nsight Graphics:
- Direct3D11.1 and higher applications support
ID3DUserDefinedAnnotation. (For more information, see ID3DUserDefinedAnnotation interface on MSDN.) - OpenGL applications use the
KHR_debuggroup,glPushDebugGroupandglPopDebugGroup. - NVTX tools extension.
When you debug your graphics project, the Scrubber window shows the perf markers you implemented. When working with user-defined markers, the Scrubber window will use the color and label that you defined for the perf marker.
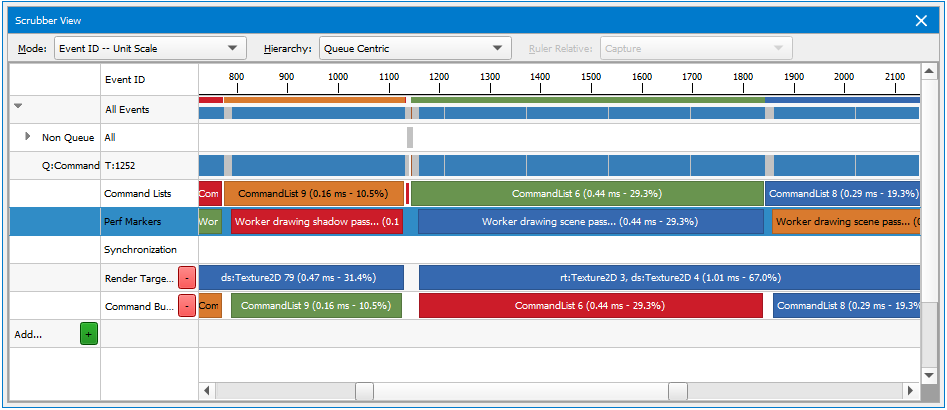
On the Scrubber, you can select one performance marker and it will automatically create a range of all of the draw calls that occurred within that time frame. Clicking on it again will cause the scrubber to automatically zoom to that range of events. You can zoom in on a nested/child marker the same way.
To zoom out, click the parent performance marker, or use CTRL + mouse wheel.
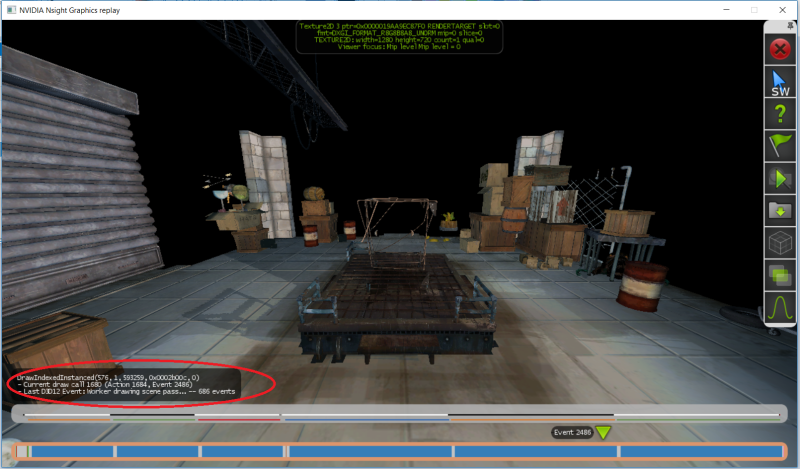
Performance markers are also displayed on the HUD, color-coded the same way that they are on the Scrubber. However, on the HUD, the information is condensed, and you must hover your mouse over the selected performance marker to get its details.
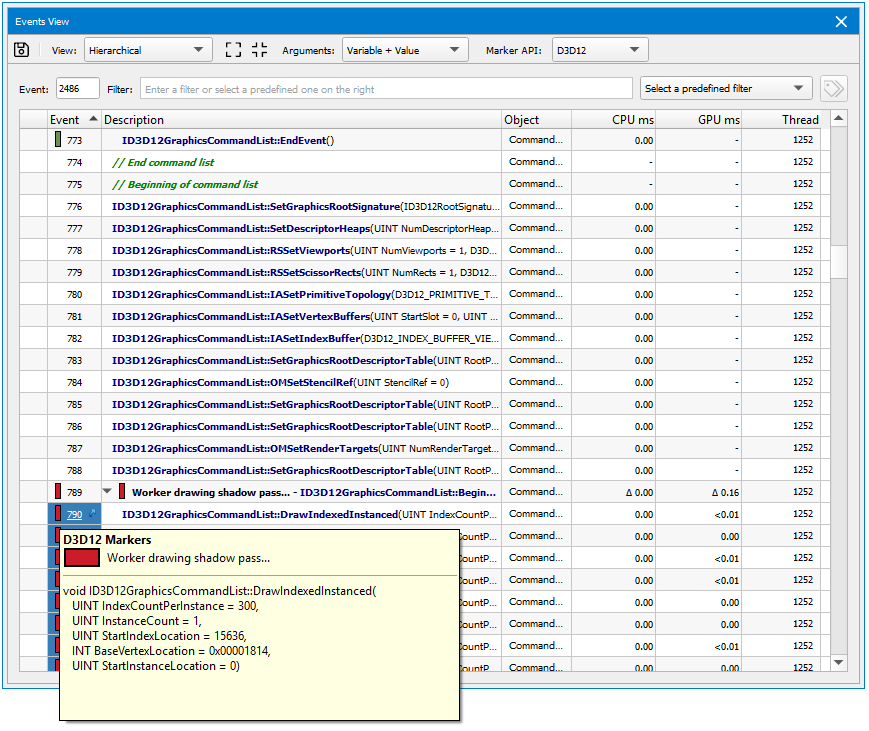
On the Events page, you can use the hierarchical view to see a tree view of perf markers. The items listed in the drop-downs correspond with the nested child perf markers on the Scrubber.
If you use the flat view on the Events page, the perf marker won't be nested, but you can hover your mouse over the color-coded field in the far left column, which allows you to view the details about that perf marker.
For more information on how to implement perf markers in your application, see the Microsoft MSDN documentation on Direct3D performance markers, such as: Accurately Profiling Direct3D API Calls.

NVIDIA® Nsight Graphics Documentation Rev. 2018.4.180813 ©2018. NVIDIA Corporation. All Rights Reserved.