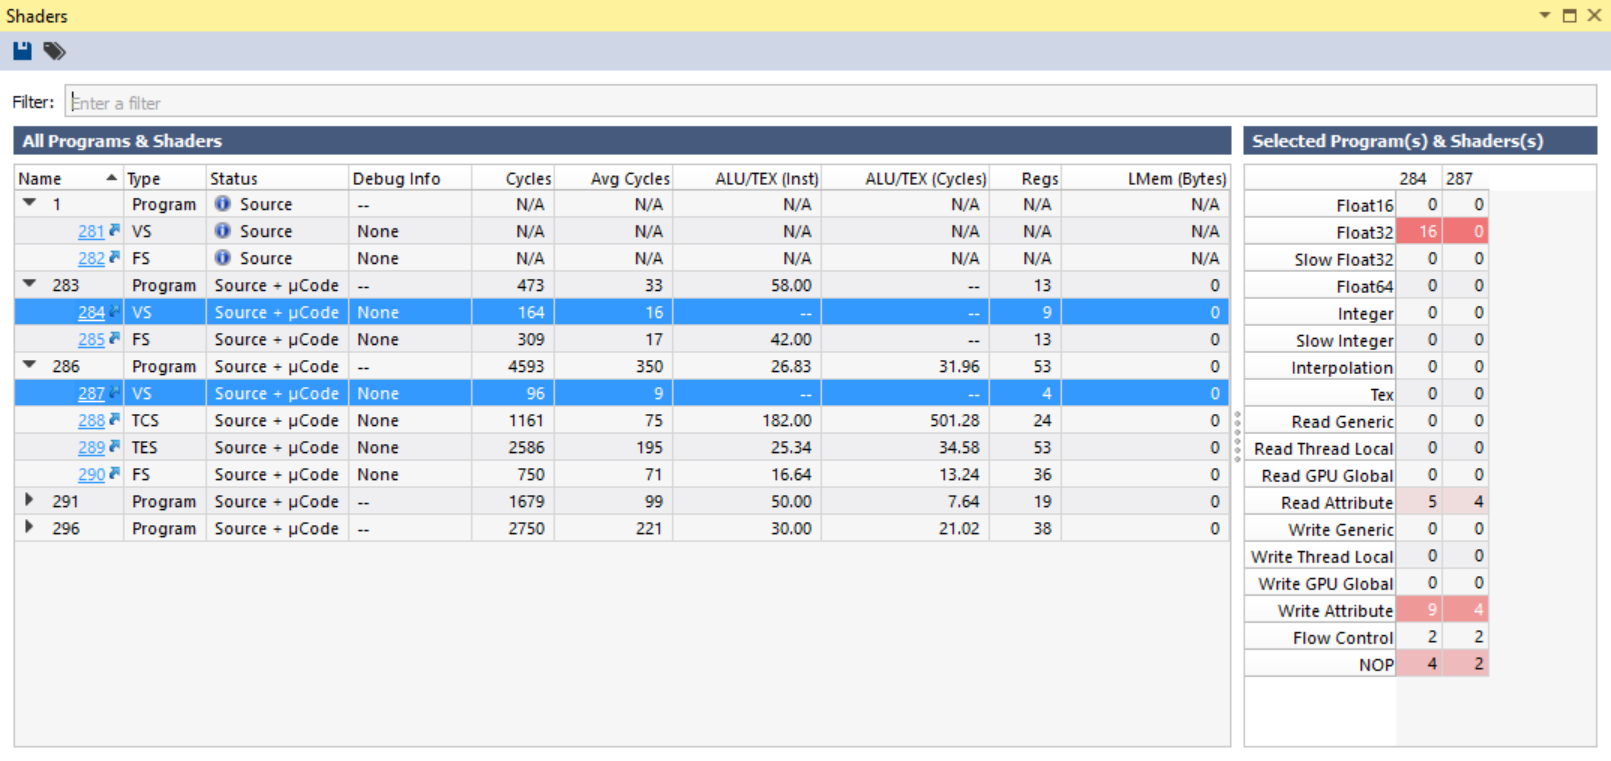
Shaders View
The Shaders View lists all of the shaders in your application.
- If the shader (or its parent program or pipeline object) hasn’t been used by the application yet, it will show up with the
 symbol in the Status column.
 - If the shader has been used, but the statistics are being calculated, the
 symbol will be displayed in the Status column.
For programs or pipeline objects, you can view the individual shaders by pressing the ► button to the left of the program/pipeline name. The list also contains a number of statistics:
Name
This is the name of the shader. This name is either generated internally, or can be assigned by the user per API.
Status
This column displays the current status of the shader. The status includes Source or Binary, to denote whether or not source code is available for this shader. Also, if the µCode text is included, this means that we have driver level binary code that is necessary for gathering shader performance metrics.
The symbol means that we are waiting for the shader to be bound by the application.
The symbol means that shader performance metrics are currently being computed.
Cycles
This value is the absolute cost for a single primitive (vertex, tessellation control point, fragment, etc.) to execute through the shader. The value takes into account latency for memory accesses, but it does not take branching or loops into account. The values are summed up at the program level to show the absolute cycle count for a single fragment to be rendered on the screen.
Avg Cycles
Since primitives are submitted in large groups, this gives an average cycle cost for a single primitive, assuming it is submitted as a larger block of work (for instance, many fragments from the same object with the shame shader). The values are summed up at the program level.
ALU/TEX Inst Ratio
This gives the ratio of ALU to texture instructions for the shader. The values are averaged at the program level.
ALU/TEX Cycle Ratio
Since not all ALU calls are the same cost in terms of cycles, this value gives the ratio of cycles spent in ALU versus texture instructions. The values are averaged at the program level.
Regs
This column gives the number of registers used by the program. Register count impacts occupancy/threads in flight so if the value gets too high you will get closer to the Cycles value than the Avg Cycles value.
LMem (Bytes)
This is the number of bytes of local memory used by the shader. Similar to registers, this can impact occupancy and contribute to a lower overall throughput of primitives running this shader.

NOTE: Shader µCode, and thus shader performance metrics are only supported for Direct3D 11, Direct3D 12, and OpenGL. Vulkan support will be added in a future release.
Selected Program(s) & Shader(s)
This pane will show extended shader performance information about the currently selected shader. If multiple shaders are selected, then you can view and compare the statistics between the selected shaders.

NVIDIA® Nsight Graphics Documentation Rev. 2018.4.180813 ©2018. NVIDIA Corporation. All Rights Reserved.