Open topic with navigation
With NVIDIA Nsight 3.2, it is possible to attach the Visual Studio debugger to a free-running CUDA application. This feature requires some one-time setup and setting additional environment variables when you launch programs that you wish to debug. The required steps are outlined below.
One-Time Setup
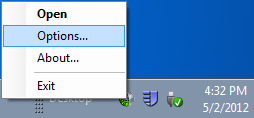
- On the target machine (either local or remote, depending on your configuration), right-click on the Nsight Monitor icon on the taskbar and select Options.
- Select the CUDA tab.
- For the option Use this Monitor for CUDA attach, click the drop-down menu and select True. If this setting is not enabled, you will get a warning message in the attach dialog on the host machine.
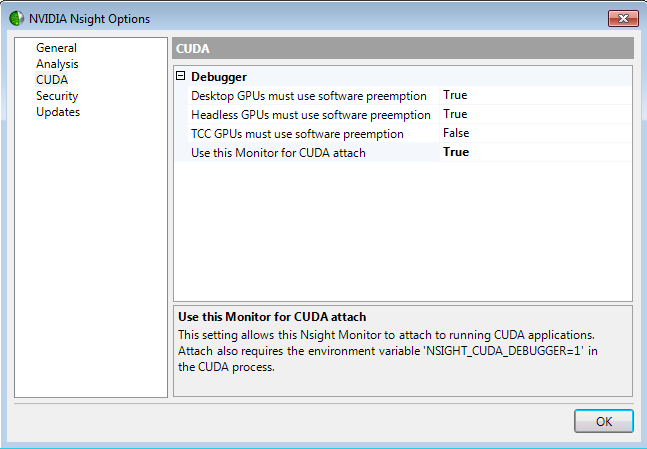
This setting is required to allow the Nsight Monitor to attach to free-running CUDA applications. It only needs to be configured one time after installing NVIDIA Nsight.
When Launching Your Application
To make a process CUDA-attachable, you must set the environment variable NSIGHT_CUDA_DEBUGGER=1. The strict requirement is that the environment variable must be set before the application calls cuInit(). If the application uses the CUDA Runtime API, the environment variable must be set before the first CUDA Runtime API call is made.
Since environment variables are typically inherited by child processes, setting NSIGHT_CUDA_DEBUGGER=1 in a parent process that launches child processes will usually make the child processes CUDA-debuggable as well. Launcher processes and cluster nodes can benefit from this.
Setting NSIGHT_CUDA_DEBUGGER=1 can degrade the performance of an application, since the debugger is made resident. The effect is minimal on Tesla™ devices and headless devices; it is most severe on display devices with a desktop, where the debugger by necessity may need to serialize launches that would otherwise have been asynchronous. Therefore, it’s not always desirable to set NSIGHT_CUDA_DEBUGGER=1 at a system-wide or user-wide level.
Attaching to a CUDA Application in Visual Studio
- On the host machine, open your project in Visual Studio.
- This process will also work without a project. However, in that case, Visual Studio will not remember any breakpoints that are set.
- To resolve and hit source breakpoints, the debugger requires the absolute paths of source files to match those in the debug symbols built into the application.
Note that if the project hits breakpoints when it is launched via the Nsight > Start CUDA Debugging command, then it will also work with attach.
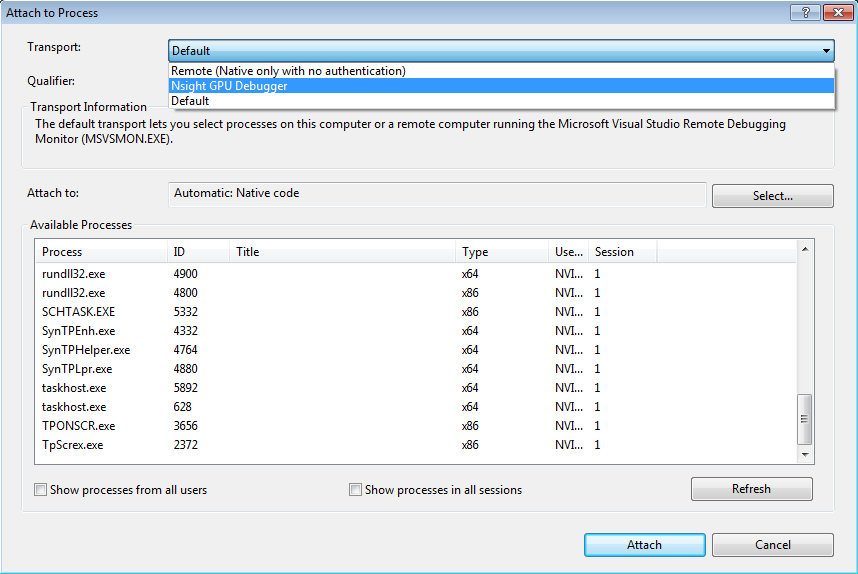
- Go to Debug > Attach to Process. (Or as an alternative, go to the Tools menu, and select Attach to Process.)
This will open the Attach to Process dialog box.
- Click the drop-down menu next to the Transport field, and choose Nsight GPU Debugger.
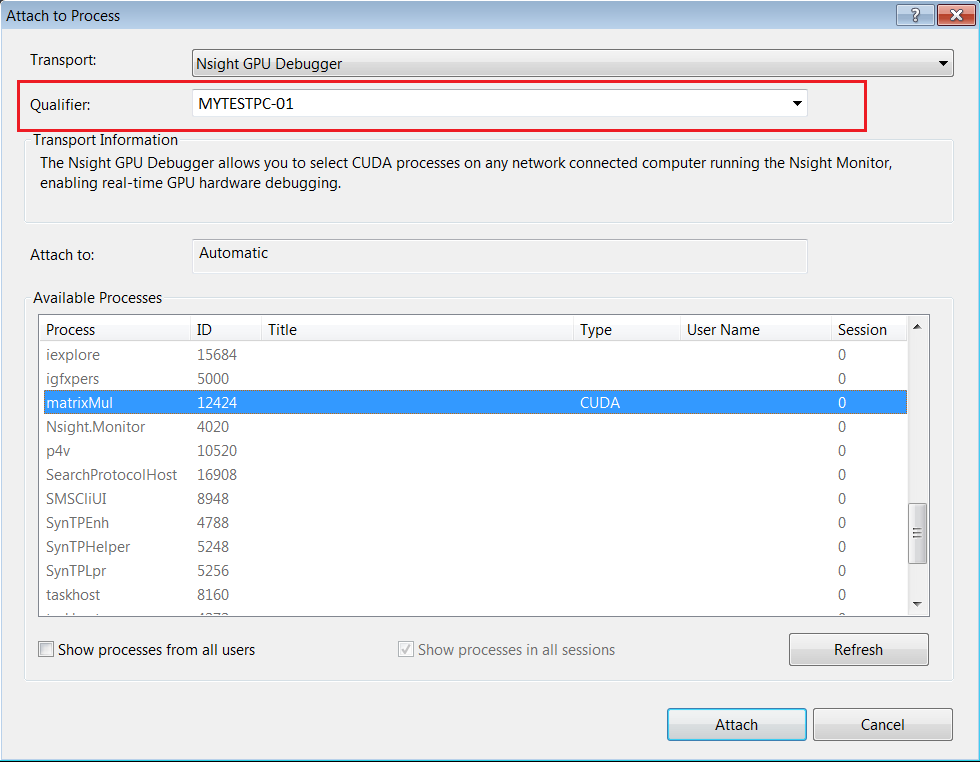
- Ensure that your host machine name is listed in the Qualifier field.
Note that this field is blank by default; you will have to manually select your machine name the first time this dialog is opened.
- When you enter your computer's hostname in the Qualifier field, a list of available processes will appear in the dialog box.
- If a process is grayed out and CUDA is not listed in the Type column, then it cannot be debugged with the CUDA Debugger. Usually this occurs because the
NSIGHT_CUDA_DEBUGGER environment variable is not set in that process. - If a process is grayed out and CUDA is listed in the Type column, then a CUDA Debugger is already attached. In this case, it cannot be attached to again.
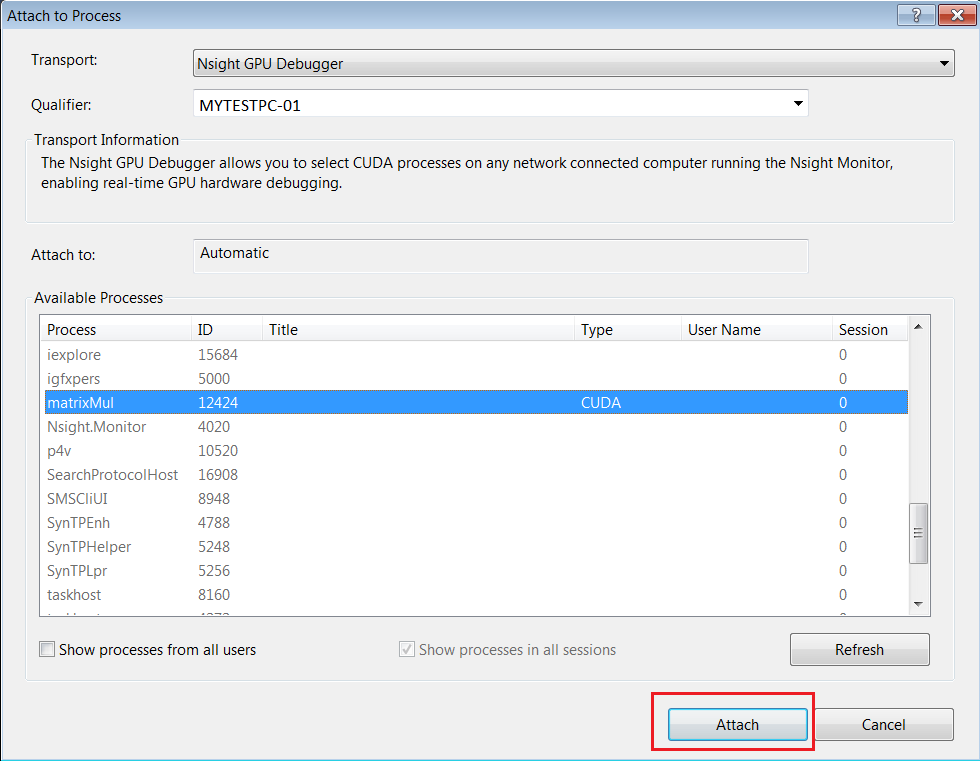
- Processes that may be attached will appear normally, and the Attach button will be enabled.
- When you select the desired process and click Attach, a debug session will begin, exactly as if you had used the NVIDIA Nsight menu in Visual Studio (Nsight > Start CUDA Debugging).
To end, choose Debug > Stop Debugging. Note that this will terminate the application.
Attaching to CUDA in the Middle of a Kernel Launch
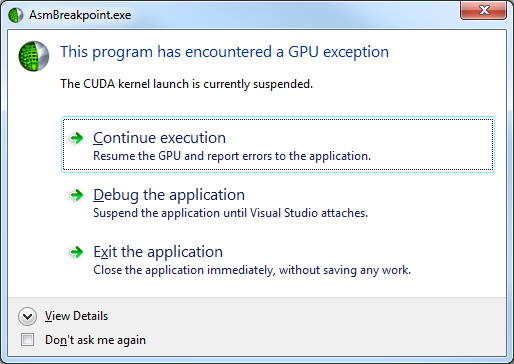
The following dialog is shown when an attachable process hits a GPU exception. A GPU exception can be an MMU fault, inline breakpoint (asm("brkpt;"); in CUDA C), or other abnormal condition.
For safety reasons, the dialog will not be shown if any desktop GPUs are currently debugging in hardware mode, and the GPU will automatically resume. While detailed GPU inspection requires an attached Visual Studio instance, the dialog displays the faulting device name, CUcontext, kernel (mangled name), and the reason for the exception:
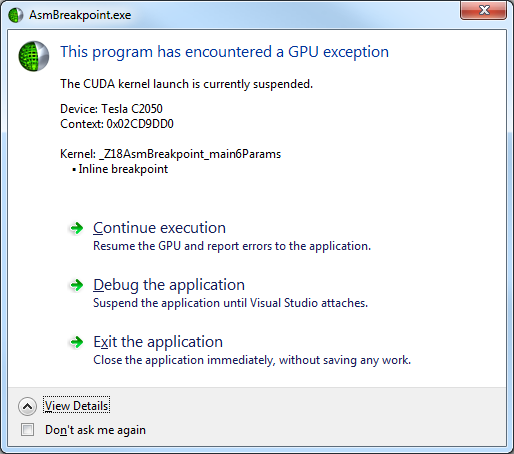
The following options are available:
- Continue execution: This closes the dialog and resumes the GPU and application execution. This operation is equivalent to the Debug > Continue command in Visual Studio. The dialog will reappear upon the next GPU exception. If the "Don’t ask me again" box is checked, the program will instead automatically continue instead of showing this dialog again. This setting is not saved across program runs.
- Debug the application: This pauses the program while the user attaches the CUDA debugger:
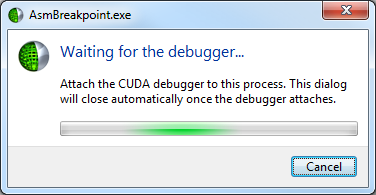
Canceling or closing this new dialog returns to the original dialog. The dialog automatically closes and reports the exception when the CUDA debugger attaches.
- Exit the application: Terminates the program.
Closing the dialog is equivalent to selecting "Exit the application."
NVIDIA® Nsight™ Development Platform, Visual Studio Edition User Guide Rev. 3.2.131009 ©2009-2013. NVIDIA Corporation. All Rights Reserved.
Open topic with navigation