|
Note: Using Step Into causes the debugger to execute the next instruction of the currently selected thread. Stepping occurs on the current focus thread. Other warps are frozen while this is happening, unless stepping a barrier. |
NVIDIA® Nsight™ Development Platform, Visual Studio Edition 3.2 User Guide
Send Feedback
The CUDA Debugger allows you to control the execution of your CUDA program during the debugging session. The CUDA Debugger supports stepping into a line of code, and running the program to the cursor.
In order to use any of the below features, the debugged CUDA program must be halted as a result of stopping at a breakpoint or from a previous execution control statement.
When stepping, all warps except the debugger focus warp are frozen. However, when stepping over __syncthreads(), all warps in the current block are allowed to make progress. This allows the focus warp to get past the __syncthreads() function.
Stepping out of a global function will resume the application (same result as pressing F5, or selecting the menu command Debug > Continue).
Stepping over the last line of a kernel function will also resume application execution.
Stepping over the last line of an inline function has the same result as stepping out of the inline function.
To experience the best stepping behavior when debugging, we recommend using curly braces when possible in your code. Place the curly braces on their own line of source code. For example, because of the way that the compiler produces scope information, the following coding styles result in different stepping behavior.
These code snippets results in less than optimal stepping behavior:
     for () statement;
     for ()
        statement;
     for () {
        statement;
     }
This code snippet results in optimal stepping behavior:
     for ()
     {
        statement;
     }
In general, breaking up computation by declaring temporary variables results in code that is easier to debug. The chances of a variable being "live" over a certain set of lines increases. This means that as you step through code, the values of variables will be easier to identify.
- Avoid killing the Debug Monitor when it is in use. If the Debug Monitor process is killed while an application is stopped at a CUDA breakpoint, you will not be able to kill the target process.
- Use a separate Visual Studio instance to debug the host portion of a target application. If you wish to debug the host portion of your CUDA application while the CUDA Debugger is attached, you must attach using a different Visual Studio instance. Attaching the same instance of Visual Studio as both host and GPU debugger will cause the debugger to hang.
|
|
Note: Using Step Into causes the debugger to execute the next instruction of the currently selected thread. Stepping occurs on the current focus thread. Other warps are frozen while this is happening, unless stepping a barrier. |
To run the target application up to the cursor location:
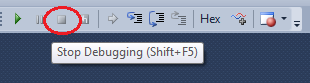
From the Debug menu, choose Stop Debugging.
Alternatively, you can also press the Stop icon on the debugger toolbar, or type SHIFT+F5.
The target application will now stop. Visual Studio stops the debugging session and returns to the edit layout.
NVIDIA® Nsight™ Development Platform, Visual Studio Edition User Guide Rev. 3.2.131009 ©2009-2013. NVIDIA Corporation. All Rights Reserved.