Graphics Debugger > Frame Debugger (Direct3D)

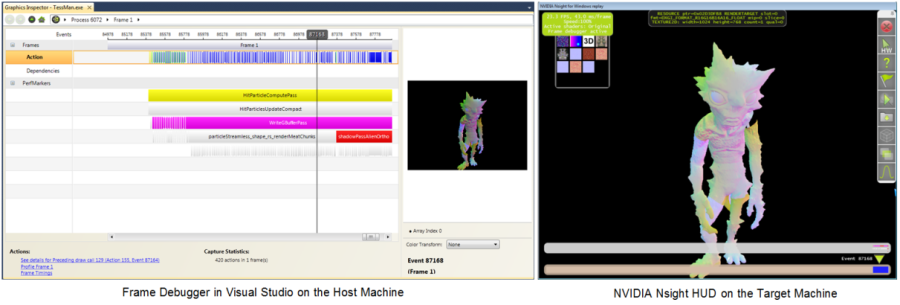
The NVIDIA Nsight Frame Debugger allows you to inspect render targets and textures, navigate through draw events, inspect pipeline states, monitor GPU and driver signals in real-time, and display performance markers for profiling.

The Frame Debugger includes a performance dashboard that shows as a heads-up-display (HUD) on the application being debugged. (If you used NVIDIA's PerfHUD software, this display will be familiar to you.)

To launch the Frame Debugger:

  1. Begin debugging your graphics project. To do so:
    1. Open your project in Visual Studio.
    2. Build the project.
    3. Make sure the Nsight Monitor is running on the target machine (the target machine can be either the localhost or a remote machine).
      For more information on configuring your target and host machines, see Target and Host Setup.
    4. From the Nsight menu, select Start Graphics Debugging. Your target application launches. (Wait for the target application to load and start. The target application must be running before you can start using the Frame Debugger.)
  2. From the Nsight menu, select Pause and Capture Frame. In Visual Studio, the Frame Debugger page opens. On the target application, the HUD toolbar and HUD itself appear.


NVIDIA® Nsight™ Development Platform, Visual Studio Edition User Guide Rev. 3.2.131009 ©2009-2013. NVIDIA Corporation. All Rights Reserved.

of