CUDA Debugger > How To > Launch the CUDA Debugger

Make sure that the modules you intend to debug are built with the compiler generating debug symbols. If a module has no symbols, then debugging is disabled for all functions in that module.

NOTE: You cannot debug CUDA code in a target process while simultaneously debugging the x86 code of the same process.

Use a separate Visual Studio instance to debug the host portion of a target application. If you wish to debug the host portion of your CUDA application while the CUDA Debugger is attached, you must attach using a different Visual Studio instance. Attaching the same instance of Visual Studio to debug both the host portion and the device portion of a target application will cause the debuggers to conflict. The result is that the target application and the CUDA Debugger hang while being blocked by operations of the native debugger.

Local Debugging

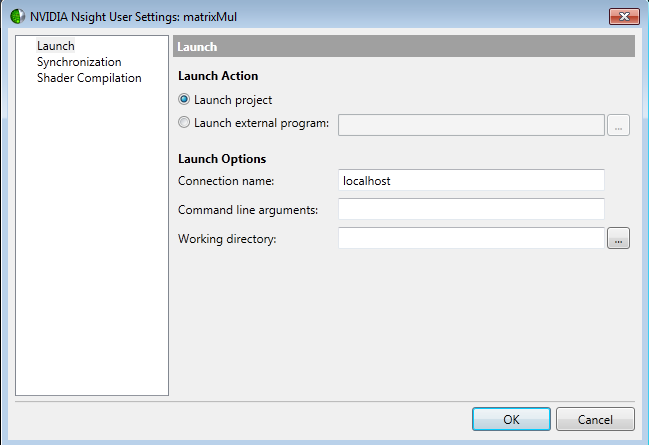
The NVIDIA Nsight tools support launching and debugging a program on a single system. Please see System Requirements for Nsight Software for more information. Please also refer to the Setup Local Debugging topic for configuring a debugging setup with multiple GPUs.

To configure a project for local debugging:
  1. Start Visual Studio.
  2. Open a CUDA-based project.
  3. Right-click on the project name in the Solution Explorer, and choose Nsight User Properties. (As an alternative, you can also go to the Project menu > Nsight User Properties.)


  4. In the Connection name text field, type: localhost.
  5. Click OK.

To start the CUDA Debugger locally:
  1. On the host machine, go to the Nsight menu in Visual Studio, choose Start CUDA Debugging.
    As an alternate option, you can also right-click on the project in Solution Explorer and choose Start CUDA Debugging.
  2. The CUDA Debugger launches the target application on the local machine. The CUDA Debugger communicates through port: 8000 by default, although this setting can be changed in the Nsight Monitor options. (See both Host Basics and Target Basics for more details on how to configure the default port settings.) You can use the CUDA Debugger to pause execution, step, and perform other debugger functions.

Remote Debugging

You can launch and debug a program on any properly configured remote host. Please see How To: Install the Nsight Monitor and Setup Remote Debugging for more information on how to install and configure the NVIDIA Nsight tools on your remote machine.

To configure a project for remote debugging:
  1. Start Visual Studio.
  2. Open a CUDA-based project.
  3. Right-click on the project name in the Solution Explorer, and choose Nsight User Properties. (As an alternative, you can also go to the Project menu > Nsight User Properties.)
  4. In the Connection name field, replace localhost with the name of your target machine (the remote computer where the application to be debugged will run).
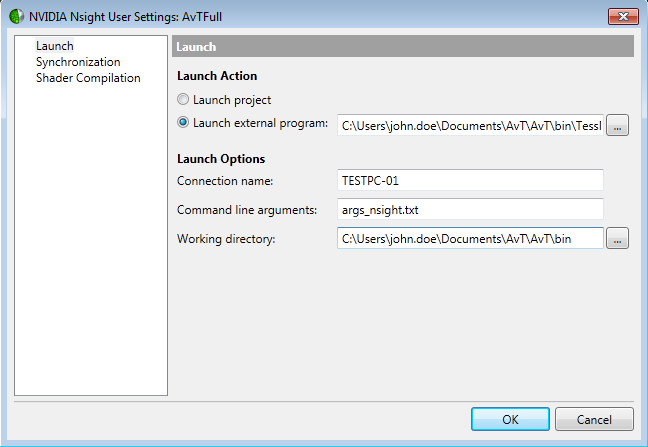
    This can be the IP address of the machine on your local network, or the machine name as recognized on your network.


    IMPORTANT: Do not use a mapped drive to specify the hostname. For example:

    WRONG: M:\

    CORRECT: jsmith.mydomain.com
  5. In the Working directory field, you can specify the directory you want the application to use.
    The default working directory is the project directory.
  6. Click OK button.
To start the CUDA Debugger remotely:
  1. Start the Nsight Monitor on the target machine (remote machine).
    1. From the Windows Start menu, select All Programs.
    2. Select NVIDIA Corporation > Nsight Visual Studio Edition 3.2 > Nsight Monitor.
  2. Optional: To abort the launch when a file fails to copy to the remote system, set the Abort on synchronize failure option to "True."
    1. From the Nsight menu select Nsight Options. The Nsight Options window opens.
    2. In the left hand pane, select Debugger.
    3. Under Launch section, set Abort on synchronize failure to True.
    4. Click OK button.
  3. On the host machine, from the Nsight menu in Visual Studio, choose Start CUDA Debugging.
    As an alternate option, you can also right-click on the project in Solution Explorer and choose Start CUDA Debugging.

    The host communicates with the Nsight Monitor on the remote machine, synchronizes the application files, and launches the application on the remote machine. The CUDA Debugger communicates through port: 8000 by default, although this setting can be changed in the Nsight Monitor options. (See both Host Basics and Target Basics for more details on how to configure the default port settings.) You can use the CUDA Debugger to pause execution, step, and perform other debugger functions.
  4. To cancel the debugging sessions while files are synchronizing, select Nsight > Cancel Debug Startup.

NOTE: You cannot simultaneously perform CUDA debugging and x86 debugging of the same process.


NVIDIA® Nsight™ Development Platform, Visual Studio Edition User Guide Rev. 3.2.131009 ©2009-2013. NVIDIA Corporation. All Rights Reserved.

of