
|
Note: If you set a breakpoint on an invalid source location (such as a comment line), the breakpoint will "jump" to the next available valid line of source code within a 10 line range. |
NVIDIA® Nsight™ Development Platform, Visual Studio Edition 3.2 User Guide
Send Feedback
You can use NVIDIA Nsight to set breakpoints in CUDA code. The development tools support two types of breakpoints: source breakpoints and data breakpoints.
Source breakpoints allow you to halt your application at the specified line of CUDA source code. You can also constrain your breakpoints to break only when a particular block and thread are executing. Constraining breakpoints to specific blocks and threads is a critical capability in a massively parallel environment where you can have hundreds or thousands of threads running simultaneously.
Data breakpoints halt your application's execution when the next executable line of code is going to write to a specified range of GPU memory.
You set and configure CUDA breakpoints with the same familiar dialog boxes, keyboard shortcuts, and tool windows used for other languages supported by Visual Studio.
NOTE: A breakpoint condition can be met multiple times by the same line of code when the line of code has an inline function call. For example, setting a breakpoint on:
x = cos() + sin()
CAUTION: If you are performing local debugging, make sure to disable WPF hardware acceleration before using the CUDA Debug Focus Picker dialog box. For more information about disabling WPF hardware acceleration, see Setup Local Debugging.
You can set breakpoints on any line of executable CUDA source code.
To set a breakpoint on a line of source code:
The color of the breakpoint glyph indicates the status of the breakpoint. A red filled glyph, for example, indicates a normal, enabled breakpoint. A white filled glyph indicates that the breakpoint is disabled. A + sign inside the breakpoint glyph indicates that the breakpoint has at least one advanced feature, such as condition, hit count, or filter, attached to it.
For more information on breakpoints, see the Visual Studio documentation from Microsoft: http://msdn.microsoft.com/en-us/library/5557y8b4.aspx
|
|
Note: If you set a breakpoint on an invalid source location (such as a comment line), the breakpoint will "jump" to the next available valid line of source code within a 10 line range. |
You can also set data breakpoints at any GPU memory address, which will halt your program just prior to writing data to that address.
Use the standard Visual Studio Breakpoints tool window to enable, disable, add and delete breakpoints.
|
|
Note: The debugger does not support the "Go To Assembly" Function in the Visual Studio Breakpoints tool window. |
In a massively parallel environment with hundreds or thousands of threads, it is critical to be able to narrow your breakpoints to just the areas of interest. The CUDA Debugger supports setting conditional breakpoints for GPU threads with arbitrary expressions. Expressions may use program variables, the intrinsics blockIdx and threadIdx, and a few short-hand macros to make it easier to set conditions based on blockIdx and threadIdx.
To set a block or thread condition on a CUDA C breakpoint:
@blockIdx(0,1,0) && @threadIdx(0,1,0)
The debugger pauses execution of the target application when the blockIdx and threadIdx of the running code matches the blockIdx and threadIdx specified in the conditional breakpoint.
The CUDA Debugger has a basic macro expander that expands certain sub-expressions as follows:
Macro Expansion Notes @threadIdx(x, y, z)(threadIdx.x == (x) && threadIdx.y == (y) && threadIdx.z == (z))x, y, and z must be decimal integers. @threadIdx(#N)( (((threadIdx.z * blockDim.y) + threadIdx.y) * blockDim.x + threadIdx.x) == (N) )N must be a decimal integer. @blockIdx(x, y, z)(blockIdx.x == (x) && blockIdx.y == (y) && blockIdx.z == (z))x, y, and z must be decimal integers. @blockIdx(#N)( (((blockIdx.z * gridDim.y) + blockIdx.y) * gridDim.x + blockIdx.x) == (N) )N must be a decimal integer.
At this time, there’s no way for a user to add any extra macros.
|
|
An expression that accesses a bad pointer may cause the kernel launch to be terminated. As a work-around, you may use expression short-circuiting with the
Then 'p' will not be de-referenced if it is set to NULL. |
NVIDIA Nsight supports function breakpoints. To set a function breakpoint, use one of the following methods:
Function breakpoints will work even if the module is built without symbolics. However, only disassembly debugging will be available.
The user can enter either:
matrixMul would resolve for matrixMul(int) and matrixMul(char).matrixMul(int) or matrixMul<int>()). Optionally, the user can specify a module name. The syntax for this is the following:
[ModuleName!]FunctionName
If the ModuleName is left unspecified, the breakpoint will be set in each and every function of that name in all loaded modules. The module name works best when used with CUDART, since it has the .cu name for the module. For example: MyModule.cu!MyKernel
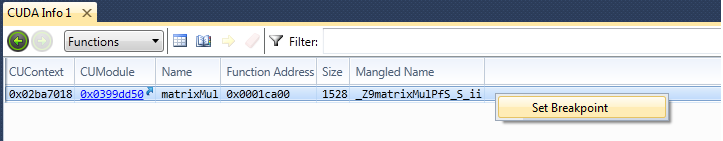
As a shortcut to this, the Functions page has the capability to enter the function name for the user. In this scenario the mangled function name is used, and it will set in each module that contains the specified function name.
|
|
NOTE: The function breakpoints only work for CUDA global functions. Device functions will not resolve. |
NVIDIA® Nsight™ Development Platform, Visual Studio Edition User Guide Rev. 3.2.131009 ©2009-2013. NVIDIA Corporation. All Rights Reserved.