CUDA Debugger > How To > View Memory

The NVIDIA Nsight CUDA Debugger supports the Visual Studio Memory window for examining the contents of memory on a GPU. The CUDA Debugger supports viewing shared, local, and global memory.

You can view values in GPU memory only when running a CUDA application, with the target application halted at a breakpoint in CUDA source code. Keep the following in mind:

Shared Memory:

Local Memory:

Global Memory:

View the Contents of GPU Memory

To view the contents of global memory
  1. From the Debug menu, choose Windows > Memory.
  2. Select one of the Memory windows. The Memory window opens or grabs focus if already opened.
  3. In the Address field of the Memory window, type the GPU memory address you want to see.
    Type either the hexadecimal value or the name of a valid pointer that is in the current lexical scope.
  4. Press the Enter key. The Memory window shows the contents of memory beginning with the specified address.

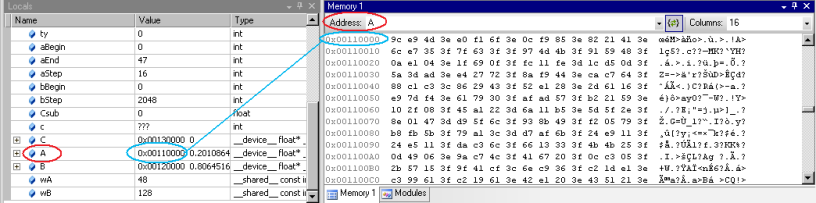
Tip: Right-click on the Memory window to change the way memory contents are displayed, including displaying memory contents as floating-point numbers.

To view the contents of shared memory
  1. From the Debug menu, choose Windows > Memory.
  2. Select one of the Memory windows. The Memory window opens or grabs focus if already opened.
  3. In the Address field of the Memory window, type the GPU memory address for the shared memory location to display.
    Make sure to cast the pointer to a pointer in Shared memory by using the following syntax:
    (__shared__ float*)p
  4. Right-click on the Memory window to see display options.

Note: The following examples show the syntax used to cast a pointer/address to a different memory space:

  • Shared: (__shared__ int*)0x00
  • Local: (__local__ int*)0
  • Global: (__device__ int*)0x2001b000

NOTE: You cannot change the value in GPU memory by editing the value in the Memory window.

View Variables in Locals Window in Memory

  1. Start the CUDA Debugger.
    1. From the Nsight menu in Visual Studio, choose Start CUDA Debugging. (Alternately, you can right-click on the project in Solution Explorer and choose Start CUDA Debugging.)
    2. Pause execution or allow the application to run to a breakpoint, or set a breakpoint if none enabled.
  2. From the Debug menu, choose Windows > Memory > Memory Window 1.
    The Memory window opens.
  3. Click and drag a variable from the Locals window onto the Memory window.
    The memory window displays the values at the addresses that correspond to the variable (or pointer).

    Memory Window
  4. Alternately, you can type the name of the variable into the Address field of the Memory window.
  5. When viewing memory in __local__, __const__ or __shared__ make sure the Visual Studio Memory view is set to Re-evaluate automatically. This will ensure that the memory shown is for the correct memory space. Without this, the display can change to an address which defaults to global memory.

NOTE: You cannot change the value in GPU memory by editing the value in the Locals window.

View Variables in Watch Window in Memory

  1. Start the CUDA Debugger.
    1. From the Nsight menu in Visual Studio, choose Start CUDA Debugging. (Alternately, you can right-click on the project in Solution Explorer and choose Start CUDA Debugging.)
    2. Pause execution or allow the application to run to a breakpoint (or set a breakpoint if none are enabled).
  2. From the Debug menu, choose Windows > Watch.
  3. Select one of the Watch windows. The Watch window opens or grabs focus if already opened.
  4. Click and drag a variable from the Watch window onto the Memory window.
    The memory window displays the values at the addresses that correspond to the variable (or pointer).


NVIDIA® Nsight™ Development Platform, Visual Studio Edition User Guide Rev. 3.2.131009 ©2009-2013. NVIDIA Corporation. All Rights Reserved.

of