Open topic with navigation
Overview
Provides the ability to collect performance counter values as observed on the target device during the kernel execution.
Most other experiments use some of the counters that are exposed through the Performance Counters experiment. Useful to collect data that is otherwise not covered by any experiment, to calculate additional derived metrics, or to access the actual raw counter values for further processing or comparisons using external tools. This experiment can be instantiated multiple times for a single profile session with different target architectures or counter configurations.
Background
The various hardware units of a CUDA device are capable of tracking a set of counters during the execution of a kernel. Those counters are updated at runtime and can be queried after the execution completed. The observed values represent the actual workload as seen by the hardware units; therefore often referred to as raw counter values. Many performance metrics are derived directly from one or more raw counter values.
The total number of counters that can be collected simultaneously is limited by the hardware and by the mechanism used to collect the data. Each collection mechanism comes with a different set of advantages and drawbacks: The HWPM provider can collect data from any type of hardware units across a CUDA device; however, for many units it can only sample from a subset of the existent hardware units of a chip at once. To get full coverage of all instances of a unit type multiple replay passes are necessary; slowing down the data collection and running the risk of incorrectly accounting for work across the multiple passes. In contrast, the SMPC provider can only collect data from the Streaming Multiprocessors (SM); but it is able to collect from all existent SMs at the same time. In case both previously discussed mechanisms do not provide the data of interest, the SW provider instruments the actual kernel code to collect the information as part of the kernel execution. While code instrumentation allows for an arbitrary number of counters to be collected from all active SMs at a time, it comes with the highest overall performance overhead. And as the actual kernel code gets altered, collecting SW counters prohibits collecting data from other providers in the same pass.
Whenever performance counter values from different passes are compared to each other, or when derived metrics with multiple input values are calculated, it is crucial to consider the impact of the scheduling and kernel replay to the obtained counter results. While each replay pass starts out with the very same input and actually performs the identical calculations, each run can slightly differ in execution on the chip. Differences might include variations in the used hardware units for small kernel grids, in the achieved workload distribution, or the order in which the warps scheduler execute instructions. While none of these variations have any effect on the correctness of the kernel's results, they might lead to changes in the collected performance counter values. Especially, if not all instances of a hardware unit can be observed at the same time. For that reason, correctness for comparing or combining performance counter values can only be guaranteed if all involved counter results were obtained from the very same replay pass. If this is not possible and data need to be taken from multiple passes, it is advisable to only combine performance counter results that each had full coverage of all existent units in their respective pass.
Configuration
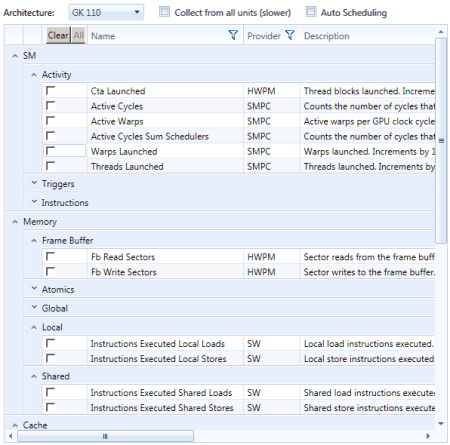
Lists the available counters for the selected target hardware architecture. By default the experiment allows to select as many counters as possible to be collected in a single pass. Counters that cannot be added to the current selection any more become inactive and appear greyed out.
An instance of a Performance Counters experiment is only executed if the configured architecture matches the CUDA device the kernel grid is launched on; otherwise the experiment instance is ignored. If the report output shows no performance counter information, double check the configuration of the architecture.
Options
Architecture
The target architecture for the experiment instance. Whenever kernel launches from multiple different CUDA devices should be recorded in a single profile capture, instantiate multiple Performance Counters experiments with different target architectures. The available list of counters differs between architectures.
Collect from all Units
Counters provided through the HWPM provider may not be collected from all existent hardware units in a single pass. If this option is disabled, the configured HWPM counters are sampled from as many hardware units as possible in a single pass; favoring collection speed over total unit coverage. If enabled, multiple kernel replay passes are executed to assure the counter is collected from all existent units. While this adds additional overhead, it can provide more accurate results. The Coverage column in the report output shows the percentage of units that were observed during the data collection. This option does not affect counters from other providers.
Auto Scheduling
The number of counters that can be collected in a single pass is limited by hardware constraints; for that, counters may become unavailable for selection (grayed out). This limitation is lifted with Auto Scheduling being enabled as multiple passes are used to collect the requested data. The number of passes used as well as the actual mapping of counters to the replay passes is not further defined. If a certain scheduling is required, add multiple instances of the Performance Counters experiment, each executing a single replay pass only.
Note that collecting all counters will take many kernel replay passes, and can be slow.
|
Output
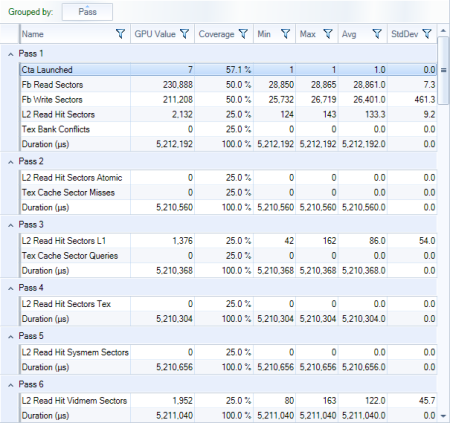
Reports the collected information for all applicable Performance Counters experiments of the kernel launch in a single table. Each configured counter shows up as one separate row in the table. For every executed replay pass, the overall kernel execution time is reported as well.
Collecting counters from the SW counter provider can impact the overall kernel performance significantly. This might lead to high variation in the reported kernel durations across replay passes. The actual counter results are not impacted by this.
Columns
Pass
The kernel replay iteration in which the counter was collected. Useful to understand the counter scheduling and assure correctness for derived metrics as described in the background section of this document. HWPM Counters that needed multiple passes to collect from all hardware units are all reported on 'Pass 0'.
GPU Value
The resulting value of the counter scaled to always cover all existent units of the target device. This is an estimated value only in two cases: First, the counter value is an aggregate across multiple passes; applies to all counters reported in 'Pass 0'. Second, the counter did not cover all existent hardware units; applies to all counters with a reported coverage less than 100%. In both cases, the estimation assumes uniform workload distribution across the hardware units.
Coverage
The percentage of existent hardware units observed for this counter. The lower the coverage is, the higher the uncertainty in estimating the total GPU value.
Min
The minimum counter value reported across all observed hardware units.
Max
The maximum counter value reported across all observed hardware units.
Avg
The average counter value reported for the observed hardware units.
StdDev
The standard deviation of the reported values across all observed hardware units.
|
NVIDIA® Nsight™ Development Platform, Visual Studio Edition User Guide Rev. 4.6.150311 ©2009-2015. NVIDIA Corporation. All Rights Reserved.
Open topic with navigation