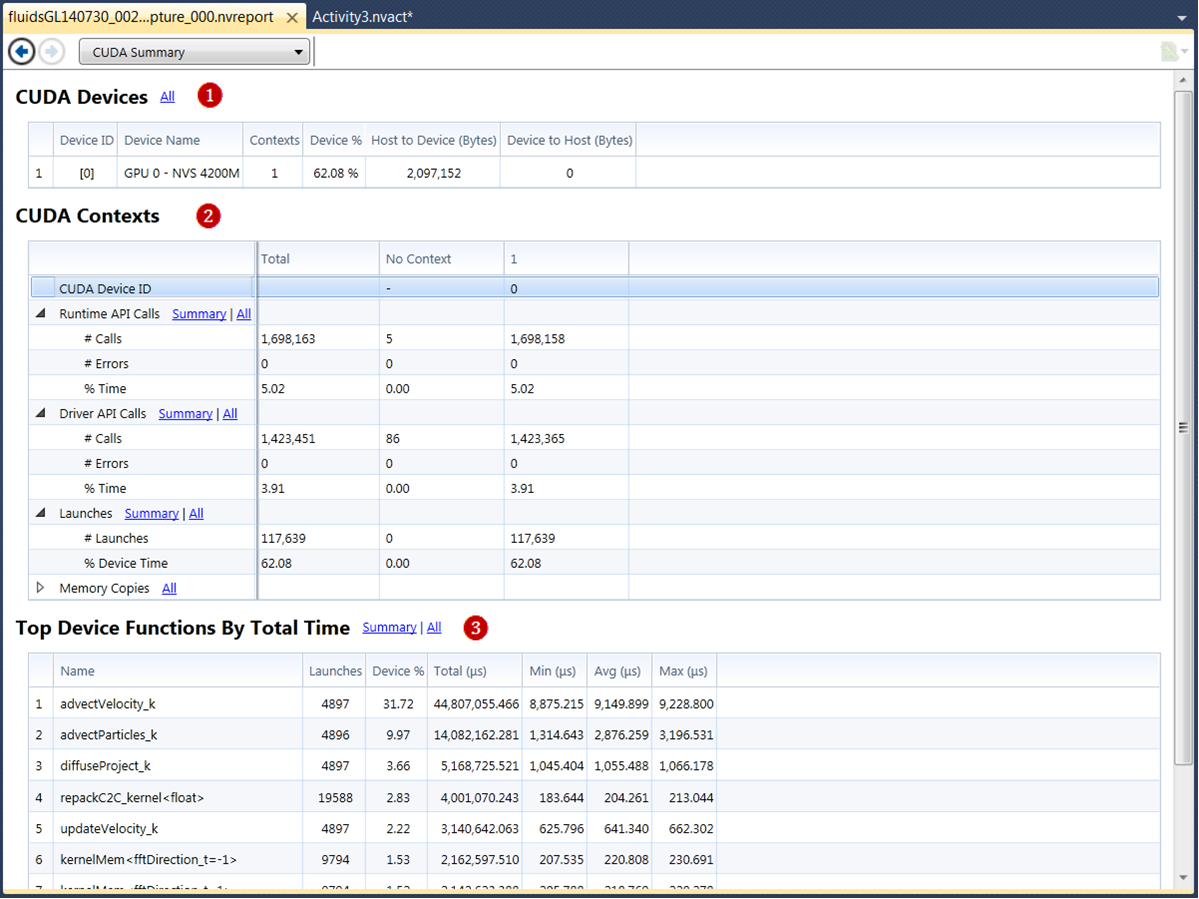
The CUDA Summary report is a top-level report that contains a summary of the CUDA-related information collected in the session. The summary displays the information in 3 sections:
- CUDA Devices - information about devices running CUDA-based code,
- CUDA Contexts - information about CUDA Contexts, and
- Top Device Functions by Total Time - a list of the most used kernels in terms of time.
 CUDA Devices
Column Label Description ID The ID of the CUDA device as returned by the CUDA Driver API calls cuDeviceGetandcuDeviceCount.Name The display name of the CUDA device as returned by the call to cuDeviceGetName.Contexts The number of CUcontextinstances created on the device.GPU% The % of time that kernels executed on the device out of the total duration of the capture. This does not include overhead for launching kernels. The actual percentage is slightly higher. H to D (bytes) H to D (bytes) The number of bytes transferred from the host to the device. D to H (bytes) D to H (bytes) The number of bytes transferred from the device to host.
 CUDA Contexts
The first column lists the different attributes that were measured, such as number of API calls or errors. The second column lists the total count for the analysis session (capture), such as the total number of API calls for the session, or total number of errors for the session. The remaining columns, list the counts for each context. The first context is Context 0, which refers to any CUDA Driver API calls made when a
CUcontextinstance is not active on the current thread.
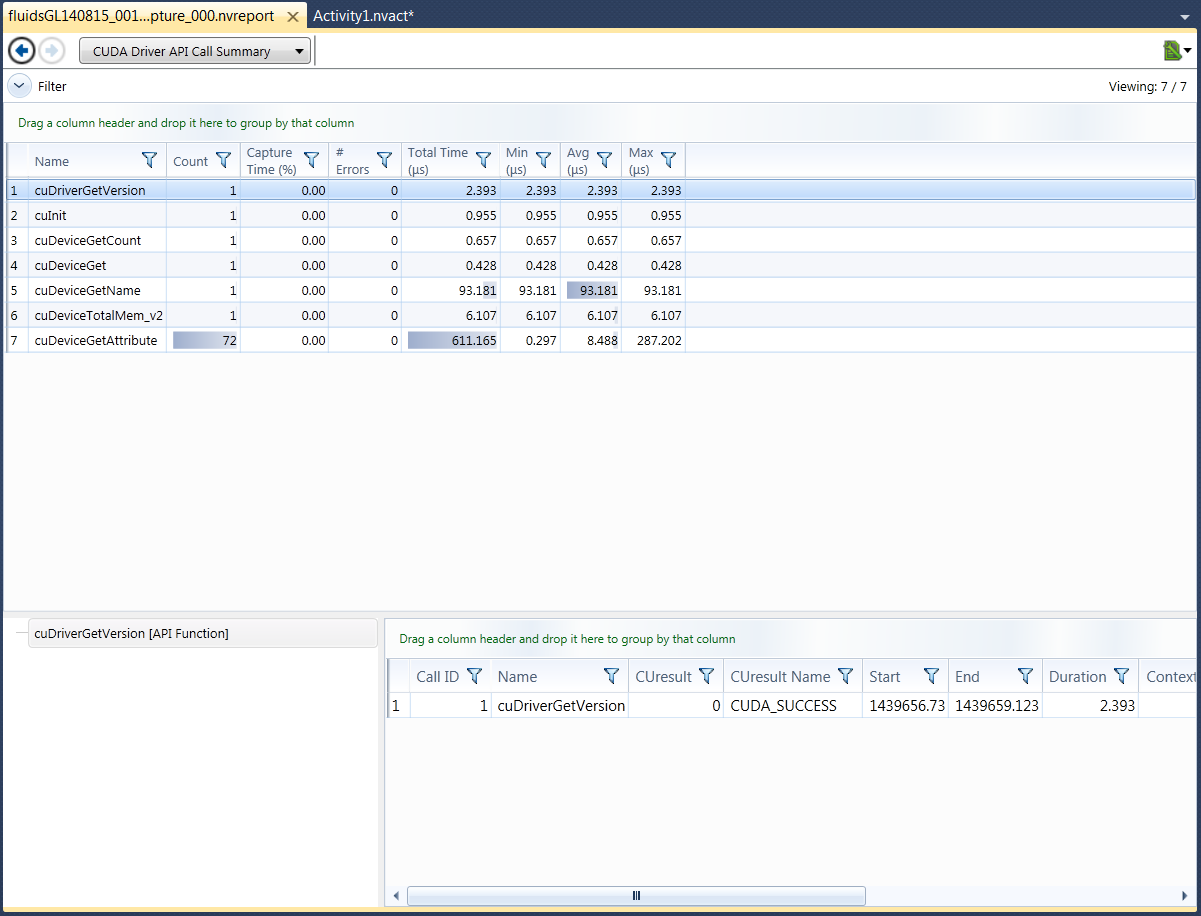
Row Label Description Device ID Context 0 refers to any CUDA Driver API calls made when a CUcontextinstance is not active on the current thread.Driver API Calls In the Total column, click on the link to see the CUDA Driver Call Summary pages or the list of the CUDA Driver calls.
# Call - number of API calls.
# Errors – number of API calls that did not return CUDA_SUCCESS. To see the instances, look at the CUDA Driver API Calls page and set the filter to:
“CUresult Not Equal To 0”
% Time – The % of time that any CUDA API call is active on a thread during the capture.
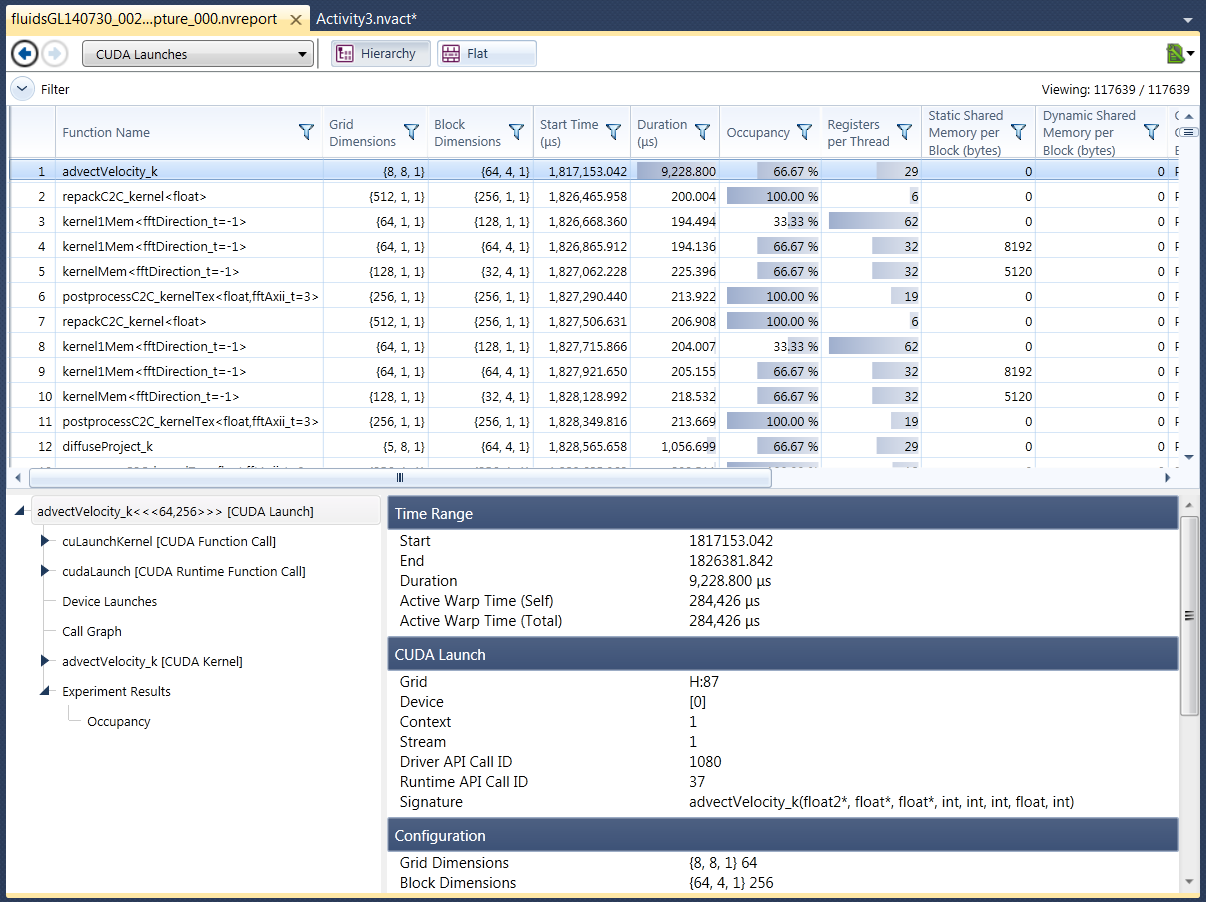
NOTE: This is not the percentage of time that API calls were on a CPU core (which could be normalized to 100%). This is not a summation of all time in a CUDA API Call divided by the capture time (which could be significantly greater than 100%). The valid range for this value is [0%-N*100%], with N being the number of threads sharing access to the context.Launches Link to CUDA Launches and CUDA Launch Summary.
# Launches – the number of kernels launched on the context.
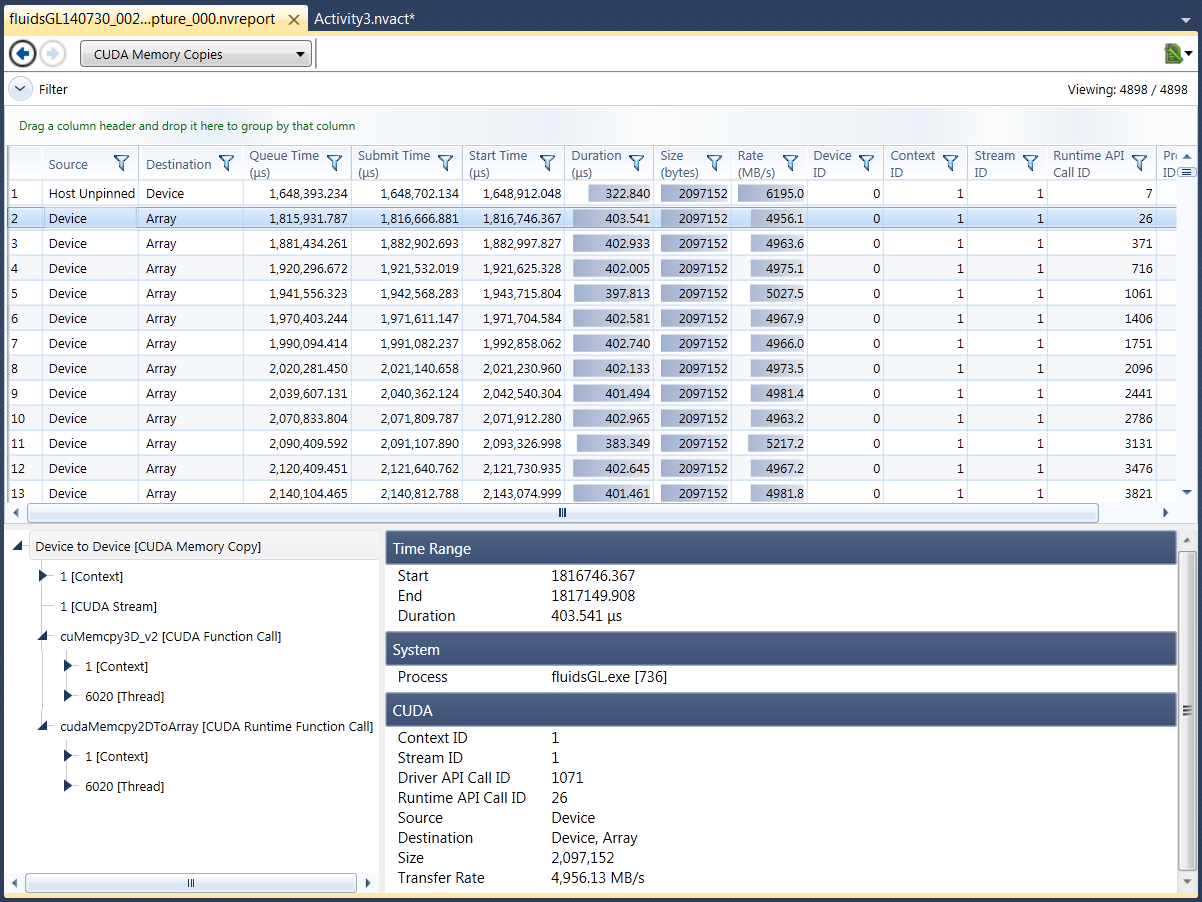
% GPU Time – the percentage of the capture time that a kernel was executing on the device.Memory Copies # Copies – the number of actual memory copy operations.
# Bytes – amount of bytes transferred by CUDA Driver API cuMemcpy calls.
% Time – percentage of time that memory copies were occurring during the capture.
 Top Device Functions by Total Time
This overview table lists the top 10 kernels by time spent executing on the GPU.