- Click the Windows Start Menu in the bottom left corner of the screen.
- Select All Programs > NVIDIA Corporation > Nsight Visual Studio Edition 4.6> Nsight Monitor.
The Nsight Monitor starts. The monitor icon appears in the system tray.
NVIDIA® Nsight™ Development Platform, Visual Studio Edition 4.6 User Guide
Send Feedback
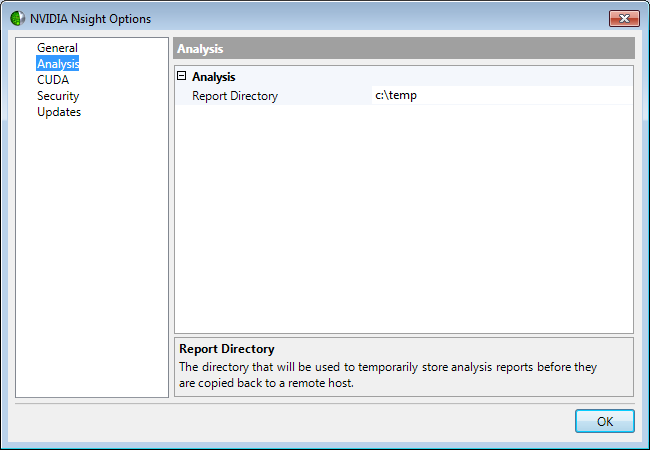
The NVIDIA Nsight Analysis Tools produce several detailed reports that show information specific to the type of trace performed. NVIDIA Nsight saves the reports to the c:\temp directory. You can change the default directory.
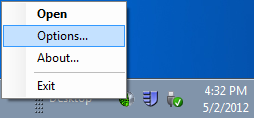
To change the default directory for storing reports:
Each detailed report deals with some subset of trace data related to the domain for which you are collecting data. For example, if you collected data on a DirectX application, the detailed reports would contain data on DirectX API Calls, and DirectX Performance markers. If you collected system data, you would also see reports on function calls to the system, and statistics about each GPU device.
The list of reports that are available depend on the type of analysis you performed, and the data that was available to the analysis tools.
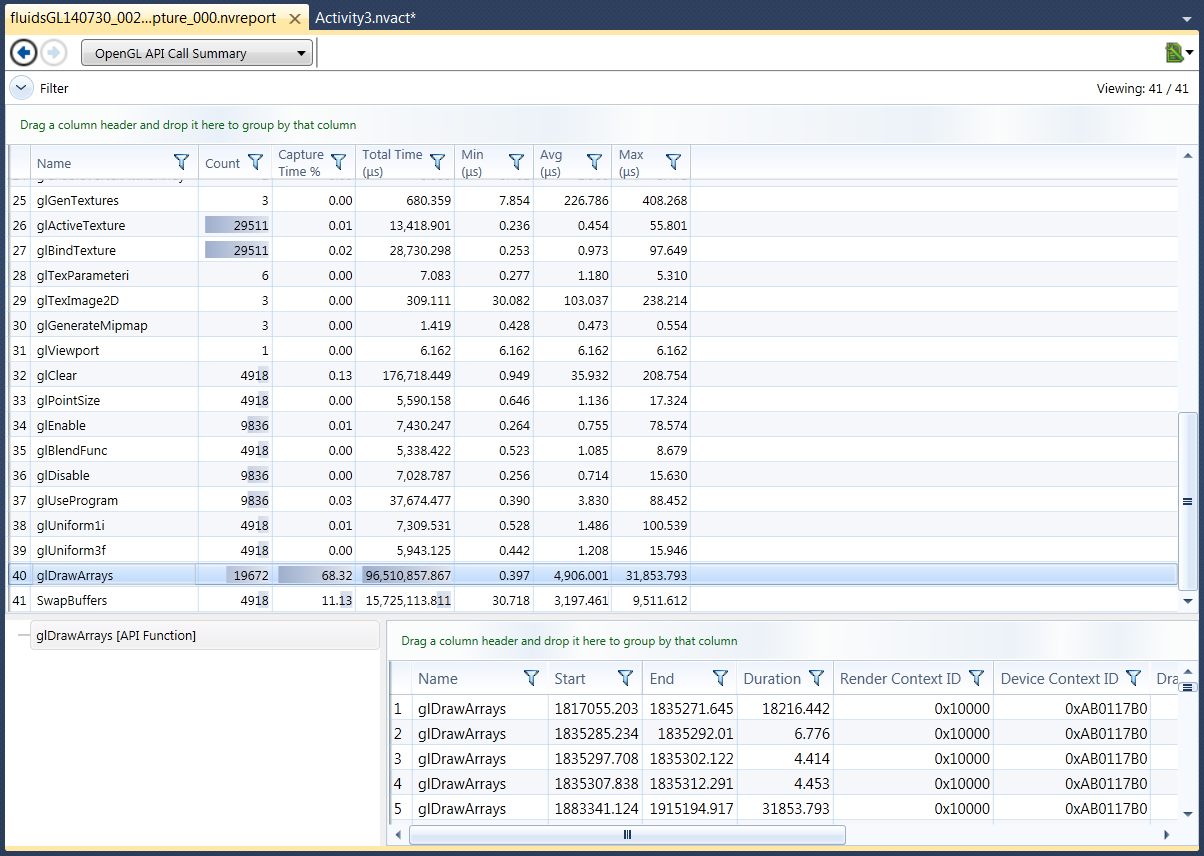
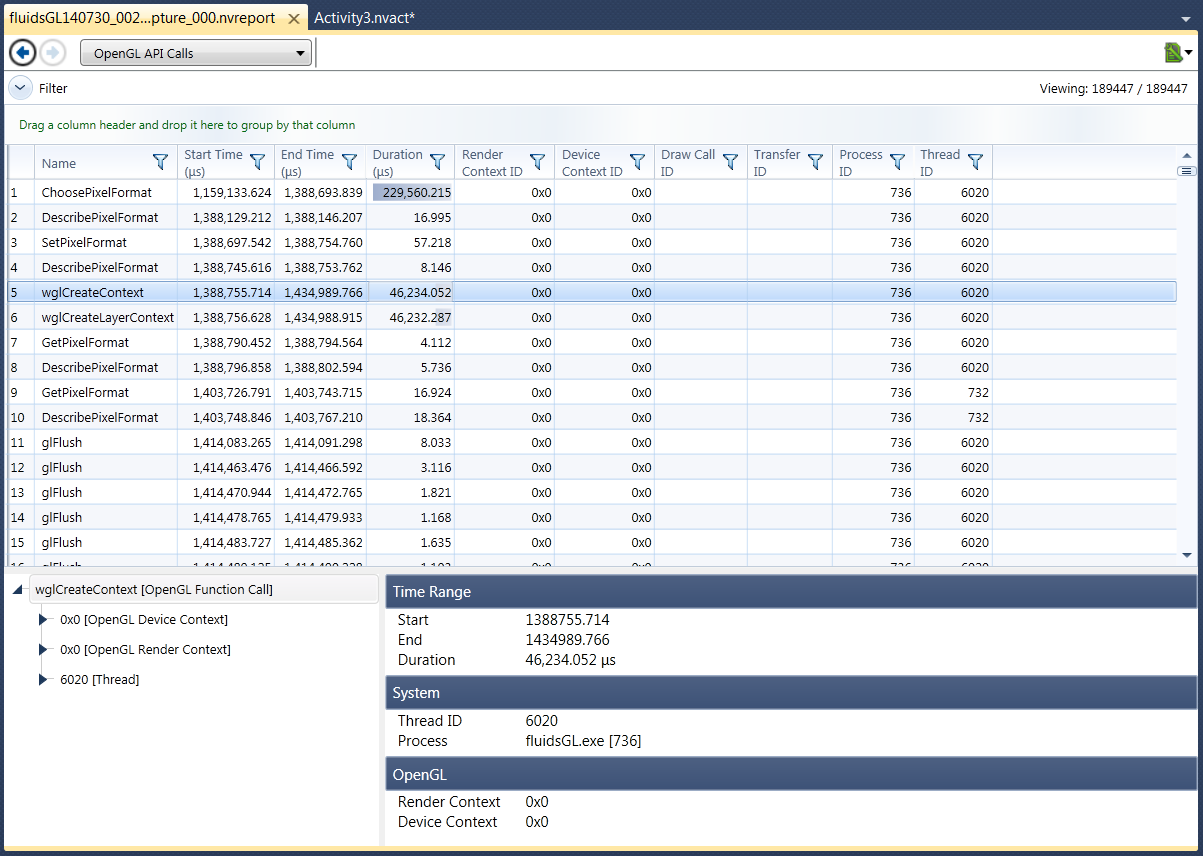
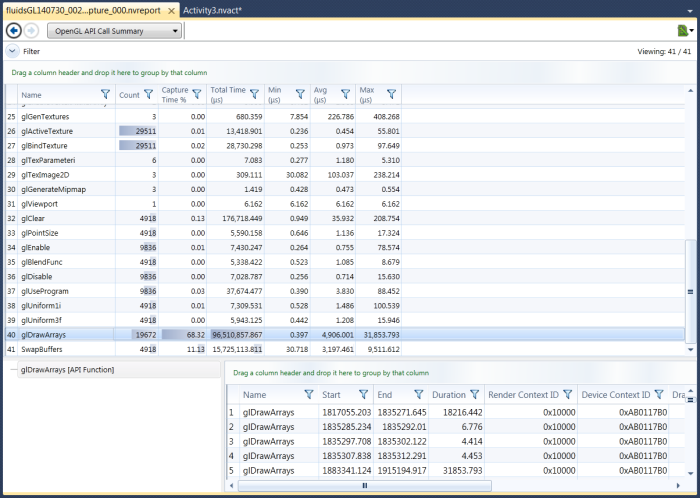
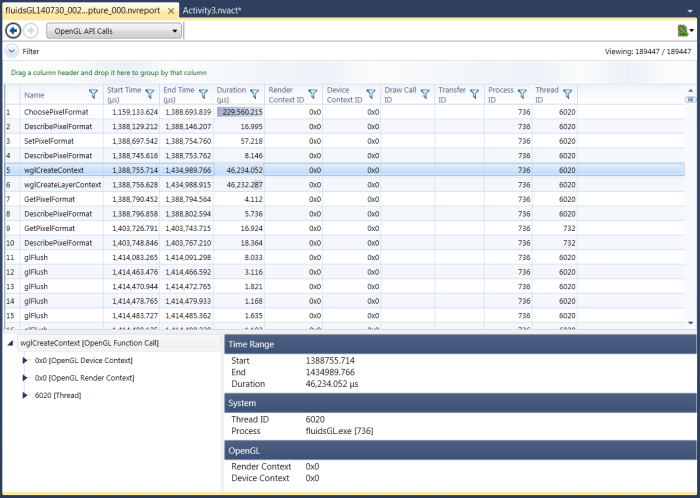
For example, a trace on all available signals related to OpenGL would result in the following detailed reports:
OpenGL API Call Summary
OpenGL API Calls
NVIDIA® Nsight™ Development Platform, Visual Studio Edition User Guide Rev. 4.6.150311 ©2009-2015. NVIDIA Corporation. All Rights Reserved.