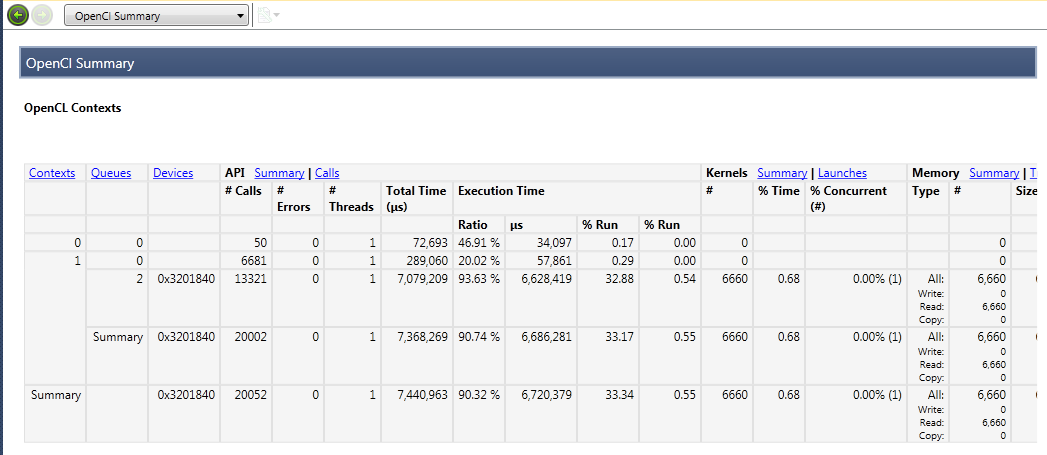
The OpenCL Summary appears in the middle of the top-level Summary Report. It shows a summary of the OpenCL-related information collected in the session. The summary displays information about API calls per context and per queue. Contexts with more than one queue also contain a Summary row, which shows the aggregated statistics for all queues in the parent context.
| Column Label |
Description |
| Contexts |
Lists the contexts that were created during the capture. Each context appears on its own row, along with the corresponding data related to that context. |
| Queues |
Lists the queues created for each context. If there is more than one queue for a context |
| Devices |
The OpenCL device used for each queue. |
| API Calls |
The number of API calls, errors, threads, and time spent per queue. |
| Kernels |
The number, % Time, % Concurrent for all kernels per queue |
| Memory |
The number, bytes transferred, % Time, and % concurrent for all OpenCL memory transfers per queue. |
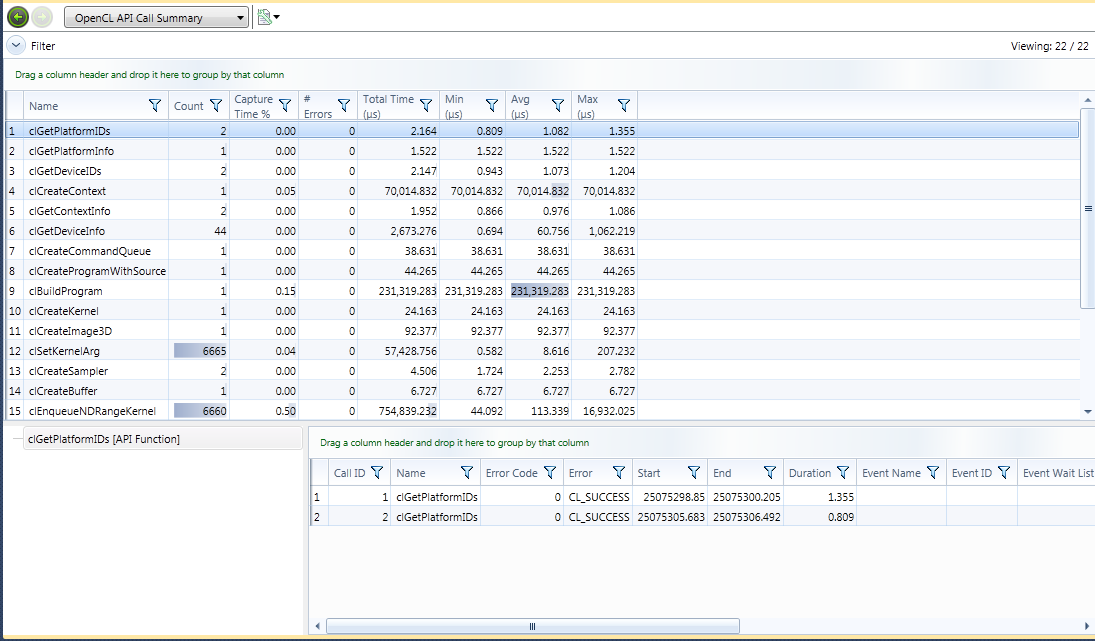
The API Call Summary lists statistics of calls made to the OpenCL API, including the number of times the API call was called, the percentage of time of the overall capture time that the API call took, the number of errors returned, and statistics on the elapsed time each API call took while executing.
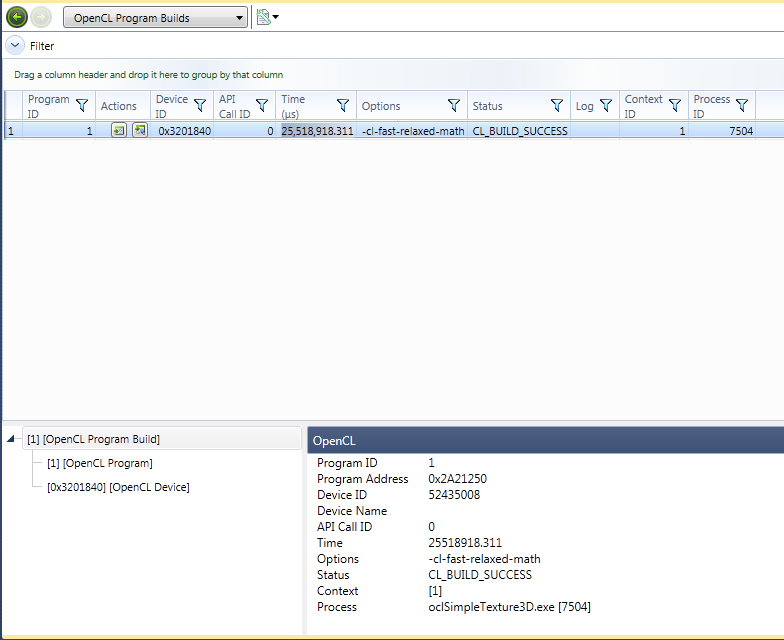
The OpenCL Program Builds report shows every OpenCL Program built by your program using the clBuildProgram API call. Using this report, you can see data on all program builds that occurred in your program's execution, and can view the source and assembly for each program.
| Column Label |
Description |
| Program ID |
The id of the program being built.
|
| Actions |
There are two buttons available under Actions: The first will display the source of this OpenCL program, and the second will display the assembly of this OpenCL program.
|
| Device ID |
The id of the OpenCL device used in the builds.
|
| API Call ID |
The Call ID of the clBuildProgram API call.
|
| Time (µs) |
The amount of time elapsed during the clBuildProgram API call.
|
| Options |
Any options passed into the clBuildProgram API call
|
| Status |
The returned status of the clBuildProgram API call
|
| Log |
Any log output from this clBuildProgram API call |
| Context ID |
The OpenCL id used for this API call |
| Process ID |
The CPU process ID for this API call |
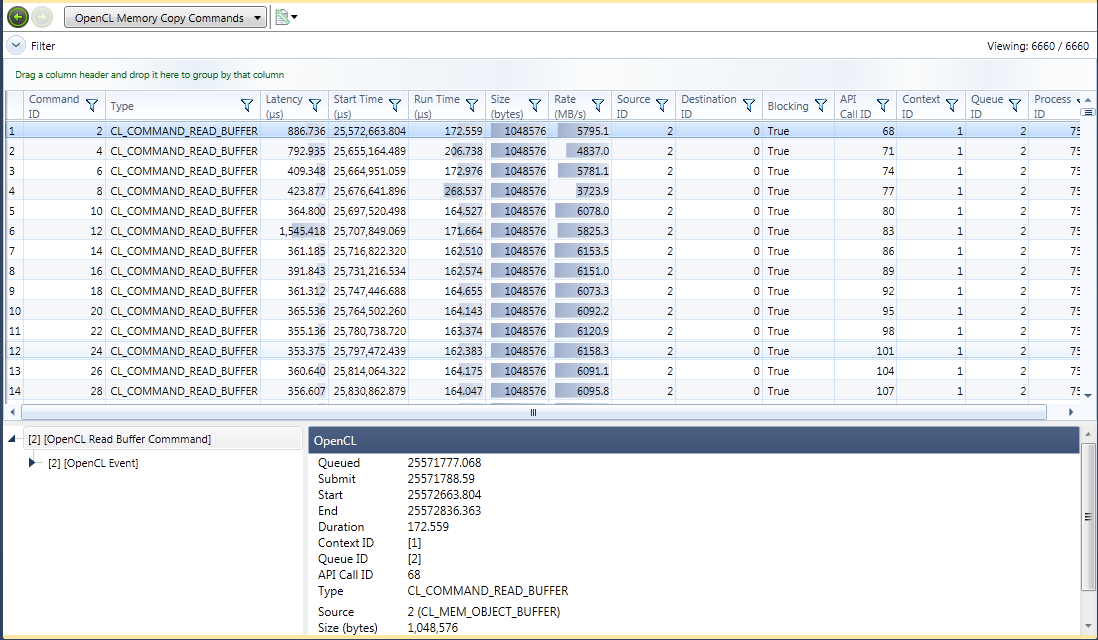
The OpenCL Memory Copy Commands report shows every copy command executed in your program. Memory copy commands can be performance limiting, especially the copy command results in a transfer of data across the PCI-e bus from your CPU to your GPU or from your GPU to your CPU.
NVIDIA® Nsight™ Development Platform, Visual Studio Edition User Guide Rev. 4.6.150311 ©2009-2015. NVIDIA Corporation. All Rights Reserved.