Open topic with navigation
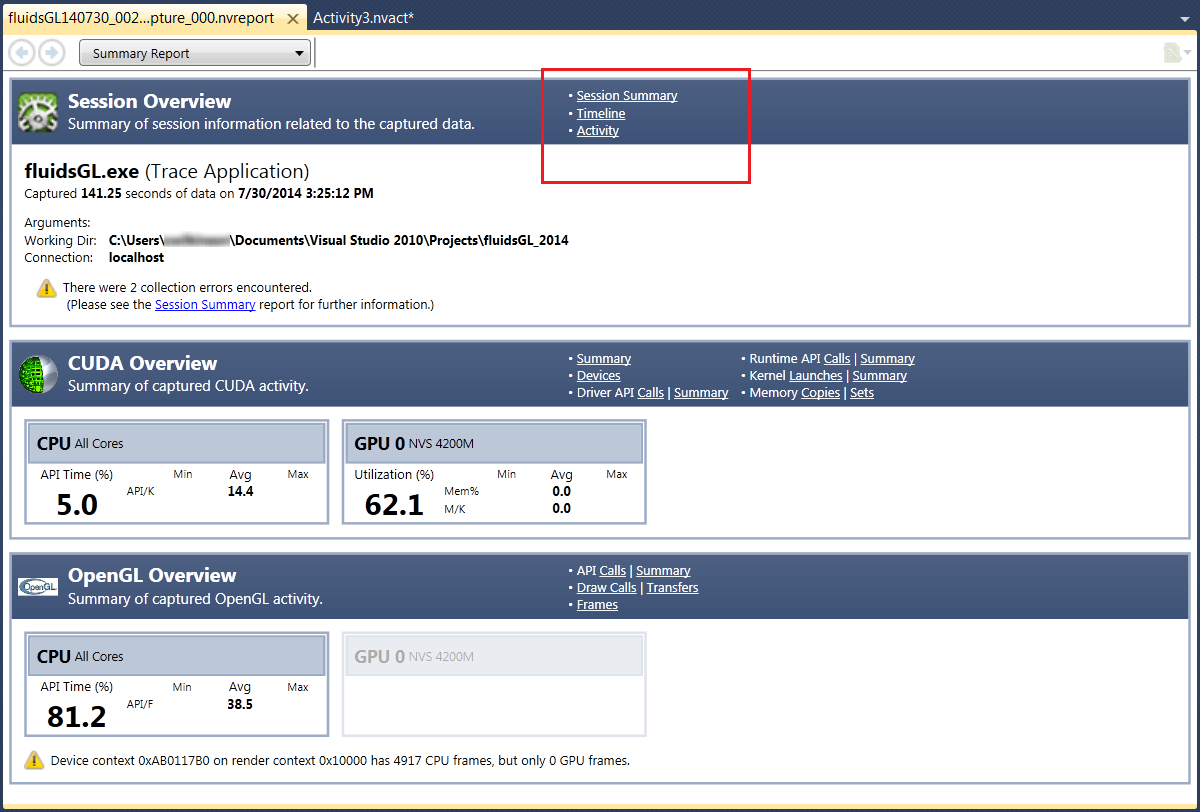
The Summary Report is a synopsis of the data recorded during a single capture session. It contains data about the capture itself, such as the duration of the capture. It also contains a summary of the domain-specific data. For example, if you were analyzing a DirectX application, the Summary Report would contain a section specifically on the DirectX data collected. The Summary Report also contains a Session Overview, and links to more detailed reports.
Session Overview
The Session Overview section of the Summary Report contains an overview of the capture that was performed, and includes hyperlinks to more detailed information on other report pages. This shows the very basic information about the capture, such as the target application, the capture duration, date, command line parameters, and any other variables.
The header of each section includes direct links to all available reports for this domain. For example, you can directly jump to the timeline with a single click from the top of page.
This screen will display a warning message, if something went wrong during data capture or loading the report file.
Process Overview
If the analysis activity you have selected is either a System Trace or System Profile, the Summary Report will also display a section called the Process Overview in between the Session Overview and domain-specific overviews. The Process Overview displays a summary of process information related to the data that has been captured.
Domain-Specific Overview
On the Summary Report, below the Session Overview and Process Overview sections, are the domain-specific overviews. Depending on the analysis activity that you select, these could be one or more of the following:
- CUDA Overview (as displayed above)
- OpenCL Overview
- DirectX Overview
- OpenGL Overview
This overview section displays information for both CPU and GPU activity. In the CPU summary section, the overall percentage displayed represents how much time is spent executing an API call, in respect to the overall capture time.
In the GPU summary section, the utilization percentage shown represents how often the GPU was utilized, in respect to the overall capture time.
As with the Session Overview, a warning message will be displayed at the bottom of this section if any errors occur.
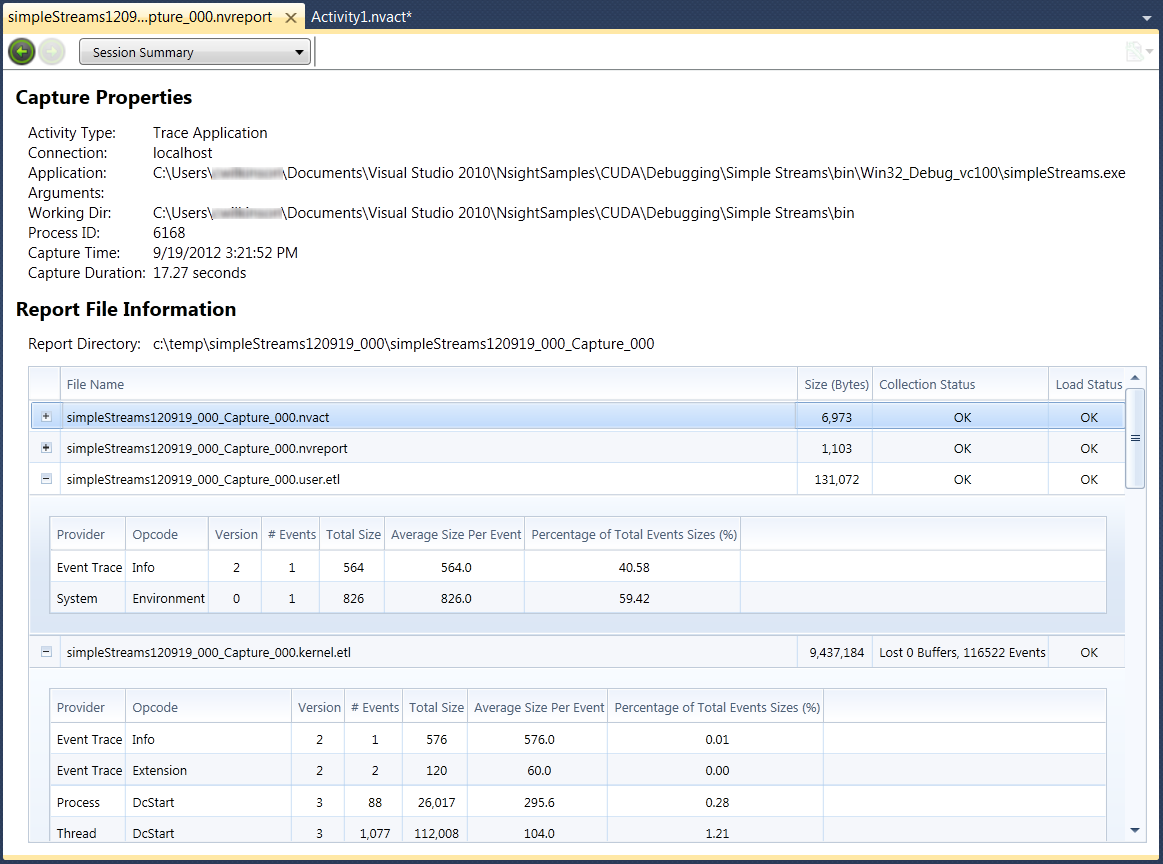
Session Summary
The Session Summary portion of the Summary Report shows a high level summary of the capture session.
NVIDIA® Nsight™ Development Platform, Visual Studio Edition User Guide Rev. 4.6.150311 ©2009-2015. NVIDIA Corporation. All Rights Reserved.
Open topic with navigation