NVIDIA® Nsight™ Application Development Environment for Heterogeneous Platforms, Visual Studio Edition 5.2 User Guide
Send Feedback
NVIDIA Nsight supports debugging CUDA GPU core dumps. To use this feature, there are 3 requirements:
CUDA_ENABLE_COREDUMP_ON_EXCEPTION=1 needs to be set. -G in the command line arguments. The GPU core dump will be generated as a *.nvcudmp file in the same directory as the executable. You can open this generated file (or a core dump file that was previously generated) in Visual Studio, either from the File > Open menu, or by dragging and dropping it into Visual Studio.
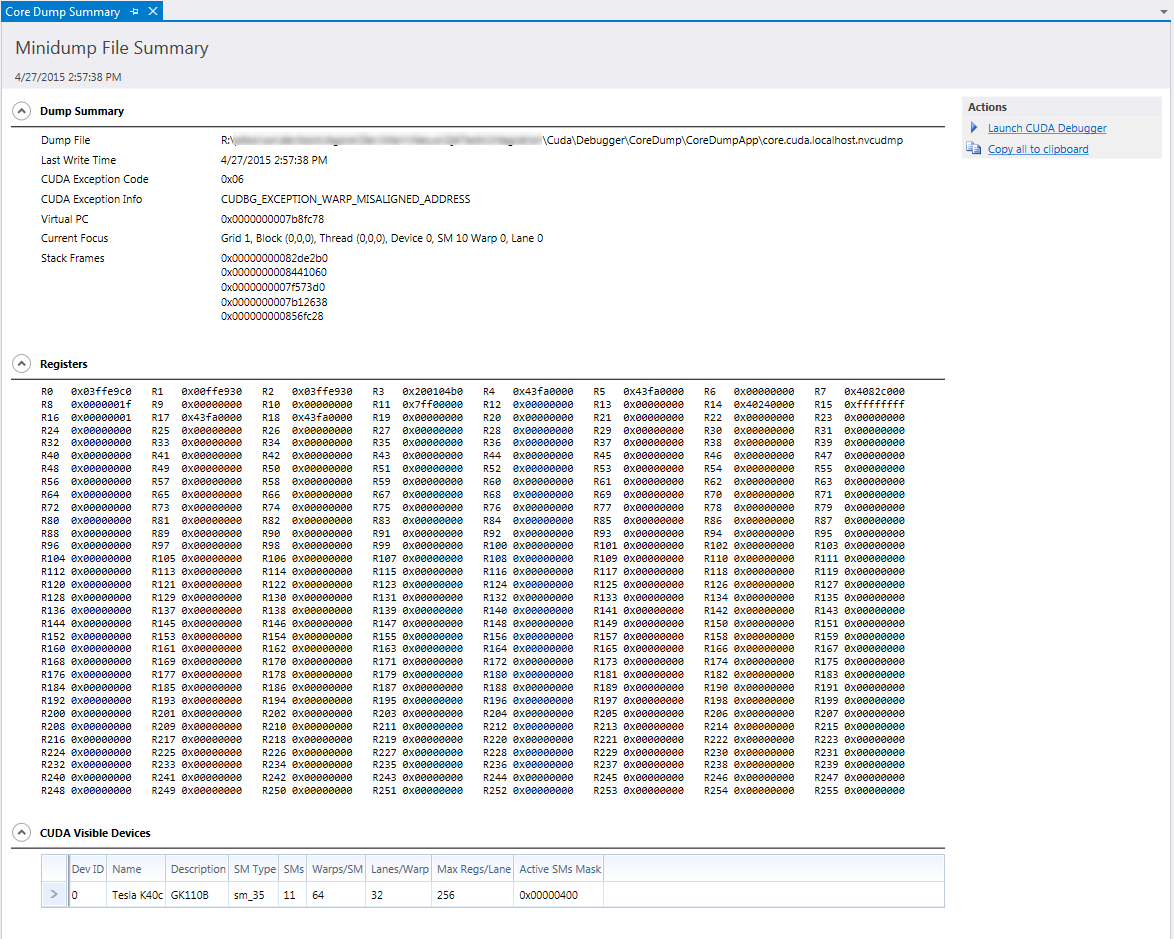
This shows you a read-only view of raw information in three collapsible sections: a dump summary, registers, and visible CUDA devices.
 | Note: At this time, NVIDIA Nsight only supports GPU core dumps; any generated CPU core dump information will be ignored. |
From this summary view, you can launch the CUDA debugger with the GPU core dump file set as the target application. Note that this will only work with a local debugging configuration, so the Nsight monitor will have to be running on the local machine. This will allow you to view CUDA debugging information, which can provide more diagnostic details, such as:
NVIDIA® Nsight™ Application Development Environment for Heterogeneous Platforms, Visual Studio Edition User Guide Rev. 5.2.161206 ©2009-2016. NVIDIA Corporation. All Rights Reserved.