NVIDIA® Nsight™ Application Development Environment for Heterogeneous Platforms, Visual Studio Edition 5.2 User Guide
Send Feedback
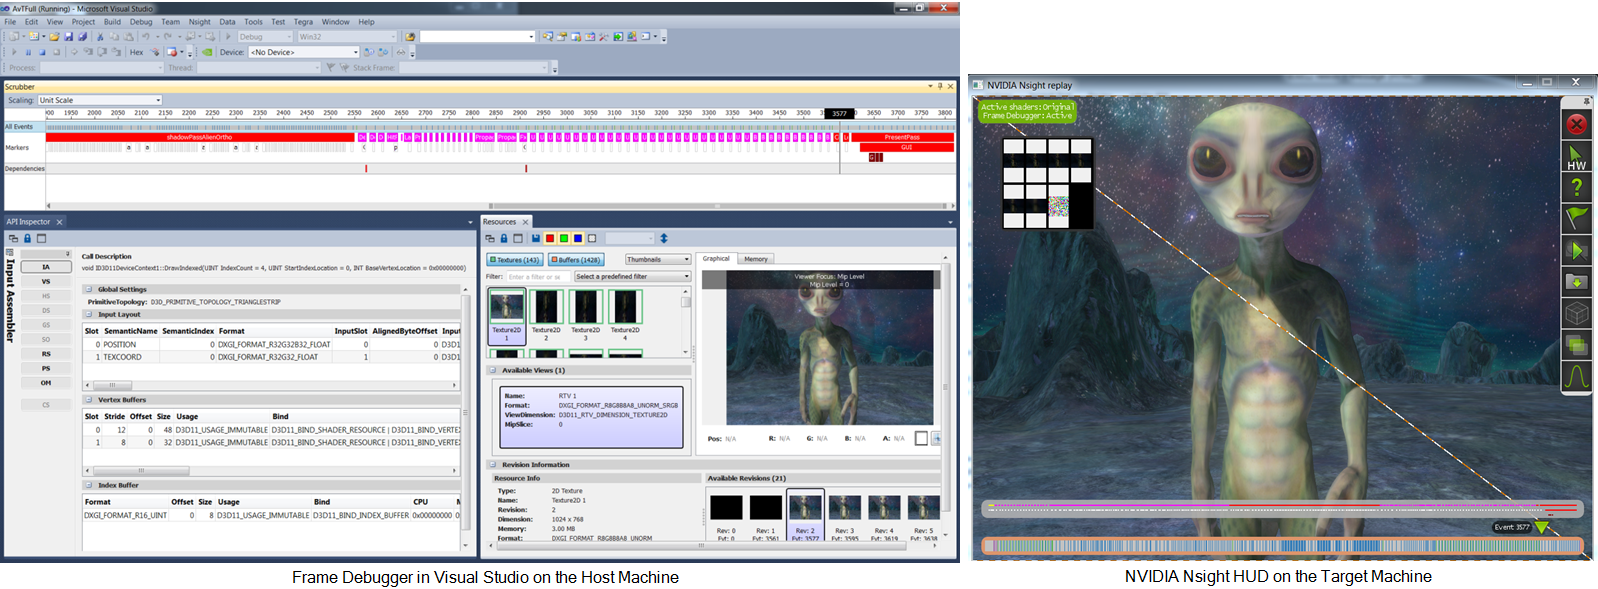
The NVIDIA Nsight Frame Debugger provides the ability for both real-time and capture-based application analysis. In real time, the Performance Dashboard shows a heads-up display (HUD) on the application being debugged, which includes real time performance data from both the GPU and CPU.
Once a capture is performed, you can navigate through draw events with the Frame Scrubber, see pipeline states in the API Inspector, inspect render targets and textures in the Resources View, and display profiler information with the scene broken down according to API performance markers. (Many of these features are similar to NVIDIA's PerfHUD software, which may be familiar to you.)
For more information on configuring your target and host machines, see Target and Host Setup.

|
Note for OpenGL frame debugging: If you encounter debug GLSL compiler issues, the best way to work around it is to disable the shader debugger. To do so, see setting your Shader Debugger preferences. Note that this will disable all shader debugging features, including pixel history. |
There are three buttons that are common across several frame debugger views.
NVIDIA® Nsight™ Application Development Environment for Heterogeneous Platforms, Visual Studio Edition User Guide Rev. 5.2.161206 ©2009-2016. NVIDIA Corporation. All Rights Reserved.