NVIDIA® Nsight™ Application Development Environment for Heterogeneous Platforms, Visual Studio Edition 5.2 User Guide
Send Feedback
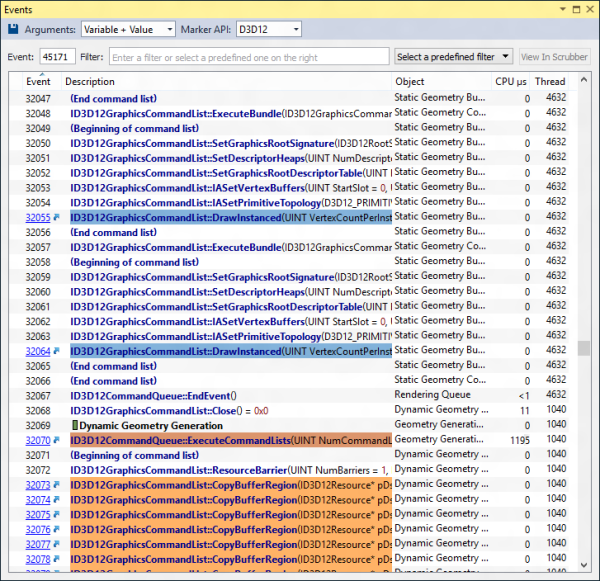
The Events view shows all API calls in a captured frame. It also displays both CPU and GPU activity, as a measurement of how much each call "cost."
To access the Events view, go to Nsight > Windows > Events.
Clicking a hyperlink in the event column will bring you to the API Inspector page for that draw call.
You can select whether to view the events in a hierarchical or flat view. If multiple performance marker types are used, you can select the correct one, as well as varying levels of verbosity for the call display (variable + value, value, or none). You can also sort the events by clicking on any of the available column headers.
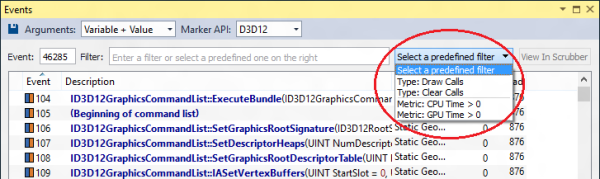
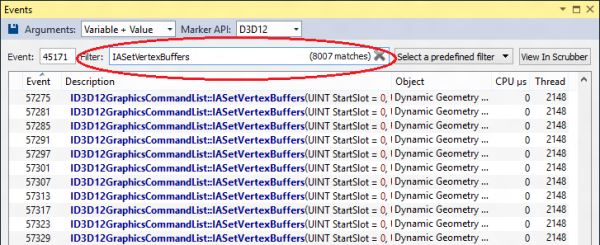
There are two different ways to filter the events list.
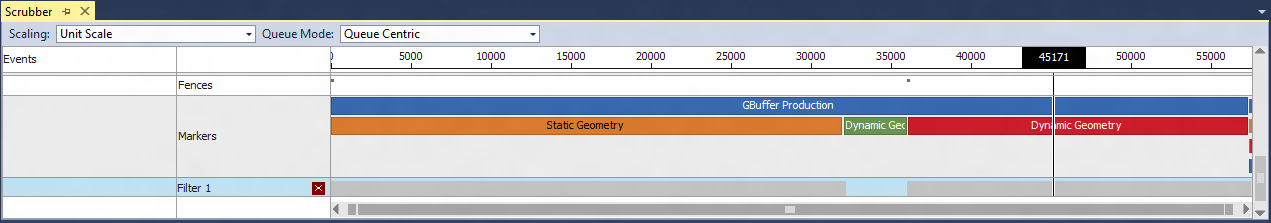
From the results, you can select View in Scrubber, and a new row will appear in the frame scrubber that displays your filtered events.
NVIDIA® Nsight™ Application Development Environment for Heterogeneous Platforms, Visual Studio Edition User Guide Rev. 5.2.161206 ©2009-2016. NVIDIA Corporation. All Rights Reserved.