
|
Debugging of HLSL Effects (anything compiled with an fx_N_M target) is not supported, only pure HLSL shaders.
|
NVIDIA® Nsight™ Application Development Environment for Heterogeneous Platforms, Visual Studio Edition 5.2 User Guide
Send Feedback
The NVIDIA Nsight Shader Debugger tools allow you to perform source-level debugging of all GLSL shader stages (except for the Open GL 4.3 Compute Shader).
|
|
Debugging of HLSL Effects (anything compiled with an fx_N_M target) is not supported, only pure HLSL shaders.
|
To access the Shader Debugger:
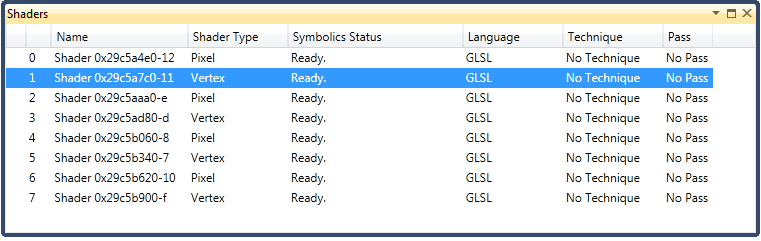
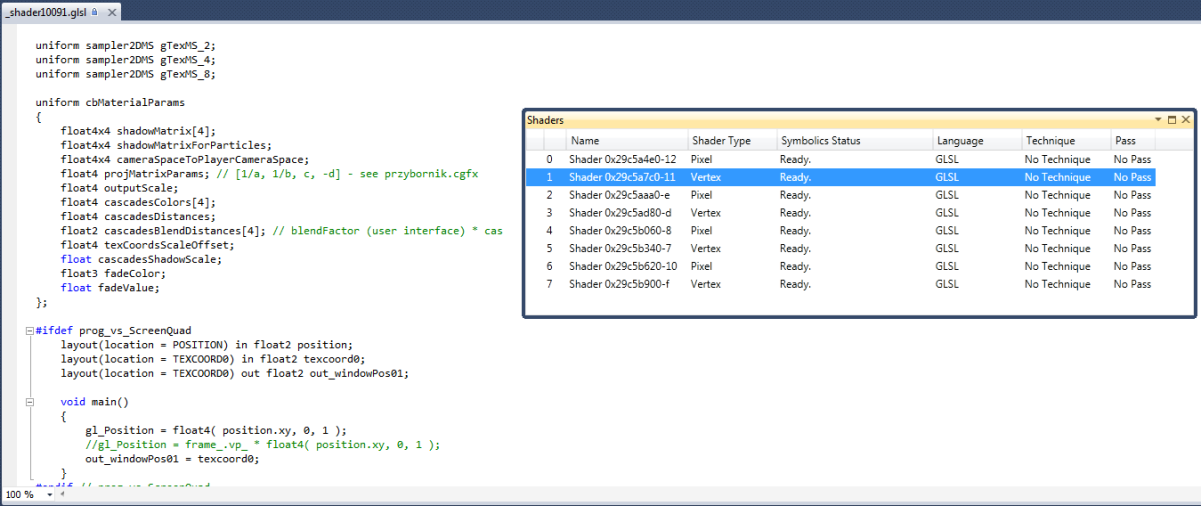
| Note that the shader types listed use Direct3D names instead of GLSL shader names. This will be corrected in a future version of NVIDIA Nsight. |
The following table shows the possible states of the Symbolics Status:
Status Meaning Ready The shader can be debugged. Shader has not yet been used by the application. The shader is created, but it has not been used by the application. That means that it cannot yet be debugged. No symbols have been loaded for this shader. The shader cannot yet be debugged. This usually happens during startup when the debugger is still loading a defined shader, but has not yet loaded the debug symbolics required for debugging. Not a debuggable shader. The shader cannot be debugged. The shader was likely submitted as a binary shader compiled without debug information, which means that the instructions being executed cannot be mapped to the original GLSL source code.
NVIDIA® Nsight™ Application Development Environment for Heterogeneous Platforms, Visual Studio Edition User Guide Rev. 5.2.161206 ©2009-2016. NVIDIA Corporation. All Rights Reserved.