NVIDIA® Nsight™ Application Development Environment for Heterogeneous Platforms, Visual Studio Edition 5.3 User Guide
Send Feedback
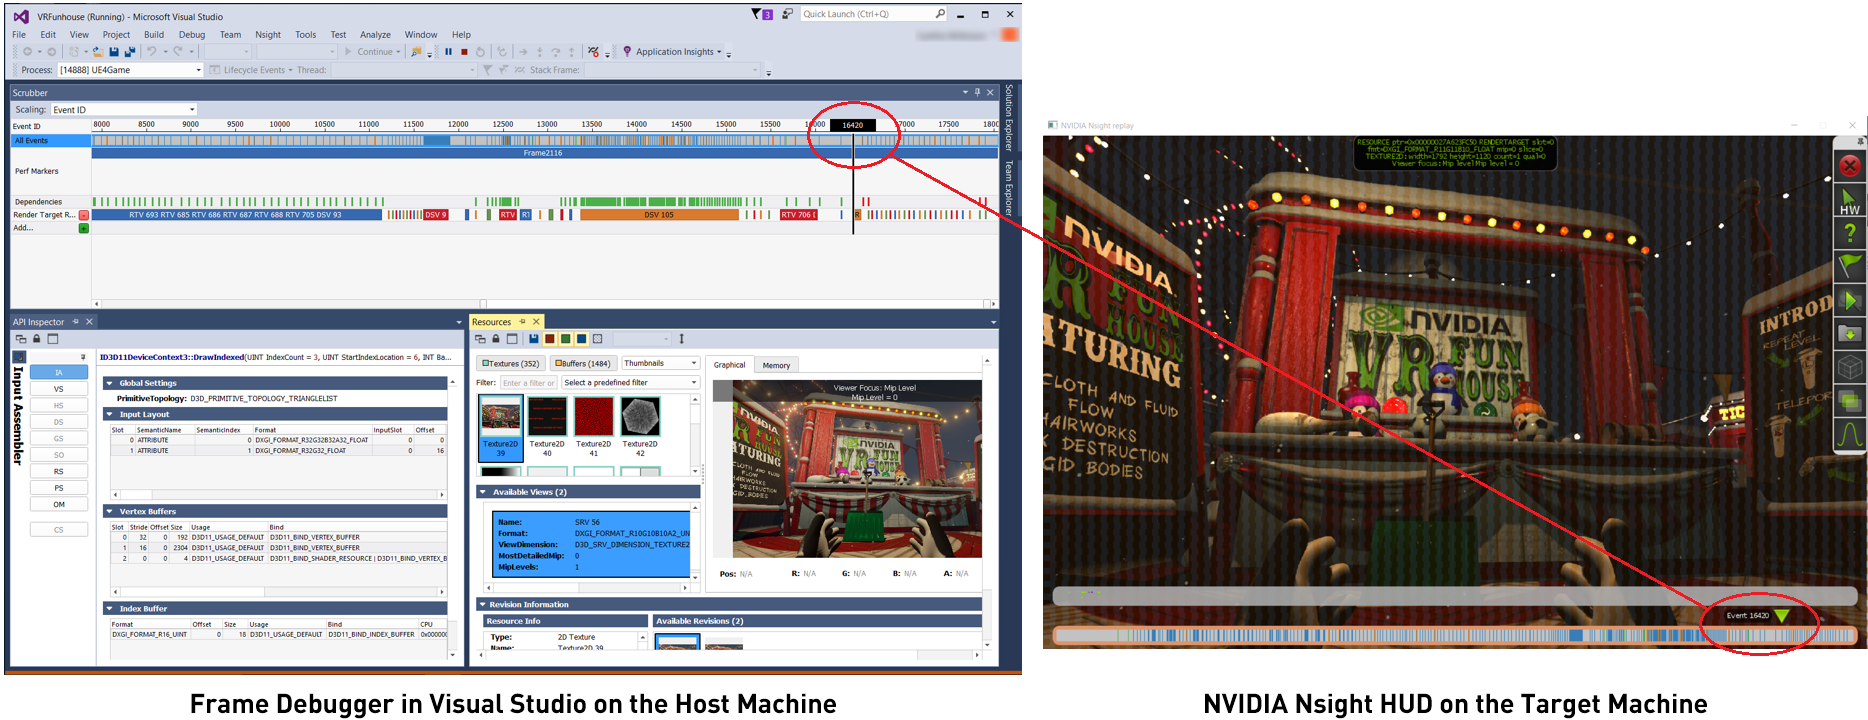
The NVIDIA Nsight Frame Debugger has two parts. One part appears as the Frame Debugger window in Visual Studio. The other part appears as a Heads-Up Display (HUD) on the target application.
The part of the Frame Debugger that appears as a HUD on the target machine is comprised of the following:
For the sake of discussion when it comes to graphics debugging, it helps to note some common terminology.

|
NOTE for Direct3D frame debugging: The Direct3D runtime documentation states that, "the return values of AddRef & Release may be unstable and should not be relied upon." The NVIDIA Nsight Frame Debugger will also take additional references on objects so any code that relies on an exact reference count at a particular time may fail. In general, users should not expect an exact reference count to be returned from the Direct3D runtime. For more information, see Microsoft's Rules for Managing Reference Counts. |
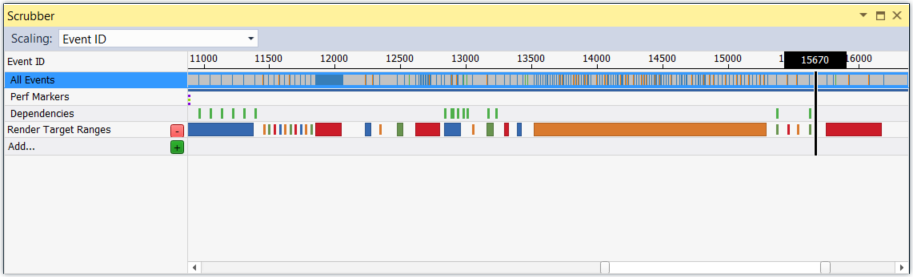
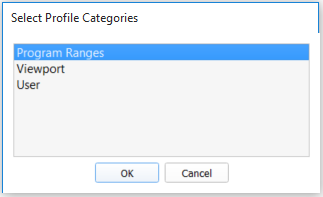
The default view will show the events in your application, in addition to any performance markers you have defined. Clicking the Add... button will open a dialog that allows you to select what type of range you want to add.
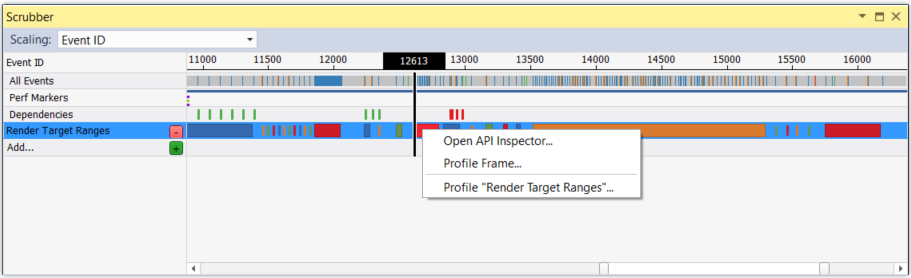
Right-clicking on a specific action in the Scrubber will allow you to open the API Inspector for that action, or initiate a profile session with the Range Profiler.
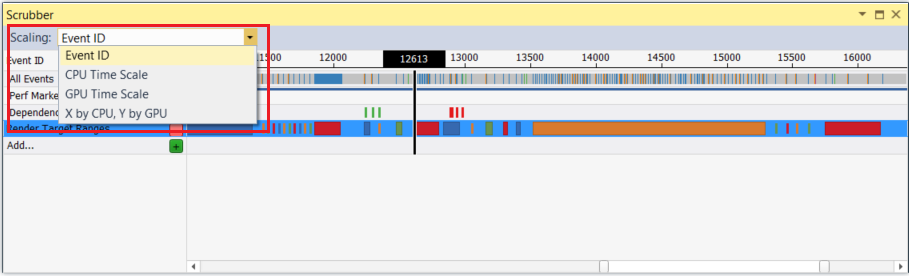
For Direct3D 9, Direct3D 11, and OpenGL applications, there are 4 ways to view the scrubber.
The scrubber view options are different for Direct3D12 applications. Here, you have two ways to view the scrubber.
From the Queue Mode drop-down, Queue Centric sorts the events by queue, while Thread Centric sorts the events by the thread.
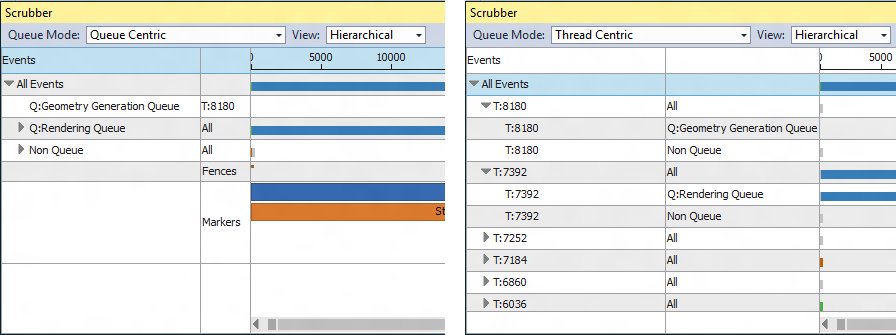
Queue Centric versus Thread Centric Mode
From the View drop-down, you can select if you want to view the events in a hierarchical or flat format.
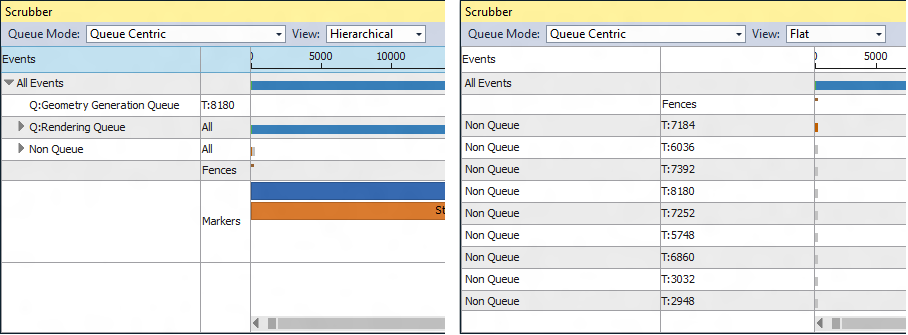
Hierarchical versus Flat View
When the scrubber has focus, you can use the following hotkeys to move the scrubber cursor from one event to another.
HOTKEY ACTION Navigation CTRL + Home Go to the first event. CTRL + End Go the last event. CTRL + Left Arrow Go to the previous event. CTRL + Right Arrow Go to the next event. Up Arrow Expand the current event group (HUD only). Down Arrow Collapse the current event group (HUD only). F2 Current event: show less information (HUD only). F3 Current event: show more information (HUD only). Zooming and Panning CTRL + Scroll mouse wheel up, or
CTRL + NumPadPlus
Zoom in X-axis CTRL + Scroll mouse wheel down, or
CTRL + NumPadMinus
Zoom out X-axis CTRL + 0 Reset zoom CTRL + SHIFT + Scroll mouse wheel up Increase row height (all rows) CTRL + SHIFT + Scroll mouse wheel down Decrease row height (all rows) CTRL + Left mouse click and drag Pan ALT + mouse move View zoom window Cursor and Selection Left mouse click on desired cursor location Set cursor
(Places cursor at closest point to the start of a range.)Left mouse click on desired row
Select row
(The selected row is highlighted in orange.)SHIFT + Left mouse click and drag Make range selection Left mouse click on selection Zoom to range Left double-click on event action, or
Right-click menu, Open API Inspector
Open API Inspector Right-click menu, Run Frame Profiler Run Frame Profiler CTRL + A Select all events
For the purpose of moving the scrubber cursor, the following are considered action events:
For example, if you are looking for the next draw method that was called, you can press the CTRL + RIGHT ARROW on the keyboard to skip over events that are not typically of interest, and only stop on events that are considered action events.

NVIDIA® Nsight™ Application Development Environment for Heterogeneous Platforms, Visual Studio Edition User Guide Rev. 5.3.170616 ©2009-2017. NVIDIA Corporation. All Rights Reserved.