- The section Kernel Selection allows the user to configure a filter to restrict the Kernels to Profile. This filter accepts regular expressions using Perl syntax. All launches for which the kernel name matches the configured filter will be profiled. Specifically, the filter is matched against the kernel's non-mangled name (not mangled name).
In case no filter is set at all or the specified filter is invalid, all kernel launches for all kernels will be profiled. As this can pose a high performance overhead, a warning icon will be displayed.
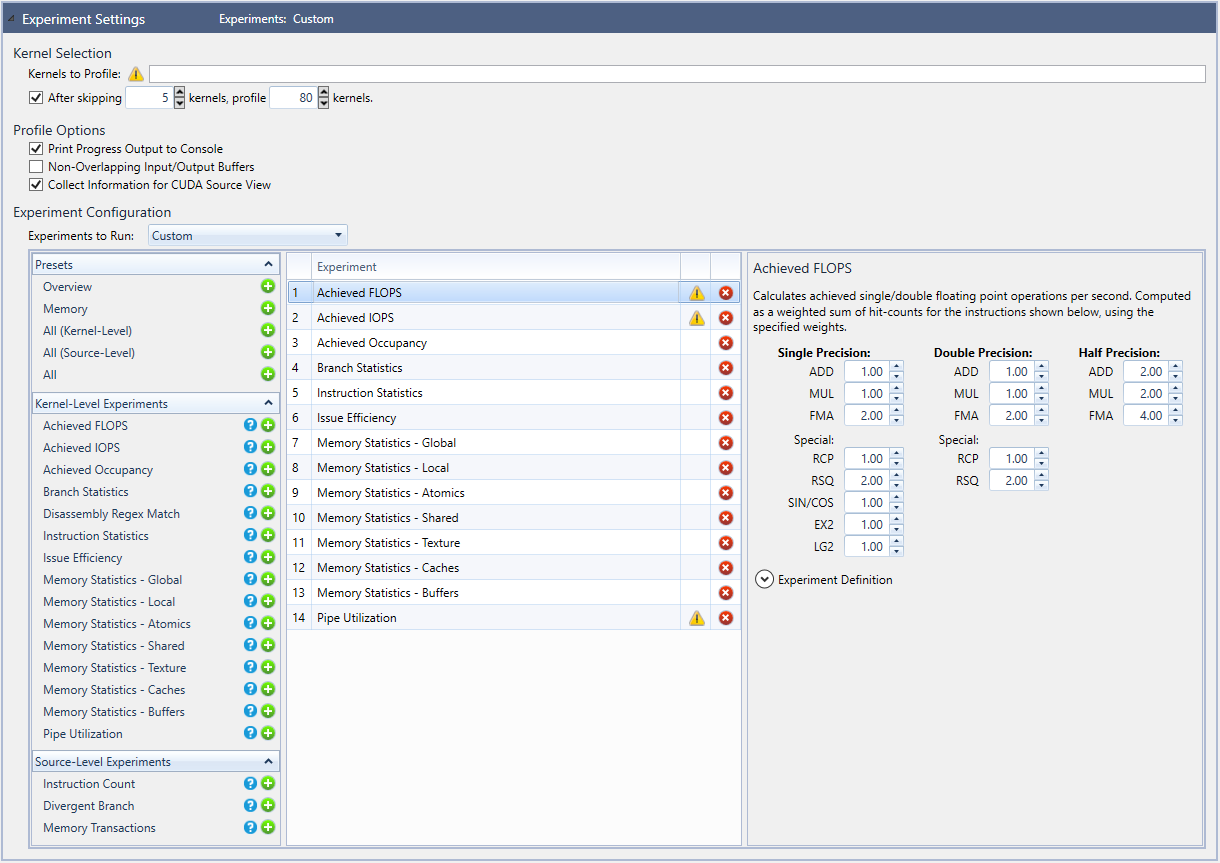
- If there is a certain number of kernels you wish to profile, you can select the checkbox After skipping N kernels, profile X kernels. This allows you to further customize the kernels that are analyzed in the final output. If the user specifies a number in the X field, the first X number of kernel launches which match the kernel filter will be profiled. Subsequent kernel launches will not be profiled, regardless of the result of the kernel filter. The counter for the capture limit is reset with each new capture session. For example, enter the following:
After skipping 5 kernels, profile 80 kernels.
In this scenario, the first 5 kernels will be skipped, then kernels 6 through 85 will be profiled.

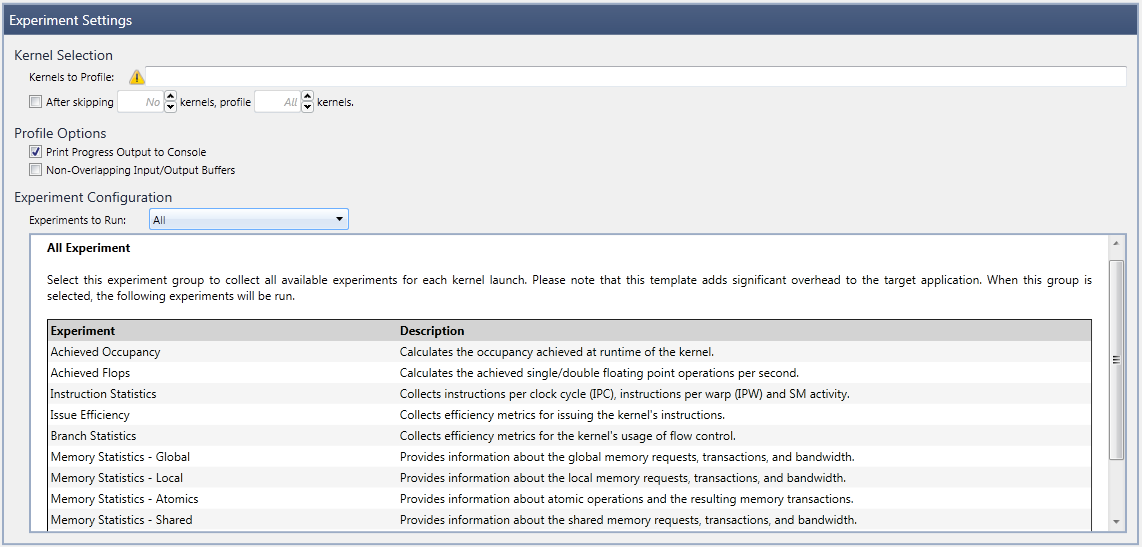
Note that the counters for skipping kernels and for limiting the profile session are applied after the Kernel RegEx Filter. In other words, kernel names that do not match the Kernel RegEx filter (if set) will not be counted toward the total number of kernels in the two fields (N kernels and X kernels) described above. - The Profile Options allow the user to configure the following parameters of a profile activity:
- Print Process Output to Console enables writing detailed information about the progress of the experiment data collection to the standard output (
stdout). - Non-Overlapping Input/Output Buffers allows you to specify that all profiled kernels do not change the contents of their input buffers during execution, or call device malloc/free or new/delete, that leave the device heap in a different state. Specifically, a kernel can malloc and free a buffer in the same launch, but it cannot call an unmatched malloc or an unmatched free. If enabled, this can vastly improve experiment collection, as there is no need to save and restore the mutable state for each experiment pass.
Note that if the option Non-Overlapping Input/Output Buffers is enabled mistakenly (that is, the profiled kernels do overwrite their input buffers or use unmatched device malloc/free), the behavior of the profiled application is completely undefined. As a consequence, the application might terminate abnormally, or the collected profile data may be invalid.
- Print Process Output to Console enables writing detailed information about the progress of the experiment data collection to the standard output (
- Under Experiment Configuration, you can define the set of profile experiments to collect. There are two different ways to specify the Experiments to Run:
- Experiment Templates are predefined groups of experiments that focus on a specific profiling task, or a certain field of interest. Upon selection of an experiment template, a short description (as well as the list of enclosed experiments) is displayed in the lower section of the activity configuration page.
- Custom Experiment Configuration allows you to manually specify the list of experiments to execute. After selecting this option, the lower portion of the experiment settings changes to the Advanced Experiment configuration.
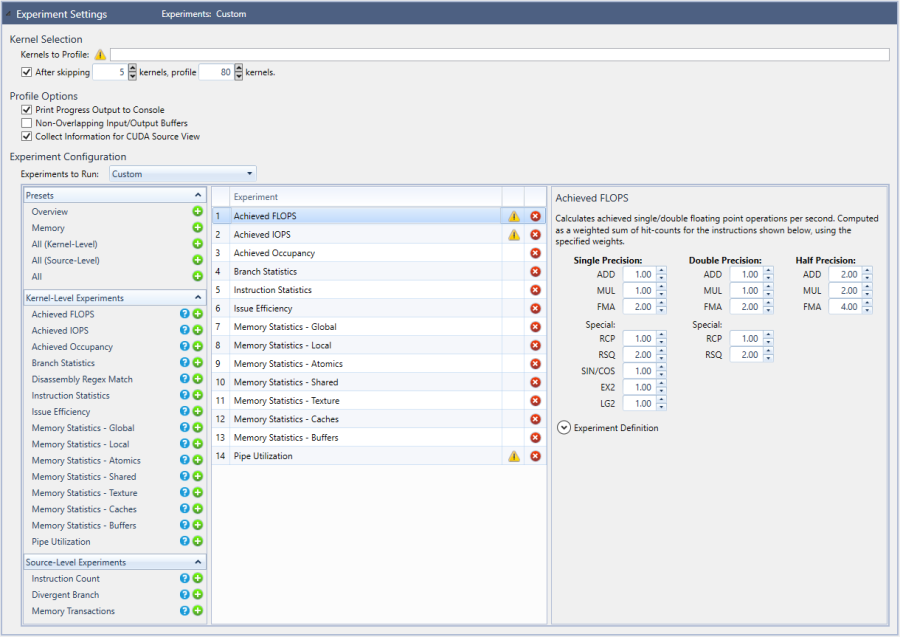
As shown here, on the left is a list that includes the available experiment templates, in addition to all available individual experiments. By selecting an item from that list, the experiment is added to the active experiments in the middle column.
Note that some experiments can be added multiple times to the middle list, while others are only allowed to be added once. For example, it is possible to collect an arbitrary number of Achieved FLOPS and Achieved IOPS experiments, all with different weight values.
All experiments in the middle section will be executed for each profiled kernel launch. Based on the experiment selection in the middle table, the right document area will show a brief summary. In addition, a few experiments expose further configuration options through the panel on the right. For example, the Achieved FLOPS experiment exposes various floating point operations with modifiable operation filtering selection and hit-count weighting.
The Achieved FLOPS and Achieved IOPS experiments are based on the Disassembly Regex experiment. Expand the Experiment Definition section in their configuration to see the underlying script used. This script can be pasted into the configuration for a Disassembly Regex experiment and used directly or modified for different behavior.