Qualification Tool#
The Qualification tool analyzes Spark events generated from CPU based Spark applications to help quantify the expected acceleration of migrating a Spark application or query to GPU.
The tool first analyzes the CPU event log and determine which operators are likely to run on the GPU. The tool then uses estimates from historical queries and benchmarks to estimate a speed-up at an individual operator level to calculate how much a specific operator would accelerate on GPU for the specific query or application. It calculates an “Estimated GPU App Duration” by adding up the accelerated operator durations along with durations that could not run on GPU because they are unsupported operators or not SQL/Dataframe.
This tool is intended to give the users a starting point and does not guarantee the queries or applications with the highest recommendation will actually be accelerated the most. Currently, it reports by looking at the amount of time spent in tasks of SQL Dataframe operations. Note that the qualification tool estimates assume that the application is run on a dedicated cluster where it can use all of the available Spark resources.
The estimations for GPU duration are available for different environments and are based on benchmarks run in the applicable environments. Here are the cluster information for the ETL benchmarks used for the estimates:
Environment |
CPU Cluster |
GPU Cluster |
|---|---|---|
On-prem |
8x 128-core |
8x 128-core + 8x A100 40 GB |
Dataproc (T4) |
4x n1-standard-32 |
4x n1-standard-32 + 8x T4 16GB |
Dataproc (L4) |
8x n1-standard-16 |
8x g2-standard-16 |
EMR |
8x m5d.8xlarge |
4x g4dn.12xlarge |
Databricks AWS |
8x m6gd.8xlage |
8x g5.8xlarge |
Databricks Azure |
8x E8ds_v4 |
8x NC8as_T4_v3 |
Note that all benchmarks were run using the NDS benchmark at SF3K (3 TB).
Important
Estimates provided by the Qualification tool are based on the currently supported “SparkPlan” or “Executor Nodes” used in the application. It currently does not handle all the expressions or datatypes used. Please refer to Understanding Execs report section and the Supported Operators guide to check the types and expressions you are using are supported.
This document covers below topics:
How to use the Qualification tool#
The Qualification tool can be run in three different ways. One is to run it as a standalone tool on the Spark event logs after the application(s) have run, the second is to be integrated into a running Spark application using explicit API calls, and the third is to install a Spark listener which can output results on a per SQL query basis.
In running the qualification tool standalone on Spark event logs, the tool can be run as a user tool command via a pip package for CSP environments (Google Dataproc, AWS EMR, Databricks AWS) or as a java application for other environments.
Running the Qualification tool standalone for CSP environments on Spark event logs#
User Tools Prerequisites and Setup for CSP environments#
Qualify CPU Workloads for Potential Cost Savings and Acceleration with GPUs#
The qualification tool will run against logs from your CSP environment and then will output the applications recommended for acceleration along with estimated speed-up and cost saving metrics.
Usage: spark_rapids_user_tools <CSP> qualification --cpu_cluster <CLUSTER> --eventlogs <EVENTLOGS-PATH>
The supported CSPs are dataproc, emr, and databricks-aws. The EVENTLOGS-PATH should be the storage location for your eventlogs. For Dataproc, it should be set to the GCS path. For EMR and Databricks-AWS, it should be set to the S3 path. THE CLUSTER can be a live cluster or a configuration file representing the cluster instances and size. More details are in the above documentation links per CSP environment
Help (to see all options available): spark_rapids_user_tools <CSP> qualification --help
Example output:
 1+----+------------+--------------------------------+----------------------+-----------------+-----------------+---------------+-----------------+
 2|    | App Name   | App ID                         | Recommendation       |   Estimated GPU |   Estimated GPU |           App |   Estimated GPU |
 3|    |            |                                |                      |         Speedup |     Duration(s) |   Duration(s) |      Savings(%) |
 4|----+------------+--------------------------------+----------------------+-----------------+-----------------+---------------+-----------------|
 5|  0 | query24    | application_1664888311321_0011 | Strongly Recommended |            3.49 |          257.18 |        897.68 |           59.70 |
 6|  1 | query78    | application_1664888311321_0009 | Strongly Recommended |            3.35 |          113.89 |        382.35 |           58.10 |
 7|  2 | query23    | application_1664888311321_0010 | Strongly Recommended |            3.08 |          325.77 |       1004.28 |           54.37 |
 8|  3 | query64    | application_1664888311321_0008 | Strongly Recommended |            2.91 |          150.81 |        440.30 |           51.82 |
 9|  4 | query50    | application_1664888311321_0003 | Recommended          |            2.47 |          101.54 |        250.95 |           43.08 |
10|  5 | query16    | application_1664888311321_0005 | Recommended          |            2.36 |          106.33 |        251.95 |           40.63 |
11|  6 | query38    | application_1664888311321_0004 | Recommended          |            2.29 |           67.37 |        154.33 |           38.59 |
12|  7 | query87    | application_1664888311321_0006 | Recommended          |            2.25 |           75.67 |        170.69 |           37.64 |
13|  8 | query51    | application_1664888311321_0002 | Recommended          |            1.53 |           53.94 |         82.63 |            8.18 |
14+----+------------+--------------------------------+----------------------+-----------------+-----------------+---------------+-----------------+
Running the Qualification tool standalone on Spark event logs#
Prerequisites#
Java 8 or above, Spark 3.0.1+ jars.
Spark event log(s) from Spark 2.0 or above version. Supports both rolled and compressed event logs with
.lz4,.lzf,.snappyand.zstdsuffixes as well as Databricks-specific rolled and compressed(.gz) event logs.The tool does not support nested directories. Event log files or event log directories should be at the top level when specifying a directory.
Note
Spark event logs can be downloaded from Spark UI using a “Download” button on the right side, or can be found in the location specified by spark.eventLog.dir. See the Apache Spark Monitoring documentation for more information.
Step 01: Download the tools jar and Apache Spark 3 Distribution#
The Qualification tool require the Spark 3.x jars to be able to run but do not need an Apache Spark run time. If you do not already have Spark 3.x installed, you can download the Spark distribution to any machine and include the jars in the classpath. - Download the latest jar from Maven repository
Spark 3.1.1 for Apache Hadoop is recommended
Step 02: Run the Qualification tool#
The Qualification tool reads the log files and process them in-memory. So the heap memory should be increased when processing large volume of events. It is recommended to pass VM options
-Xmx10gand adjust according to the number-of-apps / size-of-logs being processed.export QUALIFICATION_HEAP=-Xmx10g
Event logs stored on a local machine:
Extract the Spark distribution into a local directory if necessary.
Either set SPARK_HOME to point to that directory or just put the path inside of the classpath
java -cp toolsJar:pathToSparkJars/*:...when you run the Qualification tool.
This tool parses the Spark CPU event log(s) and creates an output report. Acceptable inputs are either individual or multiple event logs files or directories containing spark event logs in the local filesystem, HDFS, S3 or mixed.
1Usage: java ${QUALIFICATION_HEAP} \
2         -cp rapids-4-spark-tools_2.12-<version>.jar:$SPARK_HOME/jars/* \
3         com.nvidia.spark.rapids.tool.qualification.QualificationMain [options]
4         <eventlogs | eventlog directories ...>
1Sample: java ${QUALIFICATION_HEAP} \
2          -cp rapids-4-spark-tools_2.12-<version>.jar:$SPARK_HOME/jars/* \
3          com.nvidia.spark.rapids.tool.qualification.QualificationMain /usr/logs/app-name1
Event logs stored on an on-premises HDFS cluster:
Example running on files in HDFS: (include
$HADOOP_CONF_DIRin classpath)1Usage: java ${QUALIFICATION_HEAP} \ 2 -cp ~/rapids-4-spark-tools_2.12-<version>.jar:$SPARK_HOME/jars/*:$HADOOP_CONF_DIR/ \ 3 com.nvidia.spark.rapids.tool.qualification.QualificationMain /eventlogDir
Note, on an HDFS cluster, the default filesystem is likely HDFS for both the input and output so if you want to point to the local filesystem be sure to include file: in the path.
Qualification tool options#
Note
--help should be before the trailing event logs.
  1java -cp ~/rapids-4-spark-tools_2.12-<version>.jar:$SPARK_HOME/jars/*:$HADOOP_CONF_DIR/ \
  2 com.nvidia.spark.rapids.tool.qualification.QualificationMain --help
  3
  4RAPIDS Accelerator Qualification tool for Apache Spark
  5
  6Usage: java -cp rapids-4-spark-tools_2.12-<version>.jar:$SPARK_HOME/jars/*
  7       com.nvidia.spark.rapids.tool.qualification.QualificationMain [options]
  8       <eventlogs | eventlog directories ...>
  9
 10      --all                          Apply multiple event log filtering criteria
 11                                     and process only logs for which all
 12                                     conditions are satisfied.Example: <Filter1>
 13                                     <Filter2> <Filter3> --all -> result is
 14                                     <Filter1> AND <Filter2> AND <Filter3>.
 15                                     Default is all=true
 16      --any                          Apply multiple event log filtering criteria
 17                                     and process only logs for which any condition
 18                                     is satisfied.Example: <Filter1> <Filter2>
 19                                     <Filter3> --any -> result is <Filter1> OR
 20                                     <Filter2> OR <Filter3>
 21  -a, --application-name  <arg>      Filter event logs by application name. The
 22                                     string specified can be a regular expression,
 23                                     substring, or exact match. For filtering
 24                                     based on complement of application name, use
 25                                     ~APPLICATION_NAME. i.e Select all event logs
 26                                     except the ones which have application name
 27                                     as the input string.
 28  -f, --filter-criteria  <arg>       Filter newest or oldest N eventlogs based on
 29                                     application start timestamp, unique
 30                                     application name or filesystem timestamp.
 31                                     Filesystem based filtering happens before any
 32                                     application based filtering.For application
 33                                     based filtering, the order in which filters
 34                                     areapplied is: application-name,
 35                                     start-app-time, filter-criteria.Application
 36                                     based filter-criteria are:100-newest (for
 37                                     processing newest 100 event logs based on
 38                                     timestamp insidethe eventlog) i.e application
 39                                     start time)  100-oldest (for processing
 40                                     oldest 100 event logs based on timestamp
 41                                     insidethe eventlog) i.e application start
 42                                     time)  100-newest-per-app-name (select at
 43                                     most 100 newest log files for each unique
 44                                     application name) 100-oldest-per-app-name
 45                                     (select at most 100 oldest log files for each
 46                                     unique application name)Filesystem based
 47                                     filter criteria are:100-newest-filesystem
 48                                     (for processing newest 100 event logs based
 49                                     on filesystem timestamp).
 50                                     100-oldest-filesystem (for processing oldest
 51                                     100 event logsbased on filesystem timestamp).
 52  -h, --html-report                  Default is to generate an HTML report.
 53      --no-html-report               Disables generating the HTML report.
 54  -m, --match-event-logs  <arg>      Filter event logs whose filenames contain the
 55                                     input string. Filesystem based filtering
 56                                     happens before any application based
 57                                     filtering.
 58      --max-sql-desc-length  <arg>   Maximum length of the SQL description
 59                                     string output with the per sql output.
 60                                     Default is 100.
 61      --ml-functions                 Report if there are any SparkML or Spark XGBoost
 62                                     functions in the eventlog.
 63  -n, --num-output-rows  <arg>       Number of output rows in the summary report.
 64                                     Default is 1000.
 65      --num-threads  <arg>           Number of thread to use for parallel
 66                                     processing. The default is the number of
 67                                     cores on host divided by 4.
 68      --order  <arg>                 Specify the sort order of the report. desc or
 69                                     asc, desc is the default. desc (descending)
 70                                     would report applications most likely to be
 71                                     accelerated at the top and asc (ascending)
 72                                     would show the least likely to be accelerated
 73                                     at the top.
 74  -o, --output-directory  <arg>      Base output directory. Default is current
 75                                     directory for the default filesystem. The
 76                                     final output will go into a subdirectory
 77                                     called rapids_4_spark_qualification_output.
 78                                     It will overwrite any existing directory with
 79                                     the same name.
 80  -p, --per-sql                      Report at the individual SQL query level.
 81      --platform  <arg>              Cluster platform where Spark CPU workloads were
 82                                     executed. Options include onprem, dataproc-t4,
 83                                     dataproc-l4, emr, databricks-aws, and
 84                                     databricks-azure.
 85                                     Default is onprem.
 86  -r, --report-read-schema           Whether to output the read formats and
 87                                     datatypes to the CSV file. This can be very
 88                                     long. Default is false.
 89      --spark-property  <arg>...     Filter applications based on certain Spark
 90                                     properties that were set during launch of the
 91                                     application. It can filter based on key:value
 92                                     pair or just based on keys. Multiple configs
 93                                     can be provided where the filtering is done
 94                                     if any of theconfig is present in the
 95                                     eventlog. filter on specific configuration:
 96                                     --spark-property=spark.eventLog.enabled:truefilter
 97                                     all eventlogs which has config:
 98                                     --spark-property=spark.driver.portMultiple
 99                                     configs:
100                                     --spark-property=spark.eventLog.enabled:true
101                                     --spark-property=spark.driver.port
102  -s, --start-app-time  <arg>        Filter event logs whose application start
103                                     occurred within the past specified time
104                                     period. Valid time periods are
105                                     min(minute),h(hours),d(days),w(weeks),m(months).
106                                     If a period is not specified it defaults to
107                                     days.
108  -t, --timeout  <arg>               Maximum time in seconds to wait for the event
109                                     logs to be processed. Default is 24 hours
110                                     (86400 seconds) and must be greater than 3
111                                     seconds. If it times out, it will report what
112                                     it was able to process up until the timeout.
113  -u, --user-name  <arg>             Applications which a particular user has
114                                     submitted.
115      --help                         Show help message
116
117 trailing arguments:
118  eventlog (required)   Event log filenames(space separated) or directories
119                        containing event logs. eg: s3a://<BUCKET>/eventlog1
120                        /path/to/eventlog2
Example commands:
Process the 10 newest logs, and only output the top 3 in the output:
1java ${QUALIFICATION_HEAP} \
2  -cp ~/rapids-4-spark-tools_2.12-<version>.jar:$SPARK_HOME/jars/*:$HADOOP_CONF_DIR/ \
3  com.nvidia.spark.rapids.tool.qualification.QualificationMain -f 10-newest -n 3 /eventlogDir
Process last 100 days’ logs:
1java ${QUALIFICATION_HEAP} \
2  -cp ~/rapids-4-spark-tools_2.12-<version>.jar:$SPARK_HOME/jars/*:$HADOOP_CONF_DIR/ \
3  com.nvidia.spark.rapids.tool.qualification.QualificationMain -s 100d /eventlogDir
Process only the newest log with the same application name:
1java ${QUALIFICATION_HEAP} \
2  -cp ~/rapids-4-spark-tools_2.12-<version>.jar:$SPARK_HOME/jars/*:$HADOOP_CONF_DIR/ \
3  com.nvidia.spark.rapids.tool.qualification.QualificationMain -f 1-newest-per-app-name /eventlogDir
Parse ML functions from the eventlog:
1java ${QUALIFICATION_HEAP} \
2  -cp ~/rapids-4-spark-tools_2.12-<version>.jar:$SPARK_HOME/jars/*:$HADOOP_CONF_DIR/ \
3  com.nvidia.spark.rapids.tool.qualification.QualificationMain --ml-functions /eventlogDir
Note
The “regular expression” used by -a option is based on java.util.regex.Pattern.
The Qualification tool output#
After the above command is executed, the summary report goes to STDOUT and by default it outputs log/CSV files under ./rapids_4_spark_qualification_output/ that contain the processed applications. The output will go into your default filesystem and it supports both local filesystem and HDFS. Note that if you are on an HDFS cluster the default filesystem is likely HDFS for both the input and output. If you want to point to the local filesystem be sure to include file: in the path.
The Qualification tool generates a brief summary on the STDOUT, which also gets saved as a text file. The detailed report of the processed apps is saved as a set of CSV files that can be used for post-processing. The CSV reports include the estimated performance if the app is run on the GPU for each of the following: app execution; stages; and execs.
Starting with release “22.06”, the default is to generate the report into two different formats: text files; and HTML.
The tree structure of the output directory ${OUTPUT_FOLDER}/rapids_4_spark_qualification_output is as follows:
 1    rapids_4_spark_qualification_output
 2    ├── rapids_4_spark_qualification_output.csv
 3    ├── rapids_4_spark_qualification_output.log
 4    ├── rapids_4_spark_qualification_output_persql.log
 5    ├── rapids_4_spark_qualification_output_persql.csv
 6    ├── rapids_4_spark_qualification_output_execs.csv
 7    ├── rapids_4_spark_qualification_output_stages.csv
 8    ├── rapids_4_spark_qualification_output_mlfunctions.csv
 9    ├── rapids_4_spark_qualification_output_mlfunctions_totalduration.csv
10    └── ui
11        ├── assets
12        │   ├── bootstrap/
13        │   ├── datatables/
14        │   ├── jquery/
15        │   ├── mustache-js/
16        │   └── spur/
17        ├── css
18        │   └── rapids-dashboard.css
19        ├── html
20        │   ├── application.html
21        │   ├── index.html
22        │   ├── raw.html
23        │   └── sql-recommendation.html
24        └── js
25            ├── app-report.js
26            ├── data-output.js
27            ├── per-sql-report.js
28            ├── qual-report.js
29            ├── raw-report.js
30            ├── ui-config.js
31            └── uiutils.js
For information on the files content and processing the Qualification report and the recommendation, please refer to Understanding the Qualification tool output and Output Formats sections below.
Running using a Spark Listener#
We provide a Spark Listener that can be installed at application start that will produce output for each SQL queries in the running application and indicate if that query is a good fit to try with the Rapids Accelerator for Spark.
Prerequisites#
Java 8 or above, Spark 3.0.1+
Download the tools jar#
Download the latest jar from Maven repository
Configuration#
Add the RunningQualificationEventProcess to the spark listeners configuration: spark.extraListeners=org.apache.spark.sql.rapids.tool.qualification.RunningQualificationEventProcessor
The user should specify the output directory if they want the output to go to separate files, otherwise it will go to the Spark driver log. If the output directory is specified, it outputs two different files, one csv and one pretty printed log file. The output directory can be a local directory or point to a distributed file system or blobstore like S3.
spark.rapids.qualification.outputDir
By default, this will output results for 10 SQL queries per file and will keep 100 files. This behavior is because many blob stores don’t show files until they are fully written so you wouldn’t be able to see the results for a running application until it finishes the number of SQL queries per file. This behavior can be configured with the following configs.
spark.rapids.qualification.output.numSQLQueriesPerFiledefault 10
spark.rapids.qualification.output.maxNumFilesdefault 100
Run the Spark application#
Run the application and include the tools jar, spark.extraListeners config and optionally the other configs to control the tools behavior.
For example:
1$SPARK_HOME/bin/spark-shell \
2--jars rapids-4-spark-tools_2.12-<version>.jar \
3--conf spark.extraListeners=org.apache.spark.sql.rapids.tool.qualification.RunningQualificationEventProcessor \
4--conf spark.rapids.qualification.outputDir=/tmp/qualPerSqlOutput \
5--conf spark.rapids.qualification.output.numSQLQueriesPerFile=5 \
6--conf spark.rapids.qualification.output.maxNumFiles=10
After running some SQL queries you can look in the output directory and see files like:
1rapids_4_spark_qualification_output_persql_0.csv
2rapids_4_spark_qualification_output_persql_0.log
3rapids_4_spark_qualification_output_persql_1.csv
4rapids_4_spark_qualification_output_persql_1.log
5rapids_4_spark_qualification_output_persql_2.csv
6rapids_4_spark_qualification_output_persql_2.log
See the Understanding the Qualification tool output section on the file contents details.
Running the Qualification tool inside a running Spark application using the API#
Prerequisites#
Java 8 or above, Spark 3.0.1+
Download the tools jar#
Download the latest jar from Maven repository
Modify your application code to call the api’s#
Currently only Scala api’s are supported. Note this does not support reporting at the per sql level currently. This can be done manually by just wrapping and reporting around those queries instead of the entire application.
Create the RunningQualicationApp:
val qualApp = new com.nvidia.spark.rapids.tool.qualification.RunningQualificationApp()
Get the event listener from it and install it as a Spark listener:
1val listener = qualApp.getEventListener
2spark.sparkContext.addSparkListener(listener)
Run your queries and then get the summary or detailed output to see the results.
The summary output api:
1/**
2 * Get the summary report for qualification.
3 * @param delimiter The delimiter separating fields of the summary report.
4 * @param prettyPrint Whether to including the separate at start and end and
5 *                    add spacing so the data rows align with column headings.
6 * @return String of containing the summary report.
7 */
8getSummary(delimiter: String = "|", prettyPrint: Boolean = true): String
The detailed output api:
1/**
2 * Get the detailed report for qualification.
3 * @param delimiter The delimiter separating fields of the summary report.
4 * @param prettyPrint Whether to including the separate at start and end and
5 *                    add spacing so the data rows align with column headings.
6 * @return String of containing the detailed report.
7 */
8getDetailed(delimiter: String = "|", prettyPrint: Boolean = true, reportReadSchema: Boolean = false): String
Example:
 1// run your sql queries ...
 2
 3// To get the summary output:
 4val summaryOutput = qualApp.getSummary()
 5
 6// To get the detailed output:
 7val detailedOutput = qualApp.getDetailed()
 8
 9// print the output somewhere for user to see
10println(summaryOutput)
11println(detailedOutput)
If you need to specify the tools jar as a maven dependency to compile the Spark application:
1<dependency>
2   <groupId>com.nvidia</groupId>
3   <artifactId>rapids-4-spark-tools_2.12</artifactId>
4   <version>${version}</version>
5</dependency>
Run the Spark application#
Run your Spark application and include the tools jar you downloaded with the spark ‘–jars’ options and view the output wherever you had it printed.
For example, if running the spark-shell:
$SPARK_HOME/bin/spark-shell --jars rapids-4-spark-tools_2.12-<version>.jar
Understanding the Qualification tool output#
For each processed Spark application, the Qualification tool generates two main fields to help quantify the expected acceleration of migrating a Spark application or query to GPU.
Estimated GPU Duration: predicted runtime of the app if it was run on GPU. It is the sum of the accelerated operator durations and ML functions duration(if applicable) along with durations that could not run on GPU because they are unsupported operators or not SQL/Dataframe.Estimated Speed-up: the estimated speed-up is simply the original CPU duration of the app divided by the estimated GPU duration. That will estimate how much faster the application would run on GPU.
The lower the estimated GPU duration, the higher the “Estimated Speed-up”. The processed applications or queries are ranked by the “Estimated Speed-up”. Based on how high the estimated speed-up, the tool classifies the applications into the following different categories:
Strongly RecommendedRecommendedNot RecommendedNot Applicable: indicates that the app has job or stage failures.
As mentioned before, the tool does not guarantee the applications or queries with the highest recommendation will actually be accelerated the most. Please refer to Supported Operators section.
In addition to the recommendation, the Qualification tool reports a set of metrics in tasks of SQL Dataframe operations within the scope of: “Entire App”; “Stages”; and “Execs”. The report is divided into three main levels. The fields of each level are described in details in the following sections: Detailed App Report, Stages report, and Execs report. Then we describe the output formats and their file locations in Output Formats section.
There is an option to print a report at the SQL query level in addition to the application level.
Detailed App report#
The report represents the entire app execution, including unsupported operators and non-SQL operations.
App Name
App ID
Recommendation: recommendation based on
Estimated Speed-up Factor, where an app can be “Strongly Recommended”, “Recommended”, “Not Recommended”, or “Not Applicable”. The latter indicates that the app has job or stage failures.App Duration: wall-Clock time measured since the application starts till it is completed. If an app is not completed an estimated completion time would be computed.
SQL DF duration: wall-Clock time duration that includes only SQL-Dataframe queries.
GPU Opportunity: wall-Clock time that shows how much of the SQL duration and ML functions(if applicable) can be accelerated on the GPU.
Estimated GPU Duration: predicted runtime of the app if it was run on GPU. It is the sum of the accelerated operator durations and ML functions durations(if applicable) along with durations that could not run on GPU because they are unsupported operators or not SQL/Dataframe.
Estimated GPU Speed-up: the speed-up is simply the original CPU duration of the app divided by the estimated GPU duration. That will estimate how much faster the application would run on GPU.
Estimated GPU Time Saved: estimated wall-Clock time saved if it was run on the GPU.
SQL Dataframe Task Duration: amount of time spent in tasks of SQL Dataframe operations.
Executor CPU Time Percent: this is an estimate at how much time the tasks spent doing processing on the CPU vs waiting on IO. This is not always a good indicator because sometimes the IO that is encrypted and the CPU has to do work to decrypt it, so the environment you are running on needs to be taken into account.
SQL Ids with Failures: SQL Ids of queries with failed jobs.
Unsupported Read File Formats and Types: looks at the Read Schema and reports the file formats along with types which may not be fully supported. Example:
JDBC[*]. Note that this is based on the current version of the plugin and future versions may add support for more file formats and types.Unsupported Write Data Format: reports the data format which we currently don’t support, i.e. if the result is written in JSON or CSV format.
Complex Types: looks at the Read Schema and reports if there are any complex types(array, struct or maps) in the schema.
Nested Complex Types: nested complex types are complex types which contain other complex types (Example:
array<struct<string,string>>). Note that it can read all the schemas for DataSource V1. The Data Source V2 truncates the schema, so if you see “...”, then the full schema is not available. For such schemas we read until...and report if there are any complex types and nested complex types in that.Potential Problems: some UDFs and nested complex types. Please keep in mind that the tool is only able to detect certain issues.
Longest SQL Duration: the maximum amount of time spent in a single task of SQL Dataframe operations.
NONSQL Task Duration Plus Overhead: Time duration that does not span any running SQL task.
Unsupported Task Duration: sum of task durations for any unsupported operators.
Supported SQL DF Task Duration: sum of task durations that are supported by RAPIDS GPU acceleration.
Task Speedup Factor: the average speed-up of all stages.
App Duration Estimated: True or False indicates if we had to estimate the application duration. If we had to estimate it, the value will be
Trueand it means the event log was missing the application finished event, so we will use the last job or sql execution time we find as the end time used to calculate the duration.Unsupported Execs: reports all the execs that are not supported by GPU in this application. Note that an Exec name may be printed in this column if any of the expressions within this Exec is not supported by GPU. If the resultant string exceeds maximum limit (25), then … is suffixed to the STDOUT and full output can be found in the CSV file.
Unsupported Expressions: reports all expressions not supported by GPU in this application.
Read Schema: shows the datatypes and read formats. This field is only listed when the argument
--report-read-schemais passed to the CLI.Estimated Frequency: application executions per month assuming uniform distribution, default frequency is daily (30 times per month) and minimum frequency is monthly (1 time per month). For a given log set, determines a logging window using the earliest start time and last end time of all logged applications. Counts the number of executions of a specific
App Nameover the logging window and converts the frequency to per month (30 days). Applications that are only ran once are assigned the default frequency.
Note
The Qualification tool won’t catch all UDFs, and some of the UDFs can be handled with additional steps. Please refer to Supported Operators for more details on UDF.
By default, the applications and queries are sorted in descending order by the following fields:
Recommendation
Estimated GPU Speed-up
Estimated GPU Time Saved
End Time
Stages report#
For each stage used in SQL operations, the Qualification tool generates the following information:
App ID
Stage ID
Average Speedup Factor: the average estimated speed-up of all the operators in the given stage.
Stage Task Duration: amount of time spent in tasks of SQL Dataframe operations for the given stage.
Unsupported Task Duration: sum of task durations for the unsupported operators. For more details, see Supported Operators.
Stage Estimated: True or False indicates if we had to estimate the stage duration.
Execs report#
The Qualification tool generates a report of the “Exec” in the “SparkPlan” or “Executor Nodes” along with the estimated acceleration on the GPU. Please refer to the Supported Operators guide for more details on limitations on UDFs and unsupported operators.
App ID
SQL ID
Exec Name: example
Filter,HashAggregateExpression Name
Task Speedup Factor: it is simply the average acceleration of the operators based on the original CPU duration of the operator divided by the GPU duration. The tool uses historical queries and benchmarks to estimate a speed-up at an individual operator level to calculate how much a specific operator would accelerate on GPU.
Exec Duration: wall-Clock time measured since the operator starts till it is completed.
SQL Node Id
Exec Is Supported: whether the Exec is supported by RAPIDS or not. Please refer to the Supported Operators section.
Exec Stages: an array of stage IDs
Exec Children
Exec Children Node Ids
Exec Should Remove: whether the Op is removed from the migrated plan.
Parsing Expressions within each Exec
The Qualification tool looks at the expressions in each Exec to provide a fine-grained assessment of RAPIDS’ support.
Note that it is not possible to extract the expressions for each available Exec: - some Execs do not take any expressions, and - some execs may not show the expressions in the eventlog.
The following table lists the exec’s name and the status of parsing their expressions where: - “Expressions Unavailable” marks the Execs that do not show expressions in the eventlog - “Fully Parsed” marks the Execs that have their expressions fully parsed by the Qualification tool - “In Progress” marks the Execs that are still being investigated; therefore, a set of the marked Execs may be fully parsed in future releases.
Exec |
Expressions Unavailable |
Fully Parsed |
In Progress |
|---|---|---|---|
AggregateInPandasExec |
x |
||
AQEShuffleReadExec |
x |
||
ArrowEvalPythonExec |
x |
||
BatchScanExec |
x |
||
BroadcastExchangeExec |
x |
||
BroadcastHashJoinExec |
x |
||
BroadcastNestedLoopJoinExec |
x |
||
CartesianProductExec |
x |
||
CoalesceExec |
x |
||
CollectLimitExec |
x |
||
CreateDataSourceTableAsSelectCommand |
x |
||
CustomShuffleReaderExec |
x |
||
DataWritingCommandExec |
x |
||
ExpandExec |
x |
||
FileSourceScanExec |
x |
||
FilterExec |
x |
||
FlatMapGroupsInPandasExec |
x |
||
GenerateExec |
x |
||
GlobalLimitExec |
x |
||
HashAggregateExec |
x |
||
InMemoryTableScanExec |
x |
||
InsertIntoHadoopFsRelationCommand |
x |
||
LocalLimitExec |
x |
||
MapInPandasExec |
x |
||
ObjectHashAggregateExec |
x |
||
ProjectExec |
x |
||
RangeExec |
x |
||
SampleExec |
x |
||
ShuffledHashJoinExec |
x |
||
ShuffleExchangeExec |
x |
||
SortAggregateExec |
x |
||
SortExec |
x |
||
SortMergeJoinExec |
x |
||
SubqueryBroadcastExec |
x |
||
TakeOrderedAndProjectExec |
x |
||
UnionExec |
x |
||
WindowExec |
x |
||
WindowInPandasExec |
x |
MLFunctions report#
The Qualification tool generates a report if there are SparkML or Spark XGBoost functions used in the eventlog. The functions in “spark.ml.” or “spark.XGBoost.” packages are displayed in the report.
App ID
Stage ID
ML Functions: List of ML functions used in the corresponding stage.
Stage Task Duration: amount of time spent in tasks containing ML functions for the given stage.
MLFunctions total duration report#
The Qualification tool generates a report of total duration across all
App ID
_Stage_Ids : Stage Id’s corresponding to the given ML function.
ML Function Name: ML function name supported on GPU.
Total Duration: total duration across all stages for the corresponding ML function.
Output Formats#
The Qualification tool generates the output as CSV/log files. Starting from “22.06”, the default is to generate the report into two different formats: CSV/log files; and HTML.
HTML Report#
Starting with release “22.06”, the HTML report is generated by default under the output directory ${OUTPUT_FOLDER}/rapids_4_spark_qualification_output/ui. The HTML report is disabled by passing --no-html-report as described in the Qualification tool options section above. To browse the content of the html report:
For HDFS or remote node, copy the directory of
${OUTPUT_FOLDER}/rapids_4_spark_qualification_output/uito your local node.Open
rapids_4_spark_qualification_output/ui/index.htmlin your local machine’s web-browser (Chrome/Firefox are recommended).
The HTML view renders the detailed information into tables that allow following features:
searching
ordering by specific column
exporting table into CSV file
interactive filter by recommendations and/or user-name.
By default, all tables show 20 entries per page, which can be changed by selecting a different page-size in the table’s navigation bar.
The following sections describe the HTML views.
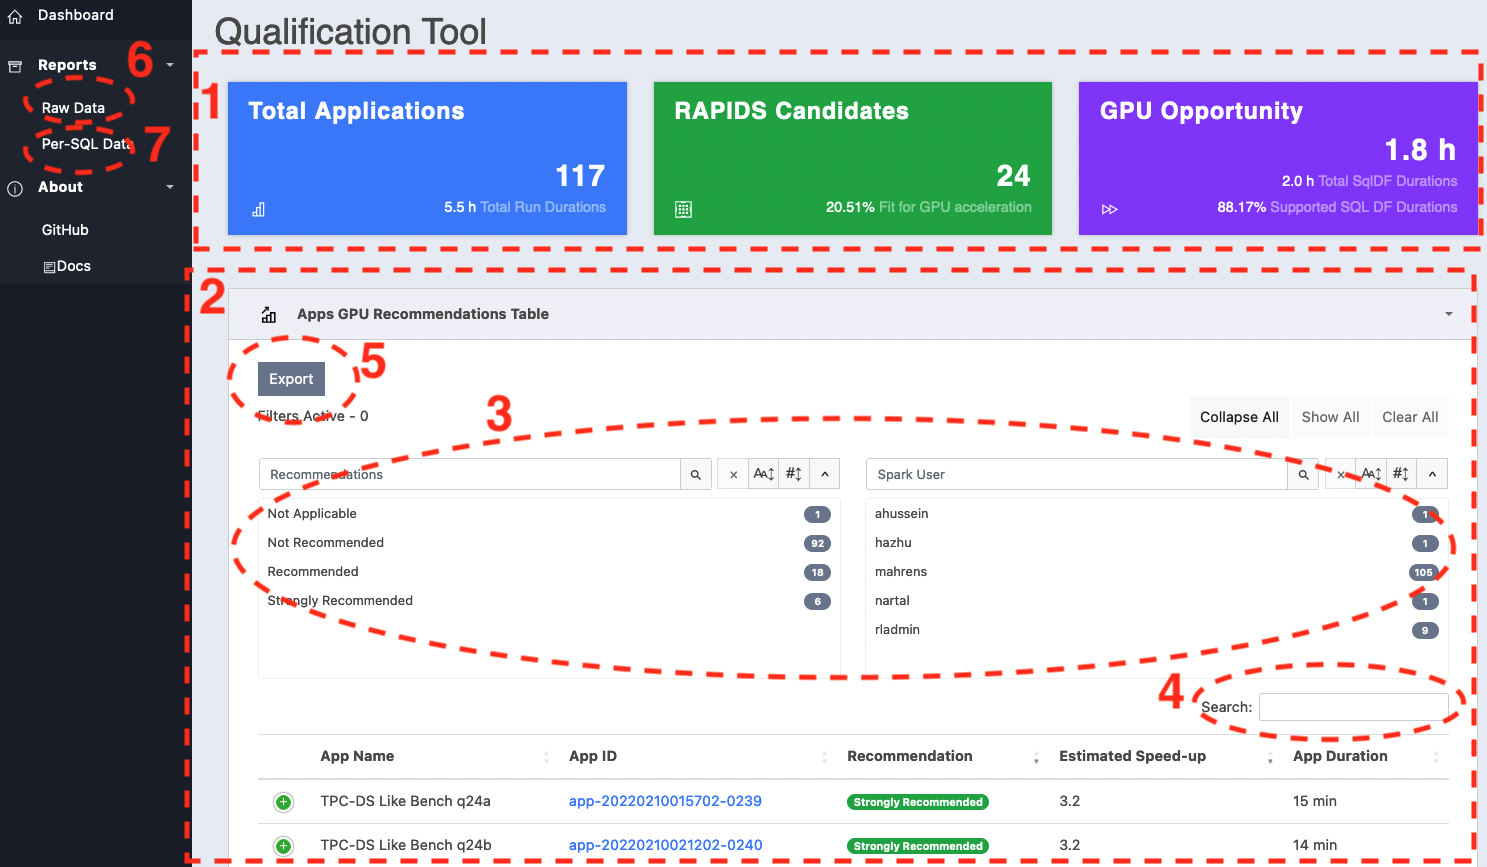
Application Recommendations Summary#
index.html shows the summary of the estimated GPU performance. The “GPU Recommendations Table” lists the processed applications ranked by the “Estimated GPU Speed-up” along with the ability to search, and filter the results. By clicking the “App ID” link of a specific app, you navigate to the details view of that app which is described in App-Details View section.
The summary report contains the following components:
Stats-Row: statistics card summarizing the following information:
“Total Applications”: total number of applications analyzed by the Qualification tool and the total execution time.
“RAPIDS Candidates”: marks the number applications that are either “Recommended”, or “Strongly Recommended”.
“GPU Opportunity”: shows the total of “GPU Opportunity” and “SQL DF duration” fields across all the apps.
GPU Recommendations Table: this table lists all the analyzed applications along with subset of fields that are directly involved in calculating the GPU performance estimate. Each row expands showing more fields by clicking on the control column.
The searchPanes with the capability to search the app list by selecting rows in the panes. The “Recommendations” and “Spark User” filters are cascaded which allows the panes to be filtered based on the values selected in the other pane.
Text Search field that allows further filtering, removing data from the result set as keywords are entered. The search box will match on multiple columns including: “App ID”, “App Name”, “Recommendation”
HTML5 export button saves the table to CSV file into the browser’s default download folder.
The
Raw Datalink in the left navigation bar redirects to a detailed report.The
Per-SQL Datalink in the left navigation bar redirects to a summary report that shows the per-SQL estimated GPU performance.
Qualification-HTML-Recommendation-View#
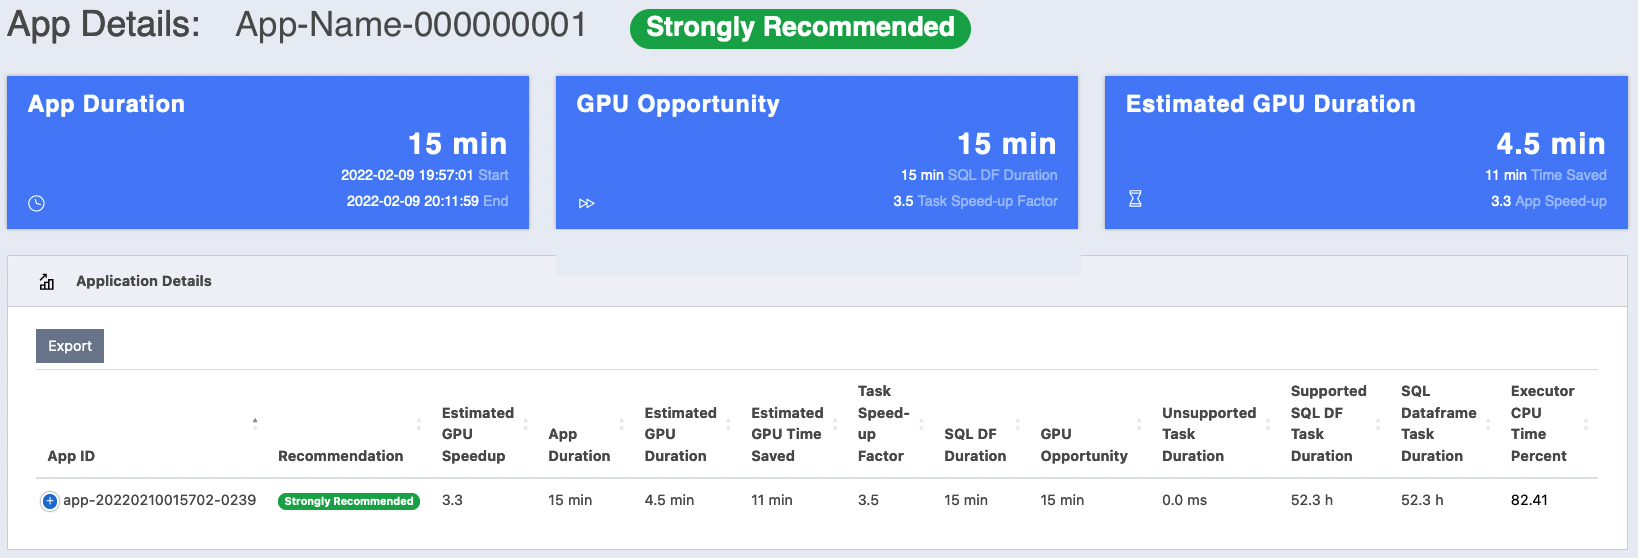
App-Details View#
When you click the “App ID” of a specific row in the “GPU Recommendations Table”, the browser navigates to this view which shows the metrics and estimated GPU performance for the given application. It contains the following main components:
Card title: contains the application name and the Recommendation.
Stats-Row: statistics card summarizing the following information:
“App Duration”: the total execution time of the app, marking the start and end time.
“GPU Opportunity”: the wall-Clock time that shows how much of the SQL duration can be accelerated on the GPU. It shows the actual wall-Clock time duration that includes only SQL-Dataframe queries including non-supported ops, dubbed “SQL DF Duration”. This is followed by “Task Speed-up Factor” which represents the average speed-up of all app stages.
“Estimated GPU Duration”: the predicted runtime of the app if it was run on GPU. For convenience, it calculates the estimated wall-clock time difference between the CPU and GPU executions. The original CPU duration of the app divided by the estimated GPU duration and displayed as “App Speed-up”.
Application Details: this table lists all the fields described previously in the Detailed App report section. Note that this table has more columns than can fit in a normal browser window. Therefore, the UI application dynamically optimizes the layout of the table to fit the browser screen. By clicking on the control column, the row expands to show the remaining hidden columns.
Stage Details Table: lists all the app stages with set of columns listed in Stages report section. The HTML5 export button saves the table to CSV file into the browser’s default download folder.
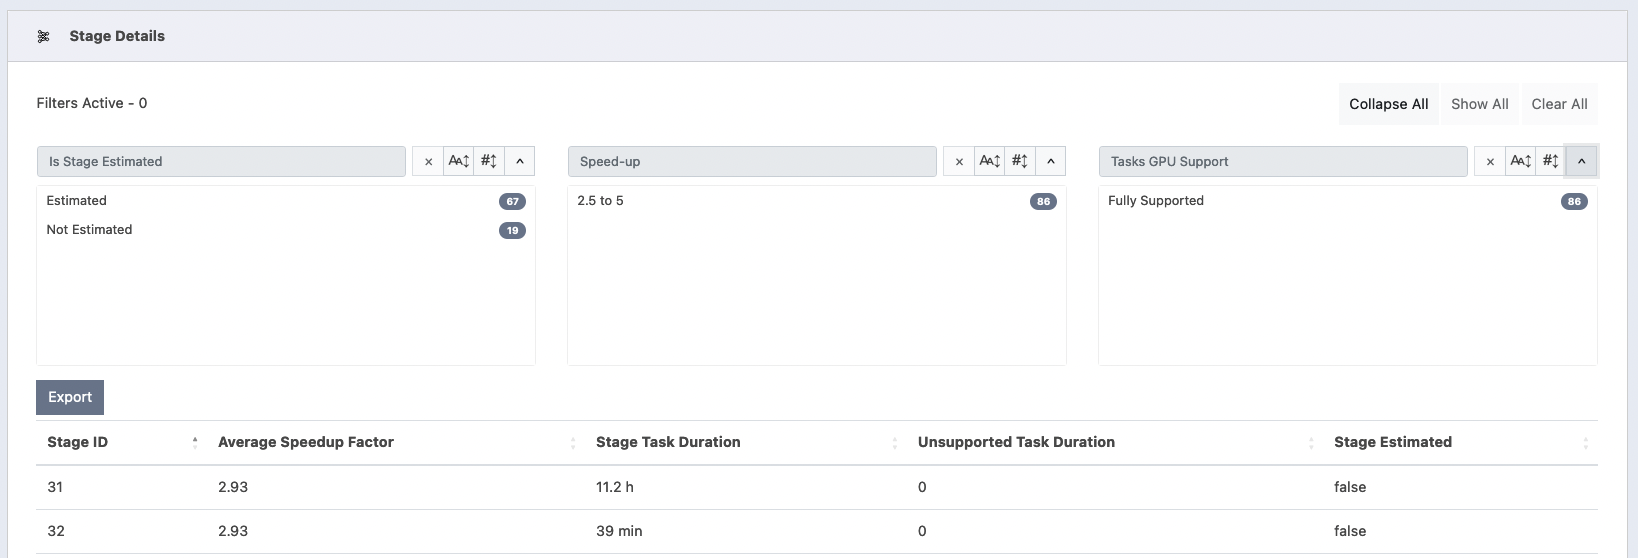
The table has cascaded searchPanes, which means that the table allows the panes to be filtered based on the values selected in the other panes.
There are three searchPanes:
“Is Stage Estimated”: it splits the stages into two groups based on whether the stage duration time was estimated or not.
“Speed-up”: groups the stages by their “average speed-up”. Each stage can belong to one of the following predefined speed-up ranges:
1.0 (No Speed-up);]1.0, 1.3[;[1.3, 2.5[;[2.5, 5[; and[5, _]. The search-pane does not show a range bucket if its count is 0.“Tasks GPU Support”: this filter can be used to find stages having all their execs supported by the GPU.
Execs Details Table: lists all the app Execs with set of columns listed in Execs report section. The HTML5 export button saves the table to CSV file into the browser’s default download folder.
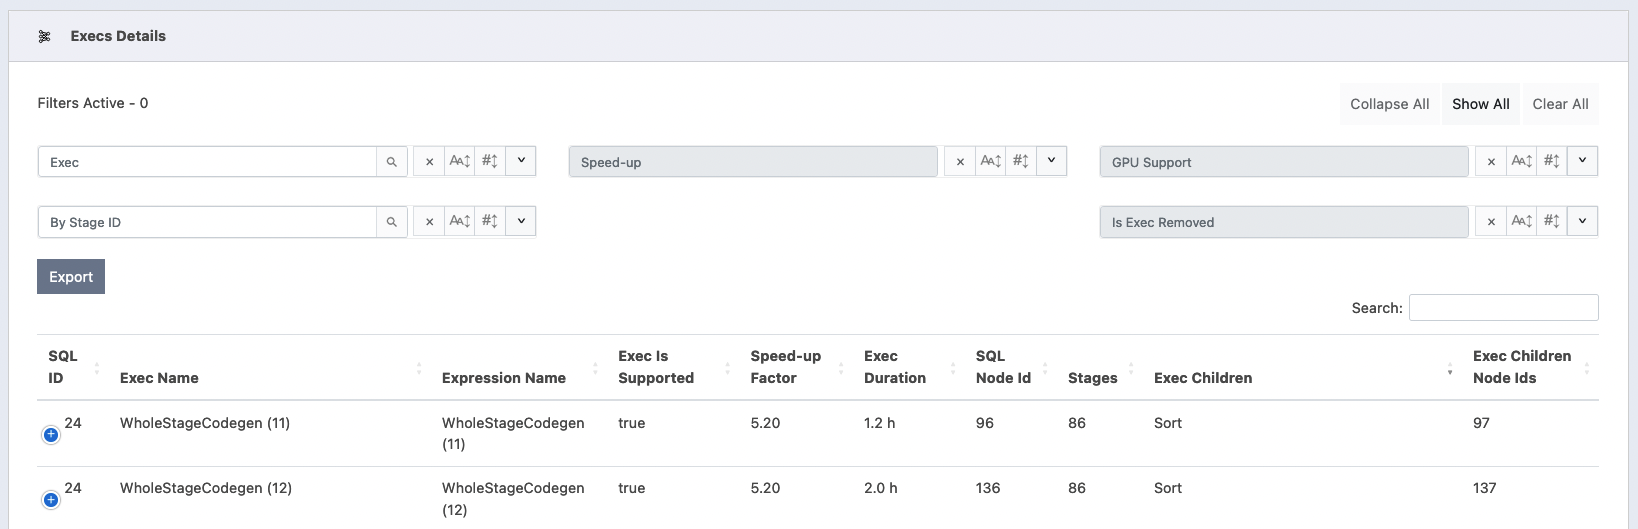
The table has cascaded searchPanes, which means that the table allows the panes to be filtered based on the values selected in the other panes.
There are three searchPanes:
“Exec”: filters the rows by exec name. This filter also allows text searching by typing into the filter-title as a text input.
“Speed-up”: groups the stages by their “average speed-up”. Each stage can belong to one of the following predefined speed-up ranges:
1.0 (No Speed-up);]1.0, 1.3[;[1.3, 2.5[;[2.5, 5[; and[5, _]. The search-pane does not show a range bucket if its count is 0.“GPU Support”: filters the execs whether an exec is supported by GPU or not.
“Stage ID”: filters rows by the stage ID. It also allows text-searching by typing into the filter-title as a text input.
“Is Exec Removed”: filters rows that were removed from the migrated plan.
SQL Details Table: lists Per-SQL GPU recommendation. The HTML5 export button saves the table to CSV file into the browser’s default download folder. The rows in the table can be filtered by “SQL Description”, “SQL ID”, or “Recommendation”.
Raw Data#
raw.html displays all the fields listed in “Detailed App Report” in more readable format. Columns representing “time duration” are rounded to nearest “ms”, “seconds”, “minutes”, and “hours”. The search box will match on multiple columns including: “App ID”, “App Name”, “Recommendation”, “User Name”, “Unsupported Write Data Format”, “Complex Types”, “Nested Complex Types”, and “Read Schema”. The detailed table can also be exported as a CSV file into the browser’s default download folder.
Note that this table has more columns than can fit in a normal browser window. Therefore, the UI application dynamically optimizes the layout of the table to fit the browser screen. By clicking on the control column, the row expands to show the remaining hidden columns.
Per-SQL Data#
sql-recommendation.html displays a summary of the estimate GPU performance for each query. Note that the SQL queries across all the apps are combined in a single view; therefore, the “SQL ID” field may not be unique.
Text and CSV files#
The Qualification tool generates a set of log/CSV files in the output folder ${OUTPUT_FOLDER}/rapids_4_spark_qualification_output. The content of each file is summarized in the following two sections.
Application Report Summary#
The Qualification tool generates a brief summary that includes the projected application’s performance if the application is run on the GPU. Beside sending the summary to STDOUT, the Qualification tool generates text as rapids_4_spark_qualification_output.log
The summary report outputs the following information: “App Name”, “App ID”, “App Duration”, “SQL DF duration”, “GPU Opportunity”, “Estimated GPU Duration”, “Estimated GPU Speed-up”, “Estimated GPU Time Saved”, and “Recommendation”.
Note
The duration(s) reported are in milliseconds. Sample output in text:
 1+------------+--------------+----------+----------+-------------+-----------+-----------+-----------+--------------------+-------------------------------------------------------+
 2|  App Name  |    App ID    |    App   |  SQL DF  |     GPU     | Estimated | Estimated | Estimated |  Recommendation    |      Unsupported Execs        |Unsupported Expressions|
 3|            |              | Duration | Duration | Opportunity |    GPU    |    GPU    |    GPU    |                    |                               |                       |
 4|            |              |          |          |             |  Duration |  Speedup  |    Time   |                    |                               |                       |
 5|            |              |          |          |             |           |           |   Saved   |                    |                               |                       |
 6+============+==============+==========+==========+=============+===========+===========+===========+====================+=======================================================+
 7| appName-01 | app-ID-01-01 |    898429|    879422|       879422|  273911.92|       3.27|  624517.06|Strongly Recommended|                               |                       |
 8+------------+--------------+----------+----------+-------------+-----------+-----------+-----------+--------------------+-------------------------------------------------------+
 9| appName-02 | app-ID-02-01 |      9684|      1353|         1353|    8890.09|       1.08|      793.9|     Not Recommended|Filter;SerializeFromObject;S...|           hex         |
10+------------+--------------+----------+----------+-------------+-----------+-----------+-----------+--------------------+-------------------------------------------------------+
In the above example, two application event logs were analyzed. “app-ID-01-01” is “Strongly Recommended” because Estimated GPU Speedup is ~3.27. On the other hand, the estimated acceleration running “app-ID-02-01” on the GPU is not high enough; hence the app is not recommended.
Per SQL Query Report Summary#
The Qualification tool has an option to generate a report at the per SQL query level. It generates a brief summary that includes the projected queries performance if the query is run on the GPU. Beside sending the summary to
STDOUT, the Qualification tool generates text asrapids_4_spark_qualification_output_persql.log
The summary report outputs the following information: “App Name”, “App ID”, “SQL ID”, “SQL Description”, “SQL DF duration”, “GPU Opportunity”, “Estimated GPU Duration”, “Estimated GPU Speed-up”, “Estimated GPU Time Saved”, and “Recommendation”.
Note
The duration(s) reported are in milliseconds. Sample output in text:
 1+------------+--------------+----------+---------------+----------+-------------+-----------+-----------+-----------+--------------------+
 2|  App Name  |    App ID    |  SQL ID  |      SQL      |  SQL DF  |     GPU     | Estimated | Estimated | Estimated |  Recommendation    |
 3|            |              |          |  Description  | Duration | Opportunity |    GPU    |    GPU    |    GPU    |                    |
 4|            |              |          |               |          |             |  Duration |  Speedup  |    Time   |                    |
 5|            |              |          |               |          |             |           |           |   Saved   |                    |
 6+============+==============+==========+===============+==========+=============+===========+===========+===========+====================+
 7| appName-01 | app-ID-01-01 |         1|        query41|       571|          571|     187.21|       3.05|     383.78|Strongly Recommended|
 8+------------+--------------+----------+---------------+----------+-------------+-----------+-----------+-----------+--------------------+
 9| appName-02 | app-ID-02-01 |         3|        query44|      1116|            0|    1115.98|        1.0|       0.01|     Not Recommended|
10+------------+--------------+----------+---------------+----------+-------------+-----------+-----------+-----------+--------------------+
Detailed App Report#
Entire App report#
The first part of the detailed report is saved as rapids_4_spark_qualification_output.csv. The apps are processed and ranked by the Estimated GPU Speed-up. In addition to the fields listed in the “Report Summary”, it shows all the app fields. The duration(s) are reported are in milliseconds.
Per SQL report#
The second file is saved as rapids_4_spark_qualification_output_persql.csv. This contains the per SQL query report in CSV format.
Sample output in text:
1+---------------+-----------------------+------+----------------------------------------------------------+---------------+---------------+----------------------+---------------------+------------------------+--------------------+
2|       App Name|                 App ID|SQL ID|                                           SQL Description|SQL DF Duration|GPU Opportunity|Estimated GPU Duration|Estimated GPU Speedup|Estimated GPU Time Saved|      Recommendation|
3+===============+=======================+======+==========================================================+===============+===============+======================+=====================+========================+====================+
4|NDS - Power Run|app-20220702220255-0008|   103|                                                   query87|          15871|          15871|               4496.03|                 3.53|                11374.96|Strongly Recommended|
5|NDS - Power Run|app-20220702220255-0008|   106|                                                   query38|          11077|          11077|               3137.96|                 3.53|                 7939.03|Strongly Recommended|
6+---------------+-----------------------+------+----------------------------------------------------------+---------------+---------------+----------------------+---------------------+------------------------+--------------------+
Stages report#
The third file is saved as rapids_4_spark_qualification_output_stages.csv.
Sample output in text:
1+--------------+----------+-----------------+------------+---------------+-----------+
2|    App ID    | Stage ID | Average Speedup | Stage Task |  Unsupported  |   Stage   |
3|              |          |      Factor     |  Duration  | Task Duration | Estimated |
4+==============+==========+=================+============+===============+===========+
5| app-ID-01-01 |       25 |             2.1 |         23 |             0 |     false |
6+--------------+----------+-----------------+------------+---------------+-----------+
7| app-ID-02-01 |       29 |            1.86 |          0 |             0 |      true |
8+--------------+----------+-----------------+------------+---------------+-----------+
Execs report#
The last file is saved rapids_4_spark_qualification_output_execs.csv. Similar to the app and stage information, the table shows estimated GPU performance of the SQL Dataframe operations.
Sample output in text:
 1+--------------+--------+---------------------------+-----------------------+--------------+----------+----------+-----------+--------+----------------------------+---------------+-------------+
 2|    App ID    | SQL ID |         Exec Name         |    Expression Name    | Task Speedup |   Exec   | SQL Node |  Exec Is  |  Exec  |        Exec Children       | Exec Children | Exec Should |
 3|              |        |                           |                       |    Factor    | Duration |    Id    | Supported | Stages |                            |    Node Ids   |    Remove   |
 4+==============+========+===========================+=======================+==============+==========+==========+===========+========+============================+===============+=============+
 5| app-ID-02-01 |      7 | Execute CreateViewCommand |                       |          1.0 |        0 |        0 |     false |        |                            |               |       false |
 6+--------------+--------+---------------------------+-----------------------+--------------+----------+----------+-----------+--------+----------------------------+---------------+-------------+
 7| app-ID-02-01 |     24 |                   Project |                       |          2.0 |        0 |       21 |      true |        |                            |               |       false |
 8+--------------+--------+---------------------------+-----------------------+--------------+----------+----------+-----------+--------+----------------------------+---------------+-------------+
 9| app-ID-02-01 |     24 |              Scan parquet |                       |          2.0 |      260 |       36 |      true |     24 |                            |               |       false |
10+--------------+--------+---------------------------+-----------------------+--------------+----------+----------+-----------+--------+----------------------------+---------------+-------------+
11| app-ID-02-01 |     15 | Execute CreateViewCommand |                       |          1.0 |        0 |        0 |     false |        |                            |               |       false |
12+--------------+--------+---------------------------+-----------------------+--------------+----------+----------+-----------+--------+----------------------------+---------------+-------------+
13| app-ID-02-01 |     24 |                   Project |                       |          2.0 |        0 |       14 |      true |        |                            |               |       false |
14+--------------+--------+---------------------------+-----------------------+--------------+----------+----------+-----------+--------+----------------------------+---------------+-------------+
15| app-ID-02-01 |     24 |     WholeStageCodegen (6) | WholeStageCodegen (6) |          2.8 |      272 |        2 |      true |     30 | Project:BroadcastHashJoin: |         3:4:5 |       false |
16|              |        |                           |                       |              |          |          |           |        |              HashAggregate |               |             |
17+--------------+--------+---------------------------+-----------------------+--------------+----------+----------+-----------+--------+----------------------------+---------------+-------------+
How to compile the tools jar#
See instructions here: NVIDIA/spark-rapids-tools
If any input is a S3 file path or directory path, 2 extra steps are needed to access S3 in Spark:
Download the matched jars based on the Hadoop version:
hadoop-aws-<version>.jaraws-java-sdk-<version>.jar
Take Hadoop 2.7.4 for example, we can download and include below jars in the ‘–jars’ option to spark-shell or spark-submit: hadoop-aws-2.7.4.jar and aws-java-sdk-1.7.4.jar
In $SPARK_HOME/conf, create
hdfs-site.xmlwith below AWS S3 keys inside:
 1<?xml version="1.0"?>
 2<configuration>
 3<property>
 4  <name>fs.s3a.access.key</name>
 5  <value>xxx</value>
 6</property>
 7<property>
 8  <name>fs.s3a.secret.key</name>
 9  <value>xxx</value>
10</property>
11</configuration>
Please refer to this doc on more options about integrating hadoop-aws module with S3.