Log Management for UCF Applications
Telemetry is essentially the readings logs of the various components. It plays a vital role in checking the health of the constituent microservices. It is essential to ship logs to a log management system where the logs can be stored, analyzed and alerts generated for any issues.
Prerequisites
Microservices used in the application must log to stdout / stderr.
Enable Logging in MicroK8s Cluster
It is very easy to enable log management in a MicroK8s Cluster with the Elasticsearch, Fluentd and Kibana (the EFK stack).
To demonstrate logging, we will use the application from the tutorial Sharing Storage between Pod Replicas and assume it has been already deployed.
Enable the EFK stack
First enable the community add-on and then the fluentd add-on.
$ microk8s enable community
...
Community repository is now enabled

$ microk8s enable fluentd
...
Fluentd-Elasticsearch is enabled
Next, forward the kibana service port to access the Kibana service from any host.
$ microk8s kubectl port-forward -n kube-system service/kibana-logging --address 0.0.0.0 8181:5601
Forwarding from 0.0.0.0:8181 -> 5601
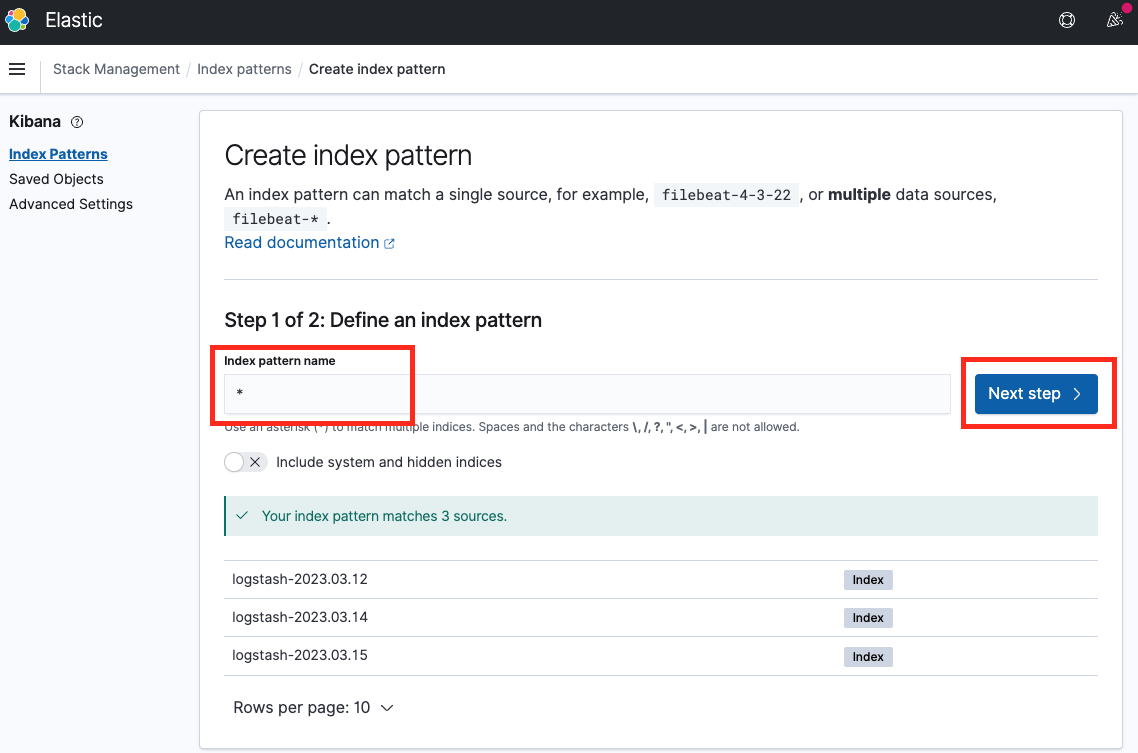
Create a new index pattern
Now open http://<NODE_IP>:8181/app/management/kibana/indexPatterns/create in a browser where NODE_IP is the IP address of the machine where the kubectl port-forward command is running.
Enter * or logstash-* as the index pattern and click on Next step
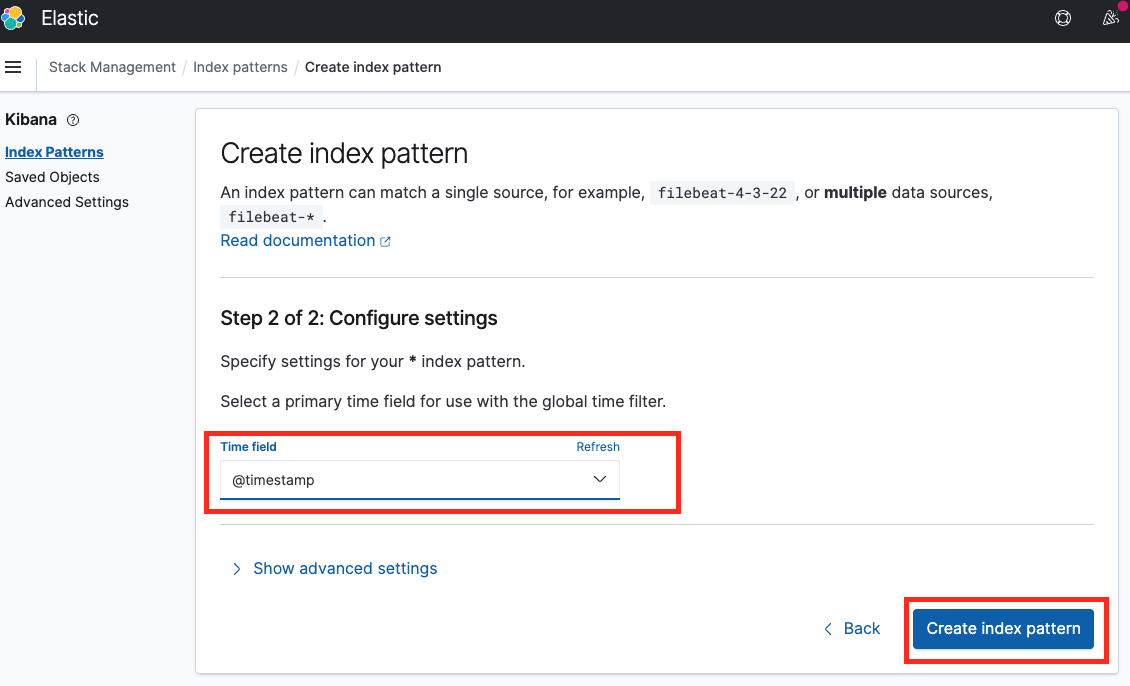
Next, select @timestamp as the timestamp field and click on Create index pattern
View logs
Now go to http://<NODE_IP>:8181/app/discover. The application logs along with other Kubernetes and system logs should be visible here.
Lets filter out the data to only show curl-client logs and only show a few selected fields.
Next, select @timestamp as the timestamp field and click on Create index pattern.
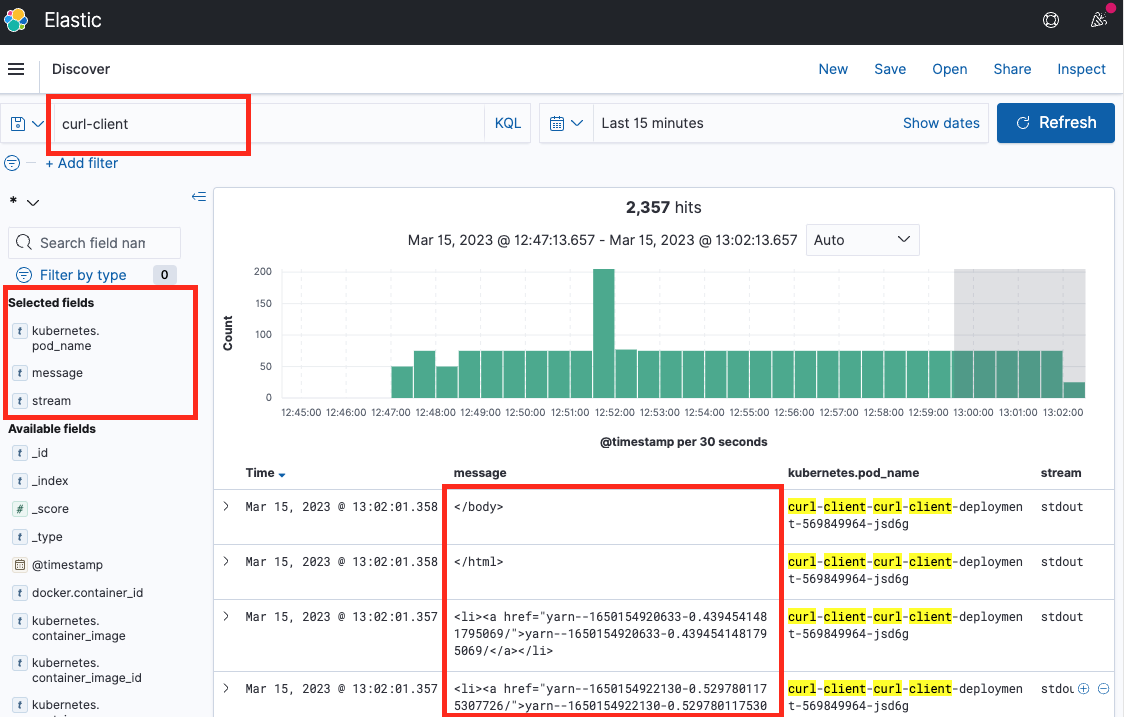
Thus we can see logs from our application in the EFK stack.