


Managing vGPUs from a guest VM#
NVIDIA vGPU software supports monitoring and control within a guest VM of vGPUs or pass-through GPUs that are assigned to the VM. The scope of management interfaces and tools used within a guest VM is limited to the guest VM within which they are used. They cannot monitor any other GPUs in the virtualization platform.
For monitoring from a guest VM, certain properties do not apply to vGPUs. The values that the NVIDIA vGPU software management interfaces report for these properties indicate that the properties do not apply to a vGPU.
NVIDIA vGPU Software Server Interfaces for GPU Management from a Guest VM#
The NVIDIA vGPU software server interfaces that are available for GPU management from a guest VM depend on the guest operating system that is running in the VM.
Interface |
Guest OS |
Notes |
|---|---|---|
|
Windows, 64-bit Linux |
Command line, interactive use |
NVIDIA Management Library (NVML) |
Windows, 64-bit Linux |
Integration of NVIDIA GPU management with third-party applications |
NVIDIA Control Panel |
Windows |
Detailed control of graphics settings, basic configuration reporting |
Windows Performance Counters |
Windows |
Performance metrics provided by Windows Performance Counter interfaces |
NVWMI |
Windows |
Detailed configuration and performance metrics provided by Windows WMI interfaces |
How GPU engine usage is reported#
Usage of GPU engines is reported for vGPUs as a percentage of the vGPU’s maximum possible capacity on each engine. The GPU engines are as follows:
Graphics/SM
Memory controller
Video encoder
Video decoder
The amount of a physical engine’s capacity that a vGPU is permitted to occupy depends on the scheduler under which the GPU is operating:
NVIDIA vGPUs operating under the Best Effort Scheduler and the Equal Share Scheduler are permitted to occupy the full capacity of each physical engine if no other vGPUs are contending for the same engine. Therefore, if a vGPU occupies 20% of the entire graphics engine in a particular sampling period, its graphics usage as reported inside the VM is 20%.
NVIDIA vGPUs operating under the Fixed Share Scheduler can occupy no more than their allocated share of the graphics engine. Therefore, if a vGPU has a fixed allocation of 25% of the graphics engine, and it occupies 25% of the engine in a particular sampling period, its graphics usage as reported inside the VM is 100%.
Using NVML to manage vGPUs#
NVIDIA vGPU software supports monitoring and control within a guest VM by using NVML.
Determining whether a GPU is a vGPU or pass-through GPU#
NVIDIA vGPUs are presented in guest VM management interfaces in the same fashion as pass-through GPUs.
To determine whether a GPU device in a guest VM is a vGPU or a pass-through GPU, call the NVML function nvmlDeviceGetVirtualizationMode().
A GPU reports its virtualization mode as follows:
A GPU operating in pass-through mode reports its virtualization mode as
NVML_GPU_VIRTUALIZATION_MODE_PASSTHROUGH.A vGPU reports its virtualization mode as
NVML_GPU_VIRTUALIZATION_MODE_VGPU.
Physical GPU properties that do not apply to a vGPU#
Properties and metrics other than GPU engine usage are reported for a vGPU in a similar way to how the same properties and metrics are reported for a physical GPU. However, some properties do not apply to vGPUs. The NVML device query functions for getting these properties return a value that indicates that the properties do not apply to a vGPU. For details of NVML device query functions, see Device Queries in NVML API Reference Manual.
GPU identification properties that do not apply to a vGPU#
GPU Property |
NVML Device Query Function |
NVML return code on vGPU |
|---|---|---|
Serial Number |
vGPUs are not assigned serial numbers. |
|
GPU UUID |
vGPUs are allocated random UUIDs. |
|
VBIOS Version |
vGPU VBIOS version is hard-wired to zero. |
|
GPU Part Number |
|
|
InfoROM properties that do not apply to a vGPU#
The InfoROM object is not exposed on vGPUs. All the functions in the following table return NOT_SUPPORTED.
GPU Property |
NVML Device Query Function |
|---|---|
Image Version |
|
OEM Object |
|
ECC Object |
|
Power Management Object |
|
GPU operation mode properties that do not apply to a vGPU#
GPU Property |
NVML Device Query Function |
NVML return code on vGPU |
|---|---|---|
GPU Operation Mode (Current) |
Tesla GPU operating modes are not supported on vGPUs. |
|
GPU Operation Mode (Pending) |
Tesla GPU operating modes are not supported on vGPUs. |
|
Compute Mode |
A vGPU always returns |
|
Driver Model |
A vGPU supports WDDM mode only in Windows VMs. |
|
PCI Express properties that do not apply to a vGPU#
PCI Express characteristics are not exposed on vGPUs. All the functions in the following table return NOT_SUPPORTED.
GPU Property |
NVML Device Query Function |
|---|---|
Generation Max |
|
Generation Current |
|
Link Width Max |
|
Link Width Current |
|
Bridge Chip Type |
|
Bridge Chip Firmware |
|
Replays |
|
TX Throughput |
|
RX Throughput |
|
Environmental properties that do not apply to a vGPU#
All the functions in the following table return NOT_SUPPORTED.
GPU Property |
NVML Device Query Function |
|---|---|
Fan Speed |
|
Clocks Throttle Reasons |
|
Current Temperature |
|
Shutdown Temperature |
|
Slowdown Temperature |
|
Power consumption properties that do not apply to a vGPU#
vGPUs do not expose physical power consumption of the underlying GPU. All the functions in the following table return NOT_SUPPORTED.
GPU Property |
NVML Device Query Function |
|---|---|
Management Mode |
|
Draw |
|
Limit |
|
Default Limit |
|
Enforced Limit |
|
Min Limit |
|
Max Limit |
|
ECC properties that do not apply to a vGPU#
Error-correcting code (ECC) is not supported on vGPUs. All the functions in the following table return NOT_SUPPORTED.
GPU Property |
NVML Device Query Function |
|---|---|
Mode |
|
Error Counts |
|
Retired Pages |
|
Clocks properties that do not apply to a vGPU#
All the functions in the following table return NOT_SUPPORTED.
GPU Property |
NVML Device Query Function |
|---|---|
Application Clocks |
|
Default Application Clocks |
|
Max Clocks |
|
Policy: Auto Boost |
|
Policy: Auto Boost Default |
|
Building an NVML-enabled application for a guest VM#
To build an NVML-enabled application, refer to the sample code included in the SDK.
Using Windows Performance Counters to monitor GPU performance#
In Windows VMs, GPU metrics are available as Windows Performance Counters through the NVIDIA GPU object.
For access to Windows Performance Counters through programming interfaces, refer to the performance counter sample code included with the NVIDIA Windows Management Instrumentation SDK.
On vGPUs, the following GPU performance counters read as 0 because they are not applicable to vGPUs:
% Bus Usage
% Cooler rate
Core Clock MHz
Fan Speed
Memory Clock MHz
PCI-E current speed to GPU Mbps
PCI-E current width to GPU
PCI-E downstream width to GPU
Power Consumption mW
Temperature C
Using NVWMI to monitor GPU performance#
In Windows VMs, Windows Management Instrumentation (WMI) exposes GPU metrics in the ROOT\CIMV2\NV namespace through NVWMI. NVWMI is included with the NVIDIA driver package. The NVWMI API Reference in Windows Help format is available for download from the NVIDIA website.
For access to NVWMI through programming interfaces, use the NVWMI SDK. The NVWMI SDK, with white papers and sample programs, is included in the NVIDIA Windows Management Instrumentation SDK.
On vGPUs, some instance properties of the following classes do not apply to vGPUs:
GpuPcieLink
Gpu instance properties that do not apply to vGPUs#
|
Value reported on vGPU |
|---|---|
|
-1 |
|
-1 |
|
0 |
|
0 |
|
0 |
|
0 |
|
1 |
|
2500 |
|
0 |
|
-1 |
|
-1 |
|
-1 |
|
0 |
|
— |
|
0 |
PcieLink instance properties that do not apply to vGPUs#
No instances of PcieLink are reported for vGPU.
Enabling and disabling GPM metrics#
GPU performance monitoring (GPM) metrics are supported on all Windows guest OS releases that are supported by NVIDIA vGPU software. GPM metrics are supported only on MIG-backed vGPUs that occupy an entire GPU instance on GPUs based on the NVIDIA Blackwell architecture or a later architecture.
GPM metrics are disabled by default. To monitor GPU performance with GPM metrics, you must first enable them.
This task requires administrator privileges.
Perform this task in an elevated Windows PowerShell window (Run as administrator) in the guest VM.
Before you begin, ensure that the NVWMI service is running.
To enable GPM metrics, type the following command:
Invoke-CimMethod -Namespace 'root\cimv2\nv' -ClassName System -MethodName enableGpmPerfCounterGPM metrics do not remain enabled after the NVWMI service or the guest VM is restarted. After the NVWMI service or the VM is restarted, enable GPM metrics again.
To disable GPM metrics, type the following command:
Invoke-CimMethod -Namespace 'root\cimv2\nv' -ClassName System -MethodName disableGpmPerfCounter
Monitoring GPU performance with GPM metrics#
GPM metrics are supported only on MIG-backed vGPUs that occupy an entire GPU instance on GPUs based on the NVIDIA Blackwell architecture or a later architecture.
Before you begin, ensure that the following prerequisites are met:
The GPU is in MIG mode.
The GPU supports GPM.
GPM metrics are enabled as explained in Enabling and disabling GPM metrics.
If any of these prerequisites is not met, any attempt to monitor GPU performance with GPM metrics returns no data.
The following table maps each GPM metric’s WMI property to its Performance Monitor counter.
WMI property |
Performance Monitor counter |
|---|---|
|
% Graphics Util |
|
% SM Util |
|
% SM Occupancy |
|
% Integer Util |
|
% Any Tensor Util |
|
% DFMA Tensor Util |
|
% HMMA Tensor Util |
|
% IMMA Tensor Util |
|
% DRAM BW Util |
|
% FP64 Util |
|
% FP32 Util |
|
% FP16 Util |
|
% NVDEC 0 Util-% NVDEC 7 Util |
|
% NVJPG 0 Util-% NVJPG 7 Util |
|
% NVOFA 0 Util-% NVOFA 1 Util |
|
% NVENC 0 Util-% NVENC 3 Util |
You can monitor GPU performance with GPM metrics by using either of the following methods:
Using any WMI client to query the
GpmMetricsclass for GPM metricsFor example, you can use the following command from a PowerShell prompt in a Windows guest VM.
Get-CimInstance -Namespace 'root\cimv2\nv' -ClassName GpmMetricsThe following example shows the query results. In the query results,
instanceCountis 1. The example omits the remaining metric properties, which are listed in the preceding table.id : 1 instanceCount : 1 gpuInstanceId : {0} computeInstanceId : {0} smUtil : {0} smOccupancy : {0} ...
Using any application that reads performance counters to read the
NVIDIA GPU GPMcountersFor example, you can use Windows Performance Monitor to view the counters under the
NVIDIA GPU GPMobject.The object lists one instance, named in the following form:
GPU<index> GI<id> CI<id> (GPU Id : <id>)Selecting that instance makes the GPM counters available for monitoring.
The following example shows the
NVIDIA GPU GPMobject in the Add Counters dialog box.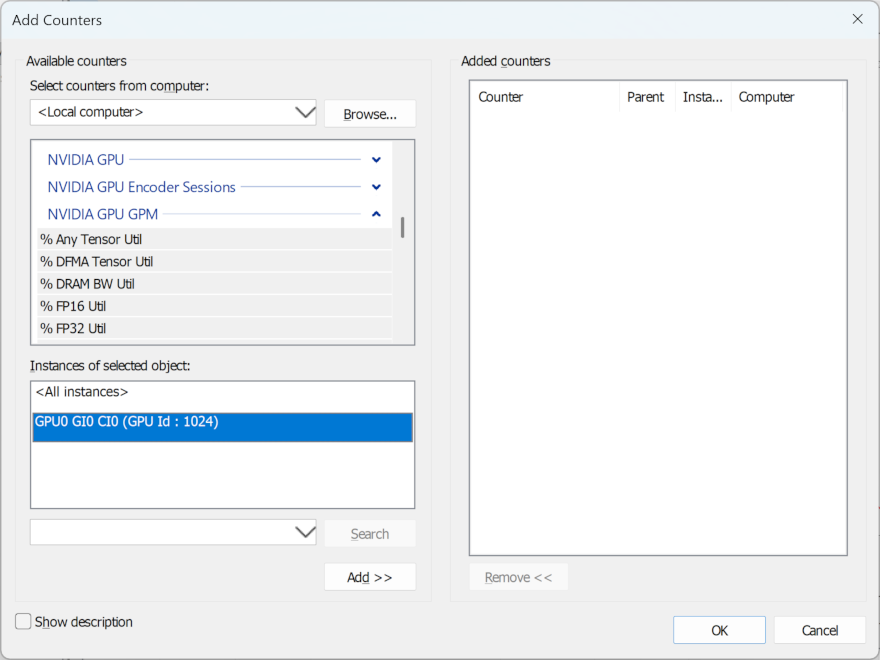
Figure 40
NVIDIA GPU GPMobject in the Add Counters dialog box#
The first time you query or view GPM metrics after they are enabled, all metrics are 0 because they are derived from a pair of samples. All metrics for an idle MIG instance are also 0.