Monitoring
Being able to monitor your systems is the first step in being able to manage them. NVIDIA provides some very useful command line tools that can be used specifically for monitoring the GPUs.
DCGM
- Active health monitoring
- Diagnostics
- System validation
- Policies
- Power and clock management
- Group configuration and accounting
The DCGM Toolkit comes with a User Guide that explains how to use the command-line tool called dcgmi, as well as an API Guide (there is no GUI with DCGM). In addition to the command-line tool, DCGM also comes with headers and libraries for writing your own tools in Python or C.
Rather than treat each GPU as a separate resource, DCGM allows you to group them and then apply policies or tuning options to the group. This also includes being able to run diagnostics on the group.
There are several best practices for using DCGM with the DGX appliances. The first is that the command line tool can run diagnostics on the GPUs. You could create a simple cron job on the DGX to check the GPUs and store the results either into a simple flat file or into a simple database.
- Level 1 runs in just a few seconds.
- Level 3 takes about 4 minutes to run. An example of the output from running a level 3 diagnostic is below.
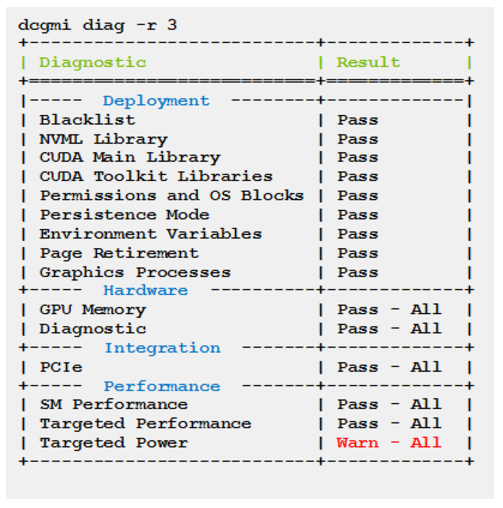
It is fairly easy to parse this output looking for Error in the output. You can easily send an email or raise some other alert if an Error is discovered.
A second best practice for utilizing DCGM is if you have a resource manager (in other words, a job scheduler) installed. Before the user’s job is run, the resource manager can usually perform what is termed a prologue. That is, any system calls before the user’s job is executed. This is a good place to run a quick diagnostic and also use DCGM to start gathering statistics on the job. Below is an example of statistics gathering for a particular job:
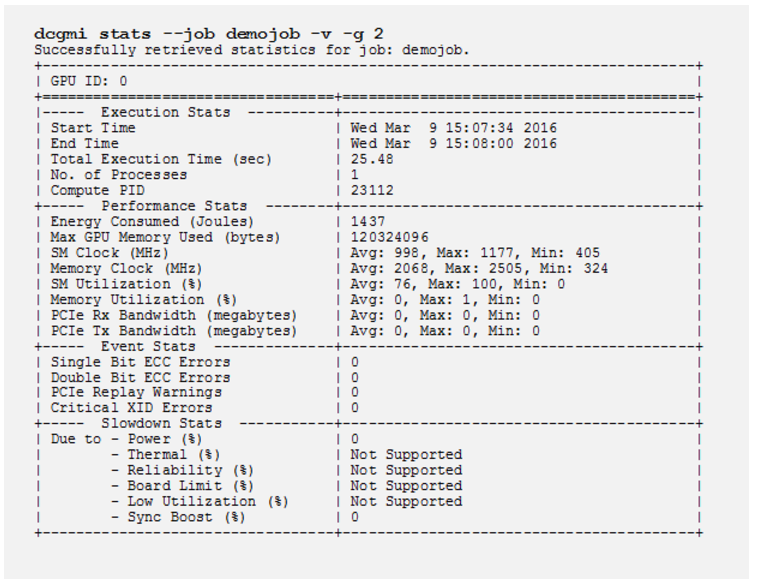
When the user’s job is complete, the resource manager can run something called an epilogue. This is a place where the system can run some system calls for doing such things as cleaning up the environment or summarizing the results of the run including the GPU stats as from the above command. Consult the user’s guide to learn more about stats with DCGM.
If you create a set of prologue and epilogue scripts that run diagnostics you might want to consider storing the results in a flat file or a simple database. This allows you to keep a history of the diagnostics of the GPUs so you can pinpoint any issues (if there are any).
A third way to effectively use DCGM is to combine it with a parallel shell tool such as pdsh. With a parallel shell you can run the same command across all of the nodes in a cluster or a specific subset of nodes. You can use it to run dcgmi to run diagnostics across several DGX appliances or a combination of DGX appliances and non-GPU enabled systems. You can easily capture this output and store it in a flat file or a database. Then you can parse the output and create warnings or emails based on the output.
Having all of this diagnostic output is also an excellent source of information for creating reports regarding topics such as utilization.
For more information about DCGM, see NVIDIA Data Center GPU Manager Simplifies Cluster Administration.
Using ctop For Monitoring
Containers can make monitoring a little more challenging than the classic system monitoring. One of the classic tools used by system administrators is top. By default, top displays the load on the system as well as the ordered list of processes on the system.
Monitoring A Specific DGX Using nvidia-smi
As previously discussed, DCGM is a great tool for monitoring GPUs across multiple nodes. Sometimes, a system administrator may want to monitor a specific DGX system in real-time. An easy way to do this is to login into the DGX and run nvidia-smi in conjunction with the watch command.
For example, you could run the command watch -n 1 nvidia-smi that runs the nvidia-smi command every second (-n 1 means to run the command with 1 second intervals). You could also add the -d option to watch so that it highlights changes or differences since the last time it was run. This allows you to easily see what has changed.
Just like ctop, you can use nvidia-smi and watch in a pane in a tmux terminal to keep an eye on a relatively small number of DGX servers.