You are here: Developer Tools > Desktop Developer Tools > NVIDIA Nsight Visual Studio Edition > Pipe Utilization

Overview

Each Streaming Multiprocessor (SM) of a CUDA device features numerous hardware units that are specialized in performing specific task. At the chip level those units provide execution pipelines to which the warp schedulers dispatch instructions to. For example, texture units provide the ability to execute texture fetches and perform texture filtering. Load/Store units fetch and save data to memory. Understanding the utilization of those pipelines and knowing how close they are to the peak performance of the target device are key information for analyzing the efficiency of executing a kernel; and also allows to identify performance bottlenecks caused by oversubscribing to a certain type of pipeline.

Background

The Kepler GK110 whitepaper and the NVIDIA GeForce GTX 680 whitepaper both describe and compare the architecture details of the most recent CUDA compute devices. The following table gives a brief summary of the unit counts per SM and their corresponding pipeline throughputs per cycle:

Fermi (cc 2.0) Kepler (cc 3.x)
Units Count Throughput Unit Count Throughput
Load/Store 16 16 32 32
Texture 4 4 16 16
Arithmetic FP32 32 64 192 192
SFU 4 8 32 32

With respect to those architecture throughput numbers, the Pipeline Utilization metrics report the observed utilization for each pipeline at runtime. High pipeline utilization states that the corresponding compute resources were used heavily and kept busy often during the execution of the kernel. Low values indicate that the pipeline is not frequently used and resources were idle. The results for individual pipelines are independent of each other; summing up two or more pipeline utilization percentages does not result in a meaningful value. As the pipeline metrics are reported as an average over the duration of the kernel launch, a low value does not necessarily rule out that the pipeline was a bottleneck at some point in time during the kernel execution.

Arithmetic instructions are executed by a multitude of pipelines as hinted in the previous table for the two examples of 32bit floating point instructions and special functions operations. Those pipelines offer highly different throughputs, in turn leading to varying Throughputs of Native Arithmetic Instructions as documented by the CUDA C Programming Guide. For the CUDA devices supported by this experiment those arithmetic throughputs are:

Compute Capability
2.0 2.1 3.0 3.5
32-bit floating-point add, multiply, multiply-add 32 48 192 192
64-bit floating-point add, multiply, multiply-add ≤16 4 8 64
32-bit floating-point reciprocal, reciprocal square root, base-2 logarithm, base 2 exponential, sine, cosine 4 8 32 32
32-bit integer add, extended-precision add, subtract, extended-precision subtract, minimum, maximum 32 48 160 160
32-bit integer multiply, multiply-add, extended-precision multiply-add, sum of absolute difference, population count, count of leading zeros, most significant non-sign bit 16 16 32 32
32-bit integer shift 16 16 32 ≤64
32-bit integer bit reverse, bit field extract/insert 16 16 32 64
Logical operations 32 48 160 160
Warp shuffle - - 32 32
Type conversions from 8-bit and 16-bit integer to 32-bit types 16 16 128 128
Type conversions from and to 64-bit types ≤16 4 8 32
All other type conversions 16 16 32 32

By definition the instruction throughput states how many operations each SM can process per cycle. In other words, an operation with a high throughput poses less cost to issue than an operation with a lower instruction throughput. The Arithmetic Workload uses this simplistic cost model by weighting issued instruction counts with the corresponding reciprocal instruction throughput. Doing so allows evaluating which type of arithmetic instruction poses how much of an overall processing cost. This is especially useful for kernels with a high arithmetic pipeline utilization to identify which class of arithmetic operations might have hit the available throughput limit.

Charts

Pipe Utilization

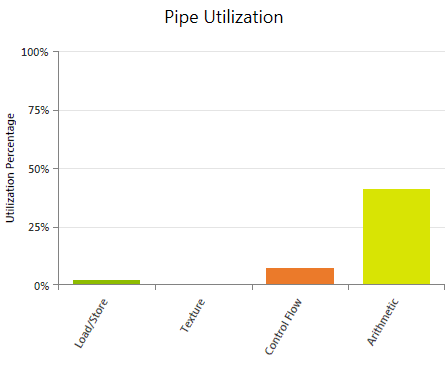
Shows the average utilization of the four major logical pipelines of the SMs during the execution of the kernel. Useful for investigating if a pipeline is oversubscribed and therefore is limiting the kernel's performance. Also helpful to estimate if adding more work will scale well or if a pipeline limit will be hit. In this context adding more work may refer to adding more arithmetic workload (for example by increasing the accuracy of some calculations), increasing the number of memory operations (including introducing register spilling), or increasing the number of Active Warps per SM with the goal of improving instruction latency hiding.

The reported values are averages across the duration of the kernel execution. A low utilization percentage does not guarantee that the pipeline was never oversubscribed at some point during the kernel execution.

Metrics

Load / Store Covers all issued instructions that trigger a request to the memory system of the target device - excluding texture operations. Accounts for load and store operations to global, local, shared memory as well as any atomic operation. Also includes register spills. Devices of compute capability 3.5 and higher support loading global memory through the Read-Only Data Cache (LDG); those operations do not contribute to the load/store group, but are accounted for in the texture pipeline utilization instead. In cases of high load/store utilization, collect the Memory Experiments to gain more information about the type, count, and efficiency of the executed memory operations.

Texture Covers all issued instructions that perform a texture fetch and, for devices of compute capability 3.5 and higher, global memory loads via the Read-Only Data Cache (LDG). If this metric is high, run the Memory - Texture experiment to evaluate the executed texture requests in more detail.

Control Flow Covers all issued instructions that can have an effect on the control flow, such as branch instructions (BRA,BRX), jump instructions (JMP,JMX), function calls (CAL,JCAL), loop control instructions (BRK,CONT), return instructions (RET), program termination (EXIT), and barrier synchronization (BAR). See the Instruction Set Reference for more details on these individual instructions. If the control flow utilization is high, run the Branch Statistics experiment; this can help understanding the effects of control flow on the overall kernel execution performance.

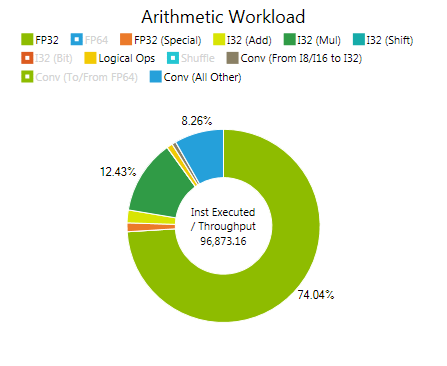
Arithmetic Covers all issued floating point instructions, integer instructions, conversion operations, and movement instructions. See the Instruction Set Reference for a detailed list of assembly instructions for each of these groups. If the arithmetic pipeline utilization is high, check the Arithmetic Workload chart to identify the type of instruction with the highest costs.

Arithmetic Workload

Provides the distribution of estimated costs for numerous classes of arithmetic instructions. The cost model is based on the issue count weighted by the reciprocal of the corresponding instruction throughput. The instruction classes match the rows of the arithmetic throughput table given in the background section of this document.

Arithmetic instructions are executed by a multitude of pipelines on the chip, which may operate in parallel. As a consequence the Arithmetic Workload distribution is not a true partition of the Arithmetic Pipeline percentage shown the Pipeline Utilization chart; however, the instruction type with the highest cost estimate is likely causing the highest on-chip pipeline utilization.

Metrics

All references to individual assembly instructions in the following metric descriptions refer to the native instruction set architecture (ISA) of CUDA devices as further described in the Instruction Set Reference.

FP32 Estimated workload for all 32-bit floating-point add (FADD), multiply (FMUL), multiply-add (FMAD) instructions.

FP64 Estimated workload for all 64-bit floating-point add (DADD), multiply (DMUL), multiply-add (DMAD) instructions.

FP32 (Special) Estimated workload for all 32-bit floating-point reciprocal (RCP), reciprocal square root (RSQ), base-2 logarithm (LG2), base 2 exponential (EX2), sine (SIN), cosine (COS) instructions.

I32 (Add) Estimated workload for all 32-bit integer add (IADD), extended-precision add, subtract, extended-precision subtract, minimum (IMNMX), maximum instructions.

I32 (Mul) Estimated workload for all 32-bit integer multiply (IMUL), multiply-add (IMAD), extended-precision multiply-add, sum of absolute difference (ISAD), population count (POPC), count of leading zeros, most significant non-sign bit (FLO).

I32 (Shift) Estimated workload for all 32-bit integer shift left (SHL), shift right (SHR), funnel shift (SHF) instructions.

I32 (Bit) Estimated workload for all 32-bit integer bit reverse, bit field extract (BFE), bit field insert (BFI) instructions.

Logical Ops Estimated workload for all logical operations (LOP).

Shuffle Estimated workload for all warp shuffle (SHFL) instructions.

Conv (From I8/I16 to I32) Estimated workload for all type conversions from 8-bit and 16-bit integer to 32-bit types (subset of I2I).

Conv (To/From FP64) Estimated workload for all type conversions from and to 64-bit types (subset of I2F, F2I, and F2F).

Conv (All Other) Estimated workload for all all other type conversions (remaining subset of I2I, I2F, F2I, and F2F).

Analysis


of

NVIDIA GameWorks Documentation Rev. 1.0.150630 ©2015. NVIDIA Corporation. All Rights Reserved.